

Abstract
During the past decade the remarkable progress in molecular genetics and the possibility to engineer cells to express genes reporting on the activity of specific promoters has produced major changes in biological research. The description and validation of reporter mice for non-invasive assessment of biological and biochemical processes in living subjects and the results obtained with the models reporting on the activity of estrogen and peroxisome proliferator receptors clearly showed that such technologies have the potential to enhance our understanding of disease and drug activity. Although reporter-gene technology is in its infancy, reporter animals already represent a valuable tool for biomedical investigation. The present chapter aims at critically illustrating the methodology to be applied when dealing with reporter systems and in vivo imaging.
Keywords: Reporter mice, molecular imaging, intracellular receptors, estrogen receptor, bioluminescence, CCD camera imaging
1. Introduction
Intracellular receptors (IR) belong to a large family of molecules of growing interest because of their relevance for the control of reproductive and major metabolic functions in mammals (1). Most IR are present in a wide variety of cells and tissues and some of them may be considered as ubiquitously expressed. IR are transcription factors regulated by lipophylic hormones. Upon binding to their cognate ligands IR undergo a series of structural modifications facilitating the attraction of co-regulators thus inducing/blocking the formation of the transcription initiation complex (2, 3). Co-regulators are indispensable elements for IR activity; because of that, IR action may be finely tuned depending on the specific tridimensional conformation induced by the given ligand and by the accessibility of co-activators and co-repressors. The availability of co-activators and co-repressors is cell-specific and variable in time (4, 5). This “tripartite” mechanism of action provides IR with a significant variety of effects on transcription depending on the cell and promoter taken in consideration. The peculiar mechanism of action and the wide distribution of IR has represented an obstacle for the identification of their precise physiological functions and for the generation of drugs with a well-focused therapeutic activity.
However, the nature of transcription factors has facilitated the generation of novel experimental model systems, like reporter mice. Applying molecular imaging with reporter mice enables one to investigate IR spatio-temporal activity in living organisms. Such an approach facilitates the understanding of their pathophysiological activity and the identification of drugs devoid of major side-effects (6, 7). These animals have already shown their potential for physiological and pharmaco-toxicological studies (8–10). The present protocol aims at indicating the modalities for the application of reporter mice engineered to express a bioluminescent protein in biological studies as exemplified by showing data obtained in our lab with the ERE-Luc reporter mouse model.
2. Materials
2.1. Reporter Mice
With the term reporter mice we refer to animals genetically engineered to express a reporter gene under the control of IR responsive promoters. Appropriate care must be taken to ensure that the reporter is not susceptible to local restraint (such as silencers or enhancers) and that, in all cells, is freely accessible to the activated IR and to the transcriptional apparatus. From a theoretical point of view, several protocols may be applied to the generation of reporter animals; however, to our knowledge, only a few of the models currently available ensure an expression of the reporter which is ubiquitous and appropriately reflects the state of activity of the receptor (see Notes 1, 2).
The strategy followed by our laboratory in the production of transgenic reporter mice consists in the exploitation of insulator sequences. For the generation of the transgenic reporter mouse, the transgene to be injected in the male pronucleus is flanked by insulator sequences (such as matrix attachment regions –MAR- and beta-globin hypersensitive site 4 –HS4-): this has enabled the production of animals where the expression of the reporter is ubiquitous and regulated by the hormone-receptor complex (11–13).
The promoter driving the reporter transcription is generally constituted by a sequence from the TK promoter ensuring a basal level of transcription and by a multimerized hormone responsive element (HRE): the exact location of the multimerized HRE and the number of its units is selected experimentally with the creation of a series of stably transfected cell lines where the expression of the reporter in the absence/presence of hormonal stimulation is evaluated (9, 11).
The reporter is selected among genes encoding for proteins with a short turn-over rate (to enable the dynamic view of the state of promoter activity) and easily detectable by non-invasive imaging technologies. So far, we have generated mainly reporter animals for bioluminescence employing as a reporter the fire-fly luciferase: this choice was driven by the short half life of the enzyme and by the relatively easy and cost efficient application of bioluminescence imaging (BLI) to small animals (14).
2.2. Imaging
Anesthetic solution composed of a water solution containing 78% v/v ketamine and 15% v/v xylazine.
Luciferine: 250 mg of Beetle luciferine potassium salt (Promega) are dissolved in 9.42 ml of bidistilled water then vortexed. The solution is kept in aliquots at − 20°C. Fresh aliquots are used for each imaging session.
CCD camera or Bioluminescence Imaging work station: several apparatus are available––Lumina (Caliper, Hopkinton Mass, USA), NightOwl (Berthold Technologies, Bad Wild-bad, Germany), Photon Imager (Biospace, Paris, France), and Carestream (Kodak, Rochester, NY,USA)
Imaging software: Each workstation is marketed with a dedicated imaging software to operate the machine and calculate photon emission.
Luminescence standards: Tritium-based light-emission sources (Glowell, Lux Biotechnology, Edinburgh, UK).
2.3. Luciferase Enzymatic Assay
Phosphate lysis buffer: 100 mM KPO4 lysis buffer, pH 7.8, 1 mM, dithiothreitol, 4 mM EGTA, 4 mM EDTA, and 0.7 mM phenylmethylsulfonylfluoride (PMSF).
Luciferase assay reagent solution: 10 mM luciferin, 1 M dithiothreitol, 200 mM ATP dissolved in 100 mM phosphate buffer, pH 7.0.
Luminometer: Single tube or microplate luminomiters available from a variety of suppliers such as Glomax from Promega (Madison Wi, USA) and Centro from Berthold.
3. Methods
In mice carrying as a reporter luciferase, the activity of the promoter may be evaluated: (a) directly in living animals by measuring photon emission resulting from luciferase enzymatic activity; (b) ex vivo in tissues dissected from the animal; (c) by measuring luciferase enzymatic activity in tissue extracts.
The possibility to measure photon emission by means of CCD cameras has the advantage that the effect of a given compound or physiological changes can be measured by observing a single animal over time. The disadvantage of this approach is that the equipment available at present time provides bi-dimensional analysis of photon emission and does not allow the investigator to acquire an unequivocal estimate of the exact origin of photon emission. Furthermore, it is well known that the different layers of tissue shield the photons, therefore impairing the measurements of luciferase activity from the inner most organs. Thus, the in vivo analysis must be complemented either by ex vivo imaging of the tissues immediately after isolation from the reporter animal or by the quantitative measurement of the enzymatic activity of luciferase accumulated in the tissues of interest.
3.1. Reporter Mice
A detailed description of the generation of a reporter mouse was previously described by Ciana et al. (11). The different steps can be summarized as follows:
Design a series of promoter sequences and clone them in a pMAR plasmid (11).
Amplify and sequence the plasmids generated.
Stably transfect each single reporter plasmid into at least two cell lines of different origin and determine experimentally the plasmid providing the best response to the given stimulus.
Inject the DNA of the selected plasmid into a fertilized mouse oocytes and reimplant them in a foster mother.
Screen the litter to identify the transgenic mice and proceed with the generation of separate lines of mice, each to be tested for the responsiveness to the selected stimulus/drug.
3.2. Imaging
3.2.1. In Vivo Imaging
In vivo imaging requires the use of specific CCD slow-scan cameras equipped with appropriate image processors and software for image reconstruction and localization of photon emission. For the bioluminescence detection:
Mice are anesthetized by s.c. injection of a 50 μl anesthetic solution or with isofluorane.
The substrate luciferine is administered to anesthetized mice (25 mg/kg i.p.) about 20 min before bioluminescence quantification.
For the imaging session, mice are placed in the light-tight chamber and a gray-scale photo is first taken with dimmed light, photon emission is then measured by integrating data over a period of time defined in the initial dose-and time-response study. With our models, we generally use a 5 min observation time.
To measure photon emission from the different body regions the gray-scale and pseudocolor images are merged using the software provided by the imaging workstation. Alternatively, open sources software are available (http://rsb.info.nih.gov/ij/) and can be effectively adopted.
Photon emission is calculated as counts per unit of time and area (cts/s/cm2) in specific regions of the mouse body using an electronic grid to identify reproducibly the different body areas: typically we measure photon emission in head, limbs, thymus, chest, abdomen, limb, and tail (Fig. 20.1). Alternatively, appropriate algorithms for image analysis can be employed under Imagej or Matlab environment.
Fig. 20.1.
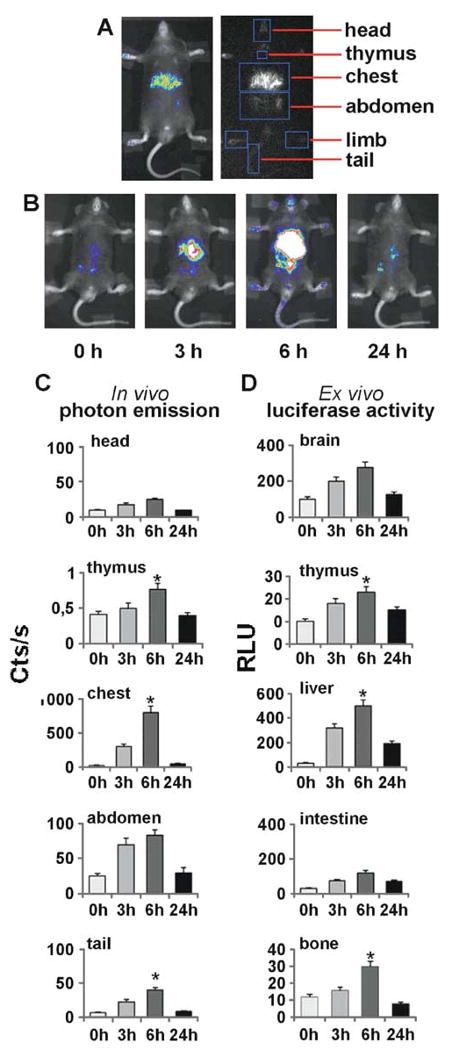
Application of the effect of bioluminescence for the study of the time-dependent activation of the estrogen receptor in adult male ERE-Luc mouse. Groups of 5 ERE-Luc male mice were injected i.p. with either vehicle of 17β-estradiol. BLI was carried out with a Night Owl imaging unit (Berthold Technologies) consisting of a Peltier-cooled charge-coupled device slow camera equipped with a 25-mm, f/0.95 lens. Images were generated by the Night Owl LB981 image processor and transferred via video cable to a peripheral component interconnected with a grabber using WinLight software (Berthold Technologies). For the imaging session, the animals were anestethized with a ketamine-xilazine solution as previously described (9). In parallel, ERE-Luc mice treated in the same way were euthanized at 3, 6, and 24 h after treatment the tissues extracted for the detection of luciferase enzymatic activity. Panel A: black and white photo merged to the pseudocolor image generated by the CCD camera and example of the electronic grid generated for the quantification of photon emission. Panel B: representative example of the imaging data collected. Panel C: comparative study of the quantitative analysis of luciferase production as done by in vivo imaging and by ex vivo enzymatic assay.
Preliminary experiments are needed aimed to ensure that the substrate luciferin reaches all tissues at saturating concentrations, these studies are carried out first injecting the mice with a high dose of luciferin (e.g., 150 mg/kg) and measuring photon emission at for 5 min sessions at 5, 10, 15, 20, 25, 30, 35, 40 min after substrate injection. Photon emission is calculated in head, limbs, thymus, chest, abdomen, limb, and tail. This experiment will enable the investigator to evaluate the time necessary for the substrate to reach all parts of the body (typically between 5 and 40 min). The time selected will be used for a second experiment aimed at establishing the dosage of luciferin necessary and sufficient to saturate the enzyme in all body regions. This second experiment will be done by injecting the animals with increasing concentrations of luciferin (typically, 8–80 mg/kg, i.p.) and exposing them to the CCD camera for a 5 min session at the time selected in the previous experiment (Fig. 20.2). The concentration of luciferin giving maximal response in all organs is then selected for future experiments.
Fig. 20.2.
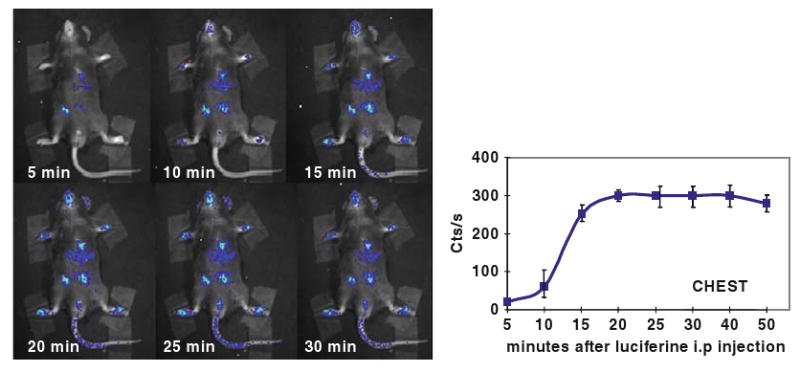
Time course of photon emission in chest of ERE-luc male mouse after luciferine injection. Male ERE-Luc mice were injected i.p. with 150 mg/kg aqueous solution of luciferin and photon emission was measured at 5–30 min intervals. By the 30th min luciferin has reached all body areas.
3.2.2. Ex Vivo Imaging
Ex vivo bioluminescence imaging assay is simply carried out by exposing the dissected organs to the CCD camera. To this aim, animals need to be injected with luciferin as before. Generally, once the imaging session ends, the tissue is rapidly frozen for the preparation of tissue extracts where luciferase enzymatic activity can be measured.
Ex vivo imaging is of particular interest for the study of luciferase activity in the central nervous system. In this case, due to the limited diffusion of luciferin through the blood brain barrier, the substrate is administered by intracerebroventricular (ICV) injection in anesthetized animals. The injection is done according to specific stereotaxic coordinates (Bregma, −0.25 mm; lateral, 1 mm; depth, 2.25 mm) and by the use of an Hamilton syringe rotated on the coronal plate of about 3° from the orthogonal position, as previously described (15). Mice are euthanized 20 min after the ICV injection of luciferin (75 μg/3 μl saline). Brains are rapidly dissected and sectioned by means of a “brain matrix” (Brain Matrix, Adult Mouse, coronal and sagittal, 1 mm spacing; Ted Pella, Redding, CA) and sections are immediately visualized by the CCD camera. Gray-scale images of the sections are first taken with dimmed light. Photon emission is measured in a 15-min exposure time. Pseudocolor images associated to photon emission are generated by the appropriate image processor and transferred via video cable to a PCI frame grabber. For co-localization of the bioluminescent photon emission, gray-scale and pseudo-color images are merged. Luminescence of the brain slices is expressed as the integration of photon emission per time unit (cts/s); to be able to compare the extent of photon emission in brain nuclei characterized by a different area, data are expressed as cts/s/mm2. Photon emission in selected brain areas is quantified by means of a grid generated with the aid of a brain atlas (Fig. 20.3).
Fig. 20.3.
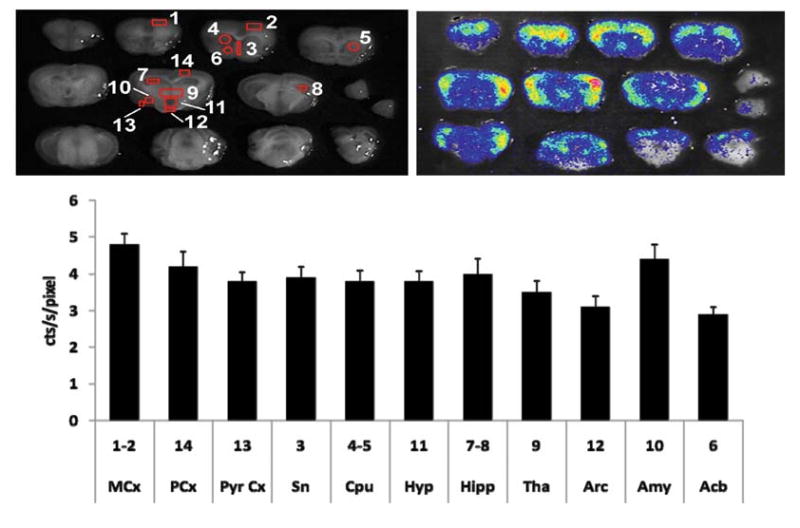
Ex vivo quantitative analysis of bioluminescence in the brain of ERE-Luc mice. Upper left panel. Black and white photo of brain slices with an indication of the areas used for the quantitative analysis of photon emission by CCD camera. Right panel: merge of the pseudocolor image. Animals were injected icv with luciferin and brains dissected and analyzed 20 min after treatment. Data are expressed as the integration of the average photon emission unit (cts/s) and represent the mean ± SEM (n = 6–10 mice per group). As indicated in the bottom panel, in the brain of untreated male brain luciferase accumulates differentially in the various brain regions (MCx: motor cortex; PCx parietal cortex; PyrCx: pyrophorm cortex; Sn: substantia nigra; Cpu: caudate putamen; Hyp: hypothalamus; Hipp: hippocampus; Tha: thalamus; Arc: arcuate nucleus; Amy: amygdale; Acb: accumbens).
3.3. Luciferase Enzymatic Assay
Freshly dissected tissues are immediately frozen and stored at −80°C for the biochemical assay.
Tissues (20–100 mg) or cells (∼100,000) are homogenized by TissueLyser using 300 μl of the phosphate lysis buffer and stainless steel beads in 1.2 ml polyethylene microtubes containing the tissue fragments or the cells.
Protein concentrations in the supernatants are measured using the Bradford assay using solutions and protocols commercially available.
The homogenates are frozen on dry ice and thawed in water, then are centrifuged (4900g for 30 min at 4°C).
Supernatant are collected and diluted to a protein concentration of 1 mg/ml.
20 μl of the supernatant is transferred to a white opaque 96-well plate for luminescence quantification by luminometer (Glomax, Promega). Typically, luminescence is measured in an integration time of 10 s, after automatically injecting 100 μl of luciferase assay reagent. Light measurements are recorded by the luminometer software.
Luminescence data, normalized over protein content of each sample, are finally expressed as relative light units (RLU) per μg of protein.
Acknowledgments
The work done in the laboratory is supported by grants from the European Community (STREP EWA LSHM-CT-2005-518245; NoE EMIL LSHC-CT-2004-503569; NoE DIMI LSHB-CT-2005-512146; IP CRESCENDO LSHM-CT-2005-018652) and by NIH (RO1AG027713).
Footnotes
To validate the faithfulness of the reporter of interest, it is advisable to evaluate its activity in parallel with the activity of endogenous genes. However, differences in the spatio-temporal accumulation of the reporter and the products of the endogenous genes may be expected due to the fact that all endogenous genes are under the control of complex promoters which may influence the overall transcription rate of the reporter differentially; in addition, the turnover rate of the endogenous gene may differ from the reporter: therefore a time-course experiment must be carried out.
A further step necessary to validate the activity of the reporter consists in immunocytochemical studies aimed at demonstrating that the molecules active on the reporter co-localize with the product of the reporter gene.
References
- 1.http://www.nursa.org/index.cfm
- 2.Yang X, Lamia KA, Evans RM. Nuclear receptors, metabolism, and the circadian clock. Cold Spring Harb Sym Quant Biol. 2007;72:387–94. doi: 10.1101/sqb.2007.72.058. [DOI] [PubMed] [Google Scholar]
- 3.Lonard DM, O'Malley BW. Nuclear receptor coregulators: judges, juries, and executioners of cellular regulation. Mol Cell. 2007;27:691–700. doi: 10.1016/j.molcel.2007.08.012. [DOI] [PubMed] [Google Scholar]
- 4.Nettles KW, Greene GL. Ligand control of coregulator recruitment to nuclear receptors. Ann Rev Physiol. 2005;67:309–33. doi: 10.1146/annurev.physiol.66.032802.154710. [DOI] [PubMed] [Google Scholar]
- 5.Katzenellenbogen JA, O'Malley BW, Katzenellenbogen BS. Tripartite steroid hormone receptor pharmacology: interaction with multiple effector sites as a basis for the cell- and promoter-specific action of these hormones. Mol Endocrinol. 1996;10:119–31. doi: 10.1210/mend.10.2.8825552. [DOI] [PubMed] [Google Scholar]
- 6.Maggi A, Ciana P. Reporter mice and drug discovery and development. Nat Rev Drug Discov. 2005;4:249–55. doi: 10.1038/nrd1661. [DOI] [PubMed] [Google Scholar]
- 7.Mussi P, Liao L, Park SE, Ciana P, Maggi A, Katzenellenbogen BS, Xu J, O'Malley BW. Haploinsufficiency of the corepressor of estrogen receptor activity (REA) enhances estrogen receptor function in the mammary gland. Proc Natl Acad Sci USA. 2006;103:16716–21. doi: 10.1073/pnas.0607768103. [DOI] [PMC free article] [PubMed] [Google Scholar]
- 8.Ciana P, Raviscioni M, Mussi P, Vegeto E, Que I, Parker MG, Lowik C, Maggi A. In vivo imaging of transcriptionally active estrogen receptors. Nat Med. 2003;9:82–6. doi: 10.1038/nm809. [DOI] [PubMed] [Google Scholar]
- 9.Ciana P, Biserni A, Tatangelo L, Tiveron C, Sciarroni AF, Ottobrini L, Maggi A. A novel peroxisome proliferator-activated receptor responsive element-luciferase reporter mouse reveals gender specificity of peroxisome proliferator-activated receptor activity in liver. Mol Endocrinol. 2007;21:388–400. doi: 10.1210/me.2006-0152. [DOI] [PubMed] [Google Scholar]
- 10.Di Lorenzo D, Villa R, Biasiotto G, Belloli S, Ruggeri G, Albertini A, Apostoli P, Raviscioni M, Ciana P, Maggi A. Isomer-specific activity of dichloro-dyphenyltrichloroethane with estrogen receptor in adult and suckling estrogen reporter mice. Endocrinology. 2002;143:4544–51. doi: 10.1210/en.2002-220448. [DOI] [PubMed] [Google Scholar]
- 11.Ciana P, Di Luccio G, Belcredito S, Pollio G, Vegeto E, Tatangelo L, Tiveron C, Maggi A. Engineering of a mouse for the in vivo profiling of estrogen receptor activity. Mol Endocrinol. 2001;15:1104–13. doi: 10.1210/mend.15.7.0658. [DOI] [PubMed] [Google Scholar]
- 12.Stief A, Winter DM, Strätling WH, Sippel AE. A nuclear DNA attachment element mediates elevated and position-independent gene activity. Nature. 1989;341:343–5. doi: 10.1038/341343a0. [DOI] [PubMed] [Google Scholar]
- 13.Chung JH, Whiteley M, Felsenfeld G. A 5′ element of the chicken beta-globin domain serves as an insulator in human erythroid cells and protects against position effect in Drosophila. Cell. 1993;13:505–14. doi: 10.1016/0092-8674(93)80052-g. [DOI] [PubMed] [Google Scholar]
- 14.Stell A, Belcredito S, Ramachandran B, Biserni A, Rando G, Ciana P, Maggi A. Multimodality imaging: novel pharmacological applications of reporter systems. Q J Nucl Med Mol Imag. 2007;51:127–38. [PubMed] [Google Scholar]
- 15.Vegeto E, Belcredito S, Etteri S, Ghisletti S, Brusadelli A, Meda C, Krust A, Dupont S, Ciana P, Chambon P, Maggi A. Estrogen receptor-alpha mediates the brain antiinflammatory activity of estradiol. Proc Natl Acad Sci USA. 2003;100:9614–9. doi: 10.1073/pnas.1531957100. [DOI] [PMC free article] [PubMed] [Google Scholar]