

Abstract
The intravoxel incoherent motion (IVIM) method was implemented in closed-chest dogs to obtain measurements on microcirculation in the left ventricular wall in vivo. Specifically, it enabled us to measure the mean microflow velocity (400 ± 40 μm/s) and the vascular volume fraction (VVF) (11.1% ± 2.2%), and observe the directional preference of capillary orientation. The apparent diffusion coefficients (ADCs) of water along and perpendicular to myofibers were also measured. With vasodilatation by adenosine infusion, a 25% increase in the VVF and a 7% increase in the mean microflow velocity were observed, while no change in the ADC was detected. A 28.5% decrease of the ADC was observed postmortem.
Keywords: morphology, anisotropy, perfusion, MRI, capillaries
Microcirculation in tissue has generated great interest in recent years (1–3) for clinical purposes and in studies of oxygen delivery. Magnetic resonance imaging (MRI) is one of the few noninvasive methods that are being used to investigate this topic. MRI techniques employ either exogenous contrast agents or endogenous contrast mechanisms to delineate blood flow at the capillary level. Gd-DTPA-based studies give estimates of perfusion rates (4), while strictly intravascular agents provide estimates of perfusion rates, vascular volume, and water exchange rates (4,5). Two endogenous contrast methods—remote arterial spin-labeling and local spin-labeling—are used to measure perfusion rates, water distribution between vascular and extravascular compartments, and flow transit times (6–8).
We used an endogenous contrast technique based on the intravoxel incoherent motion (IVIM) phenomenon (9,10) to measure the vascular volume fraction (VVF) and microflow velocity, and to detect directional anisotropy in the capillary morphology in the myocardium. The IVIM technique is based on the assumption that in diffusion-weighted images, blood flow in the capillaries and small arterioles/venules also appears as incoherent movement when observed at the scale of an image pixel, and causes a decrease in the image intensity in addition to the effect of Brownian diffusion of the water molecules. Because both flow and diffusion measurements can be obtained with this technique, we also investigated the correlation between the two by increasing blood flow with adenosine infusion.
We conducted for the first time IVIM-based microcirculation measurements in the canine heart in vivo. This technique has been used successfully in vascular brain perfusion studies (11–13) and renal perfusion imaging (14,15), but IVIM-based flow detection has not been attempted in the heart—mainly because of the technical difficulties caused by heartbeat motion. Diffusion-weighted sequences are critically affected by bulk deformation and rotation, and therefore they require careful registration of the heart position and strain status. Nevertheless, the IVIM method is a useful tool for examining the relationship between vascular anatomy and flow distribution in the myocardium (16), and between microcirculation and diffusion (17).
The directional preference of capillary orientation in the myocardium has been observed in many optical and CT microscopy studies (18–20). To our knowledge, the present study is the first to describe the anisotropy of capillary morphology in vivo. The IVIM method differentiates between the water molecules undergoing flow and the static molecules by assuming that flow drives significantly greater displacements than diffusion. In practice, the motion-sensitizing (encoding) gradient is applied in a particular direction, and only water movement in that direction results in signal attenuation. The broader the velocity spread in that direction, the higher the attenuation. Therefore, if the capillary flow velocity is on average higher in a particular direction, the anisotropy will be visible with IVIM. Additionally, if a significant fraction of the papillary segments are perpendicular to the encoding gradient, flow in these segments will not cause any signal attenuation beyond the diffusion effect, and water in these segments will be regarded by the IVIM method as part of the static pool undergoing diffusion only, and thus will not be visible in the observed vascular fraction. It is a feature of the IVIM method that the visible VVF is dependent on the gradient direction, and the measured flow velocity is the mean flow velocity of the visible fraction. This phenomenon is strongly present in the myocardium, as described below.
THEORY
IVIM Basis
The IVIM method, which is based on the use of diffusion sensitizing gradients, was developed by Le Bihan et al. (9) to detect the motion of water within biological tissue containing flowing blood, and to differentiate between the diffusion and perfusion contributions.
The present IVIM study was based on the following assumption: an image voxel of 33 μl of tissue contains approximately 1.2 × 10⁶ capillary segments. Given this large number, it is reasonable to assume that the water molecules in the capillary network moved in many different directions at a distribution of speeds. Therefore, microcirculation can be viewed at the voxel scale as a collection of random movements that can be modeled as a pseudo-diffusion process (distributed and incoherent). With a motion-sensitive MRI sequence, such random motion can be amplified as a phase incoherence of the spins that causes a drop in the image intensity. Since the movement driven by blood flow is several times higher than Brownian diffusion, the intensity attenuation contains two separate components: one fast component corresponding to the pseudo-random microcirculation, and one slower component corresponding to the Brownian diffusion. Both forms of movement can then be quantified in all of the three spatial directions. From these measurements, we can derive the visible VVF and the mean flow velocity, and also observe directional anisotropy in flow and diffusion.
By selecting the direction of the encoding gradient, we were able to study the flow and diffusion movements parallel and perpendicular to the myofiber orientation.
MATERIALS AND METHODS
Animal Preparation, Monitoring, and Control
For the in vivo studies, 10 beagles (10–12 kg) were initially given an intramuscular dose of acepromazine (0.1 mg/kg) and an intravenous dose of thiopental (2.27 ml/kg). Anesthesia was induced intravenously with sodium pentothal (13 mg/kg). Then a cephalic vein, a jugular vein, and a femoral artery were catheterized for blood gas sampling, physiological monitoring, and drug administration. Body temperature was monitored and maintained with an air heater. The animals were intubated and ventilated at 12 breaths per minute in order to perform acquisitions during the static end-expiratory plateau without breath-holding for prolonged periods of time. Anesthesia was maintained by isoflurane (1–1.5%). A cardiac pacing lead was inserted through the jugular vein into the right atrium to pace and maintain a constant heart rate. The pacing rate (PR) was chosen to be 10–15% above the natural rate, and was synchronized to the ventilation rate to maintain a fixed number of beats within one respiratory cycle. Cardiac pacing and ventilation were electronically synchronized (Fig. 1).
FIG. 1.

Cardiac pacing and ventilation synchronization. The ventilator signal output is used as a trigger. The duration of the cardiac cycle (Δ) is adjusted to be an integer (n) fraction of the ventilation period T. Encoding and rewinding gradient pulses of the STEAM sequence are placed at the exact same point of the cardiac cycle. Acquisition is performed during the end expiration plateau.
To further remove the influence of cardiac motion, we used a stimulated echo acquisition mode (STEAM) sequence to measure water movement between the same end-diastolic point of two consecutive heartbeats, when the position and shape of the heart were the same. The residual misregistration was quantified, and the resulting errors were estimated to be negligible (see MRI Method section).
We investigated the dependence of the IVIM parameters on different perfusion conditions with a vasodilator (adenosine). Adenosine (140 μg/kg · min) was infused intravenously, resulting in a rapid fall in pressure and a rise in heart rate. Acquisitions were started when the pressure and heart rate had stabilized again, and adenosine was infused throughout.
Gd-DTPA (0.2 mmol/kg) experiments were additionally conducted in four dogs in order to follow perfusion changes induced by the adenosine injection. We performed first-pass contrast-enhanced imaging before and during adenosine infusion, and compared the initial slope of the signal enhancement during contrast wash-in.
As a control condition for the IVIM technique, postmortem scans were performed immediately after euthanasia, and were expected to show no blood flow. These scans were finished within 60 min of death. Body temperature was maintained during these scans.
MRI Method
Theory
In a STEAM sequence (Fig. 2), the signal amplitude attenuation curve (S), which arises from the application of the motion sensitizing gradient G, can be represented by a biexponential curve associated to a bicompartmental model (11):
| [1] |
where b, the diffusion weighting (s/mm2), is equal to [(γGδ)2 (Δ—δ/3)]; δ is the duration of the gradient pulse; and Δ is the time between the encoding and rewinding pulses (mixing period in STEAM). S0 is the signal amplitude for b = 0; C is the tissue water content (~81%, calculated from the wet weight-to-dry weight ratio found equal to 4.62 (21)); D is the molecular diffusion coefficient of water (mm2/s); D* is a pseudo-diffusion coefficient or flow velocity index (mm2/s); and f is the visible VVF.
FIG. 2.

A schematic of the sequence: a STEAM preparation, including a motion-encoding gradient Gd (d = x, y, or z and |G| ranging from 0 to 12.6 π/mm) and a segmented EPI readout.
The f and D* parameters do not describe perfusion in the sense of the delivery of arterial blood to a specific tissue volume (22), but rather in terms of the net amount of water movement, including both the arterial and venous sides (17).
NMR Parameters
NMR studies were performed on a 1.5 Tesla clinical scanner (Sonata; Siemens, Erlangen, Germany) using a quadrature volume coil. To minimize bulk motion effects, microcirculation measurements were made with a diffusion-weighted STEAM sequence. Figure 2 shows a short representation of the sequence. The readout was performed with a four-shot, segmented, echo-planar imaging (EPI) sequence. The motion-sensitizing gradients were applied in the three orthogonal directions (x, y, z) separately so as to detect any directional anisotropy of blood flow. The z direction was always parallel to the long axis of the left ventricle (LV), and x, y in the short-axis plane. The data for the three directions were collected separately in three scans, so there was no interference among them, and the results were independent of the order in which they were collected. We applied 14 diffusion weightings (b-value) for each direction (x, y, and z), ranging from 0 to 600 s/mm2 (see Eq. [1]). The 14 values permitted the collection of sufficient points for the biexponential fit.
For low b-values, the stimulated echo is mixed with residual stimulated anti-echo and free induction decay (FID) components (23). To isolate the stimulated echo, a phase cycling scheme (0°, 120°, and 240°) of the first 90° pulse of the STEAM sequence (Fig. 2) was implemented. Furthermore, an inversion pulse was applied during the mixing period to further suppress the FID component.
For the Gd-DTPA first-pass perfusion measurements, a slice-selective inversion-recovery sequence with a fast imaging with steady precession (FISP) readout (26) was used.
The imaging parameters for the STEAM sequence were: FOV = 185 × 370 mm2, acquisition matrix = 64 × 256, reconstruction matrix = 128 × 256, TE = 43 ms, TR = 5 s, and slice thickness = 8 mm. For the Gd-DTPA experiments the parameters were: FOV = 3002 mm2, matrix = 128 × 128, TE = 1.2 ms, TI = 110 ms, and one image per heartbeat. Mid-LV transverse slices were acquired for both measurements. The mixing period Δ was chosen to be equal to the pacing period for both the in vivo and postmortem studies.
Quantification of Bulk Motion Effects
To assess the amount of signal attenuation caused by bulk motion and deformation in vivo, we acquired long-axis STEAM images and measured the residual phase ramp across a short-axis slice, which was used in the IVIM scans. The phase value was first measured in each point along a line drawn along the septum in the long-axis image. Then the slope of phase variation, k(b), along this line was obtained using a linear fit. This calculation was repeated for the 14 b-values. Finally, the attenuation coefficient A(b) of the signal of a short-axis slice (thickness d) was calculated according to (24):
| [2] |
In order to calculate the effect on the IVIM parameters, the attenuated signal A(b) × S(b) was fed into the biexponential fit to generate a new set of f, D, and D* values. These are compared with the original values to determine their errors.
The acquired long-axis phase maps showed that the maximal attenuation coefficient A across an 8-mm short-axis slice was equal to 1.5% for the largest b-value of 570 s/mm2. This corresponded to a 0.3% residual deformation or 0.2° rotation of the slice. The consequent errors in the diffusion and flow parameters were estimated to be ΔD/D < 4%, Δf/f < 0.2%, and ΔD*/D* < 0.05%. They are negligible when compared to the precision of the measurements.
Postprocessing
In the IVIM experiment, the image intensity was sensitized to movement in each of the three orthogonal directions separately, in order to detect any anisotropy of the IVIM parameters. Correspondingly, the parameters f, D, and D* were estimated for water movement in the three orthogonal Cartesian directions. However, the anatomically relevant directions are the circumferential (labeled circ), radial (rad), and longitudinal (long) directions (Fig. 3). For this reason we grouped the results from the three Cartesian directions in all regions of interest (ROIs) into three categories, in which the encoding direction is parallel to each of the three anatomical directions. Given the image resolution and the fact that they were acquired at end-diastole, when the wall thickness was at minimum, we measured these parameters only in the mid-wall layer in order to minimize partial volume effects from the ventricular blood and the pericardium. This process resulted in three groups of parameters (Pcirc, Prad, and Plong) for each dog. These results were then averaged for the complete set of dogs. The standard deviations (SDs) reflect interanimal variability.
FIG. 3.
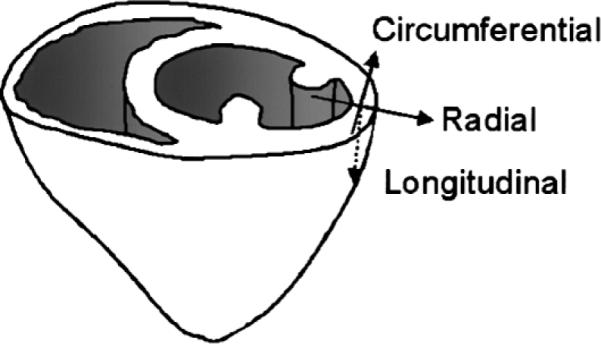
Illustration of a short-axis slice and the circumferential (circ), radial (rad), and longitudinal (long) directions.
The biexponential expression of the signal given in Eq. [1] was used as a model to determine D, f, and D*. Because D* was expected to be much larger than D (11), a linear fit applied to the last points (b > 200 s/mm2) of the logarithm of the signal-decay curve gave the diffusion constant D. The D value was then used in Eq. [1] to find the vascular parameters fmeas and D*.
For our experiments, the mixing period Δ was chosen to be equal to the pacing period. The measured fmeas parameter must therefore be corrected for the T1 relaxation that may occur during this period. This correction is complicated by exchanges between vascular and tissue spaces. Our treatment of the data assumes no exchange (the effect of the exchange is examined in the Discussion section).
Assuming the two-compartment model (an intravascular space associated to a relaxation time T1i and a normalized population of Ni spins, and an extravascular space with a relaxation time T1e and a population of Ne = (1−Ni) spins), the signal can be rewritten as follows:
| [3] |
Using a T1 value of 1300 ms for the blood and 1180 ms for the myocardial tissue (25), Ni and Ne were obtained from fmeas and used to get the corrected vascular fraction value f.
D* was obtained from a fit applied on the data corresponding to the low b-values (1.5 < b < 100 s/mm2), using the previously determined D and f parameters and Eq. [1]. The first point of the dataset (b = 0) was excluded when D* and f were estimated. This is because we found empirically that the signal drop from b = 0 to b = 1.5 s/mm2 was several times faster than the biexponential fit allows. This is likely due to the contribution of larger vessels (velocity > 3 mm/s), which did not fulfill the assumption of the pseudo-diffusion motion.
All data are expressed as mean ± SD. A t-test and a paired t-test were used for statistical comparison, as described in Results. A P-value of < 0.05 was considered to indicate a significant difference.
RESULTS
A typical set of STEAM images from a dog in vivo are shown in Fig. 4. The images displayed on the bottom of the figure represent the evolution of the signal magnitude with increasing diffusion weighting, whereas the images displayed on the top correspond to the phase evolution. Phase maps were processed and monitored to ensure that the residual bulk strain and rotation differences between the encoding and rewinding time points would not introduce significant signal drop, as detailed in the MRI Method section.
FIG. 4.

Evolution of the phase (top) and magnitude (bottom) of the STEAM images of the heart, under the 14 diffusion weightings.
In Vivo Results
Figure 5 illustrates the logarithm of the normalized signal (S/S0) vs. the diffusion weighting b (Eq. [1]), for a 330-μl (2 × 20 × 8 mm3) region located in the anterior mid-wall of the LV. The parameters f, D*, and D, which are respectively the visible vascular volume, the flow velocity index, and the apparent diffusion coefficient (ADC), are calculated by fitting the signal evolution with Eq. [1].
FIG. 5.
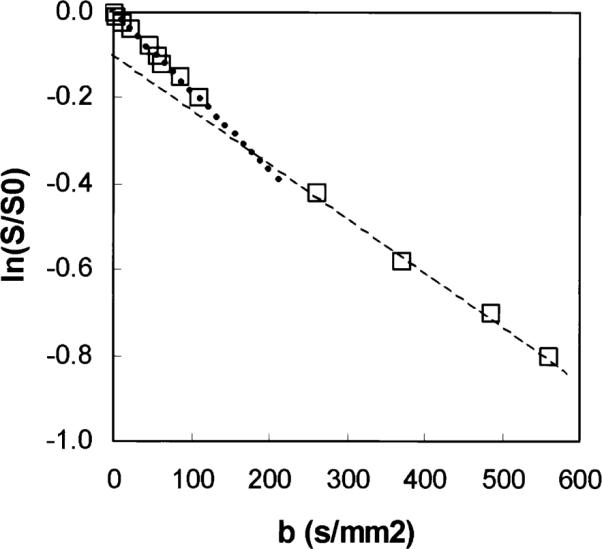
Normalized signal plotted as a function of diffusion weighting b for an ROI located in the anterior part of the myocardium, in log-linear scale. The open squares are the experimental data, and the dotted lines are the monoexponential fits for the lower (slope = Dfast) and higher (slope = D) b-values, respectively.
Because the visible vascular volume is a small fraction of the total tissue volume, the signal-to-noise ratio (SNR) of the IVIM effect was not sufficient for f and D* estimates of each pixel. Instead, we picked pixels in the mid-wall layer and averaged over 90° arcs (Fig. 6). In comparison, the diffusion effect comes from all tissue water, so the ADCs could be measured with higher spatial resolution (Fig. 7).
FIG. 6.

Mid-wall f parameters (four ROIs) superimposed on anatomical images of the same slice, with the three different encoding directions: x (a), y (b), and z (c), for one particular dog. The scale ranges from dark blue (0%) to red (25%).
FIG. 7.

Typical maps of the ADC in a single slice with the three different encoding directions: x (a), y (b), and z (c). The scale ranges from dark blue (0) to red (5 · 10−3 mm2/s).
The values of the parameters (f, D*, and D) for the different directions (circ, rad, and long) and different physiological states (rest, adenosine, and postmortem) are summarized in Table 1. Average values over the three directions are also calculated.
Table 1.
Summary of the f, D* and D values Obtained at Rest With Adenosine Infusion and Post Mortem, for Motion Encoding in the Circumferential (circ), Radial (rad), and Longitudinal (long) directions*
|
D(10−3 mm2/s) |
f(%) |
D*(10−3 mm2/s) |
|||||||
|---|---|---|---|---|---|---|---|---|---|
| Circ | Rad | Long | Circ | Rad | Long | Circ | Rad | Long | |
| Rest | |||||||||
| Mean | 1.64 | 0.99 | 1.17 | 11.14 | 8.25 | 5.35 | 13.35 | 11.16 | 14.09 |
| Std | 0.18 | 0.14 | 0.18 | 2.20 | 2.58 | 1.71 | 4.93 | 5.48 | 2.18 |
| Average | 1.26 ± 0.10 | 8.24 ± 1.27 | 12.87 ± 2.56 | ||||||
|
| |||||||||
| Adenosine | |||||||||
| Mean | 1.64 | 1.10 | 1.00 | 13.72 | 10.39 | 6.80 | 15.93 | 12.70 | 15.74 |
| Std | 0.15 | 0.11 | 0.13 | 2.34 | 3.48 | 1.91 | 5.54 | 2.81 | 2.79 |
| Average | 1.25 ± 0.08 | 10.31 ± 1.54 | 14.79 ± 2.27 | ||||||
|
| |||||||||
| PM | |||||||||
| Mean | 1.14 | 0.74 | 0.81 | 0.73 | 0.75 | 1.09 | - | - | - |
| Std | 0.08 | 0.08 | 0.07 | 1.02 | 1.56 | 0.64 | - | - | - |
| Average | 0.90 ± 0.04 | 0.86 ± 0.65 | - | ||||||
The visible vascular fraction f was statistically different for the three directions both at rest and with adenosine infusion. The flow velocity index D* was not statistically different among the three directions. The ADC value was the highest in the circumferential direction under all three physiologic conditions. Upon adenosine infusion there was a statistically significant increase of 25% in f in all three directions, with no discernable differences among them. The value D* also increased by 15% in all three directions.
Rest Condition
Directional anisotropy of the ADC and the visible VVF f are evident. In the mid-wall, where the measurements were made, f obtained with circumferential encoding was the highest, and f obtained with longitudinal encoding was the lowest. Specifically, fcirc is 35% higher than frad (P = 0.029), and 110% higher than flong (P = 0.022). The ADC was also the highest for the circumferential direction, which is the predominant myofiber orientation. The ADC has the order circ > long > rad (Dcirc > Dlong (P = 0.0001), Dlong > Drad (P = 0.037)). For the flow velocity index D*, no statistically significant preferential direction was detected (P > 0.2).
Effect of Adenosine on Perfusion
The effect of the adenosine infusion on perfusion was evaluated with Gd-DTPA first-pass contrast imaging. The initial slope of the signal enhancement following Gd injection (wash-in curve) was used as a relative measure of the contrast deposition rate during the first pass. On average, the initial slope increased by 120% ± 80% between the rest basal condition and during adenosine infusion. This was accompanied by a mean drop of 17.5 mm Hg of systolic pressure and 14 mm Hg of diastolic pressure.
Effect of Adenosine on the Vascular Parameters
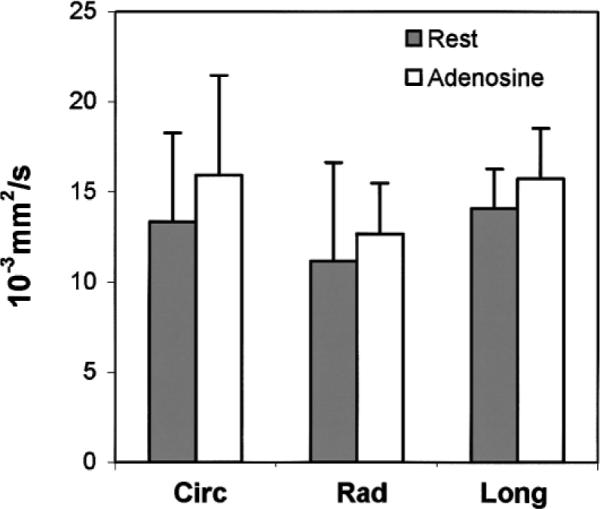
The graph presented in Fig. 8 summarizes the results obtained for the ADC at rest, with adenosine, and postmortem (detailed below), according to the encoding direction. Figures 9 and 10 respectively summarize the results obtained for the visible VVF f and the flow velocity index D* at rest and with adenosine.
FIG. 8.
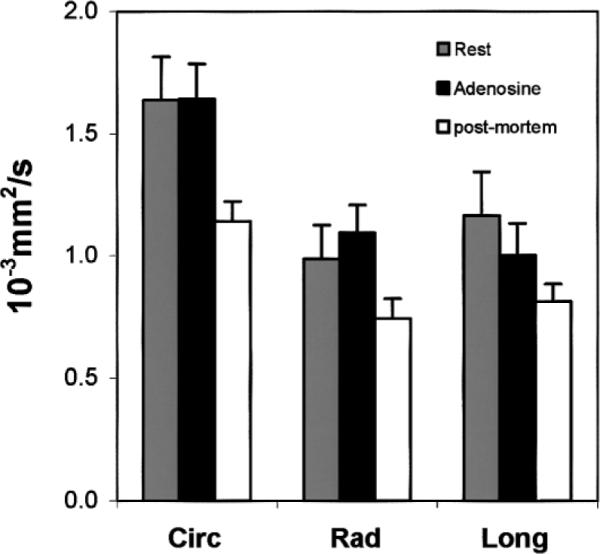
Mean ADC in the different directions in the mid-wall layer (circ, rad, and long). Experiments were conducted postmortem (open), at rest (light gray), and with adenosine injection (dark gray). In all three conditions, ADCcirc was statistically different from ADCrad and ADClong, while the latter two were not statistically different from each other. ADC values between rest and adenosine were not statistically different, while the difference between postmortem and in vivo was statistically significant in all three directions.
FIG. 9.
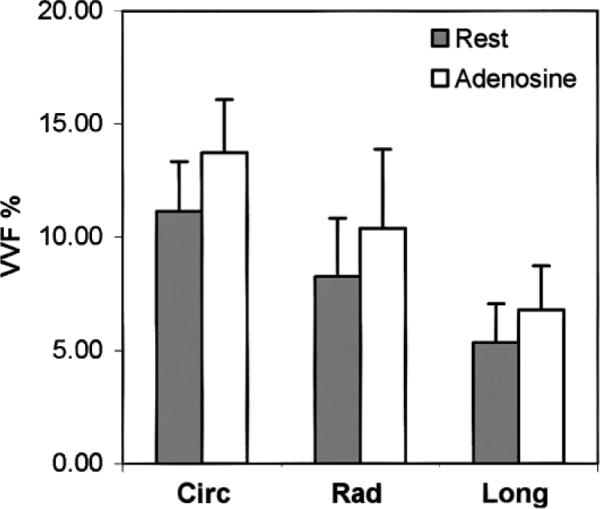
Mean visible VVF f in the different directions (circ, rad, and long). Experiments were conducted at rest (gray) and with adenosine injection (open). The directional anisotropy of f is statistically significant under both conditions, and f increased by approximately 25% in all directions with adenosine.
FIG. 10.
Mean flow velocity index D* in different directions (circ, rad, and long). Experiments were conducted at rest (gray) and with adenosine injection (open). No statistically significant directional anisotropy was observed, and D* increased by approximately 15% in all directions with adenosine.
The VVF increased by approximately 25% in all three directions upon adenosine infusion (23.2% circumferential, 25.9% radial, and 27.1% longitudinal), with no statistically significant difference among the three directions. Due to interanimal variability, when the three directions were analyzed independently, only the increase in the circumferential direction was statistically significant by itself. The average increase over the three directions was statistically significant (paired t-test, P = 0.032). The directional anisotropy of the VVF was preserved.
The increase in the flow velocity index in the three directions was 19.3% circumferential, 13.8% radial, and 11.7% longitudinal. Again, the differences among these values were not statistically significant. None of the increases in the three directions was statistically significant by itself, due to interanimal variability. The average increase over the three directions was 15%, and this was statistically significant (paired t-test, P = 0.028).
Adenosine infusion led to no significant change of the ADC (change < 1%, P = 0.823). According to Le Bihan and Turner (17), the product fD* is an indicator of net blood flow in a voxel. We observed an average increase of 44% (1.44 ± 0.03) in the product for the three directions.
Postmortem Results
The visible VVF f was found to be near zero (0.86% ± 0.65%), as expected. The ADC preserved the same directional anisotropy when compared to the in vivo case. However, postmortem ADC values were considerably lower than the in vivo values (−28.5% on average, P < 0.001).
DISCUSSION
A protocol with bulk-motion cancellation was implemented in order to observe microcirculation at the capillary level in the myocardium using the IVIM effect. Three parameters—f (VVF), D* (flow velocity index), and D (ADC)—were separately determined.
Interpretation of the Results
Visible VVF
The first parameter the IVIM method was able to extract was the visible VVF. The IVIM effect cannot distinguish capillaries from small branches (N = 6); however, a total visible vascular volume can be calculated. The highest visible vascular volume was observed with motion encoding in the circumferential direction. The value was 11.1% ± 2.2%, which agreed with recent literature values (27). Moreover, an increase of 25% during adenosine infusion (13.7% ± 2.3%) was observed, which showed the increase in small arteriolar and capillary volume due to arteriolar vasodilatation.
Directional anisotropy was observed in the mid-wall myocardium, fcirc > frad > flong. This is in agreement with the organization of capillaries and high-order branches in the myocardium: the capillaries are preferentially aligned with the myofibers, and the small vessels mainly spread in the short-axis plane (19,20). A detailed discussion is presented below.
Microflow Velocity
The IVIM effect enabled us to measure the flow velocity index D*. This coefficient measures the flow-driven displacement of water molecules (17,22). We found a mean value of [12.87 ± 2.56] · 10−3 mm2/s for D*. Assuming a Gaussian distribution of displacement (i.e., the same as molecular diffusion), the mean distance moved due to flow is then λ* = (6D*Δ)1/2. With a Δ of 480 ms, λ* was calculated to be 193 μm, leading to a mean microflow velocity of 400 ± 40 μm/s. This value reflects the average of the velocities of the capillaries and the small vessels, and is in agreement with the mean average velocity in the capillaries as determined previously (300 μm/s) (28).
Finally, no significant directional anisotropy was observed for D*, either at rest or with adenosine infusion. This is in contrast with the visible VVF f. This result is consistent with the capillary morphology of the myocardium. Capillary segments in the heart are made up of several groups (18), one of which is oriented along the myofibers. In diastole (during which the current images were acquired), these segments are stretched straight and parallel to each other (20). Other groups of capillary segments bridge the parallel segments (Fig. 11). When observed with the IVIM method, only water molecules that undergo large movement in the direction of the encoding gradient are distinguishable from the background diffusion, and only these molecules are included in the visible vascular volume. Consequently, the estimated mean flow velocity is also of this group of molecules.
FIG. 11.
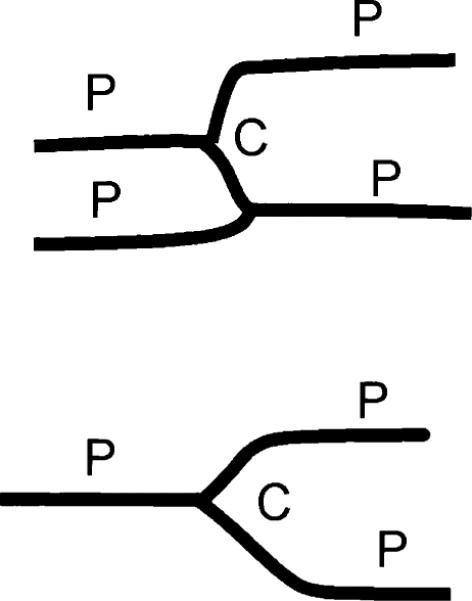
Capillary morphology in late diastole: a group of capillary segments are parallel to each other and to the myofiber orientation (P), while other segments cross-bridge the parallel group (C).
In the myocardium, when the encoding gradient is applied in the direction of the myofibers (circumferential for the mid-wall layer), water molecules in the parallel group of capillary segments contribute to signal decrease, as does the more randomly orientated cross-bridge group. Thus the visible VVF f includes both groups of segments, and the flow velocity index D* measures the mean velocity of the sum of the two groups. When the encoding gradient is perpendicular to the myofibers (radial or longitudinal for the mid-wall layer), the water molecules in the parallel group, being restricted to flow perpendicular to the gradient, are indistinguishable from the diffusion background. Therefore, this group is not included in the visible vascular volume, resulting in a lower estimate of f. What is still visible is the cross-bridge group, and the flow velocity index D* measures the mean velocity within this group. Because the velocity of flow in the cross-bridge group and the parallel group are similar, the D* parameter is less dependent on the encoding direction than the visible volume.
Given this explanation, the highest f value among the three directions is the best estimate of the actual VVF. This value is (11.1% ± 2.2)% at rest.
ADC and Flow
The ADC values were unchanged by adenosine infusion. The anisotropy of the ADC is in agreement with previous observations (29,30) performed in isolated perfused hearts and (31) in vivo, and corroborates the notion of preferential diffusion along the myofibers.
The in vivo average ADC value of 1.26 · 10−3 mm2/s lies in the range of values given in the literature (29,32–35). Interestingly, this value is 28.5% higher than the postmortem measurement (0.90 · 10−3 mm2/s). The likely cause is that postmortem physiological changes lead to a change in water mobility. It has already been shown that the diffusion coefficient of an ischemic myocardium decreases following a coronary occlusion (34), and that a decrease of the brain diffusion coefficient may be seen as one of the earliest signs of ischemia (36). Previous studies in the brain (37–39) have also shown that the ADC change is attributed to mobility changes of both extra- and intracellular water, in addition to possible water redistribution. Similar changes can be expected in the heart postmortem.
There are two technical factors that must be excluded as primary causes for the ADC change. The first one is that water movement from blood flow contributed to the diffusion measurement. From both theoretical estimation and experimental data, this is not likely to be the case. Theoretically, the mean diffusion distance during the mixing period is 60 μm. This value is much less than the mean flow distance obtained with D* (193 μm). Given these distances, and assuming the biexponential behavior of the signal, a simulation shows that the influence of flow on the measured diffusion constant is <0.6%. Nevertheless, one can argue that very slow-moving molecules in the vascular space may contribute to the diffusion estimates. However, with adenosine injection, for which flow and volume have been demonstrated to increase (according to both the Gd-DTPA wash-in data and the IVIM estimates), no changes were observed for the mean value of ADC. This result supports the notion that microcirculation did not contribute significantly to the diffusion constant change between in vivo and postmortem conditions.
The other technical factor is that by geometric considerations, the in vivo contractile motion of the myocardium during the mixing period effectively changes the encoding gradient strength, and thus may lead to higher ADC values than under postmortem conditions, as described by Reese et al. (31). However, the estimated increase of the diffusion tensor trace from this factor is <5%, which is small compared to the 28.5% observed difference.
Effect of Adenosine on Perfusion and the IVIM Measurements
The administration of adenosine caused a two- to threefold increase in perfusion according to the Gd-DTPA measurements, but only a 44% increase in the product of the VVF and the blood flow index fD*. The discrepancy between the increase of the IVIM parameters and the increase in coronary blood flow implies two possibilities, which are not mutually exclusive. In the first case, water exchange between intra- and extravascular compartments during the mixing period means that the extravascular compartment acts as a large sink that moderates the increase in the visible flow volume and flow speed in the capillary bed. In the second case, we note that vascular volume in the mid and endocardial layers have been observed to oscillate by 40–60% in a cardiac cycle due to pressure oscillations in the myocardium (20). Thus, a significant fraction of the observed flow may reflect blood being squeezed out and then filling back into the capillary bed during each cardiac cycle, like a sponge in water that is periodically squeezed. In fact, performing IVIM measurements with higher transmural resolution may be a way to further study the second phenomenon.
Validity of the IVIM Method in the Heart In Vivo
The validity of this study is based on the fulfillment of two requirements. The first requirement is the absence of signal attenuation due to bulk deformation and rotation. In STEAM imaging, residual bulk motion results in a phase ramp through the slice and signal attenuation. We quantified the phase variation through the slice to ensure that the resulting errors in the vascular parameters were negligible. Empirically, we found that significant phase variations could occur when the pacing rate was set at >15% above the natural rate.
In previous IVIM studies in the brain, the time between encoding and rewinding gradients was often <100 ms. We found that placing the two gradients within one cardiac cycle always resulted in significant motion misregistration, and a better solution was to apply the encoding and rewinding gradients at the same point in two consecutive heartbeats. Moreover, a long mixing time Δ provided an average of the pulsatile flow in the heart.
The second requirement is the absence of exchange between the intra- and extravascular compartments. The intra– extra capillary water proton exchange frequency has been evaluated to >7 s−1 (40), and more recently to 0.48 s−1 (27). Given the mixing period of our sequence, and the diversity of the exchange rate values in the literature, it is possible that the second requirement may not have been completely fulfilled, and the accuracy of the results may have been affected. Water exchange affects the results in two ways. The f value tends to increase as more water molecules participate in the capillary flow. However, the T1 and T2 in the intravascular space will be reduced, and therefore the f value may be underestimated. Ignoring the differences of T1 and T2 between the compartments, at the low capillary exchange rate of 0.48 s−1, 21% of the capillary water will be replaced by tissue water during the mixing period of 0.5 s, which results in an approximately 20% overestimation of the vascular volume by the IVIM method. At the high end of the exchange rate of 7 s−1, water residence time in the capillaries (140 ms) is much less than in the mixing period, meaning that capillary water is in fast exchange with tissue water. Under this condition the capillary space is indistinguishable from the extravascular space, and the IVIM method only measures the volume within arterioles and venules, where there is minimal exchange. The fact that our f value of 11.1% agrees with myocardial vascular volume estimates in the literature suggests that the latter is unlikely. The more likely case is that there is a certain degree of water exchange between the intra- and extravascular compartments during the mixing period, and its effect is somewhat compensated for by the T1 and T2 differences between the two compartments.
No T2 correction was performed, although the TE (43 ms) of our sequence is in the range of the myocardial and venous T2. An extended model (taking into account the exchange rate, and the T1 and T2 of each compartment) will have to be developed, but this was not the purpose of the present study.
CONCLUSIONS
We demonstrated that the IVIM method of MRI can be applied to study the myocardial microcirculation when the bulk motion coming from the respiration and heartbeat is nulled. This method offers a noninvasive way to estimate vascular volume, microflow velocity, and the directional anisotropy of the vascular parameters. This study also showed that the diffusion constant is not affected by an increase of blood flow.
Further work may include the detection of vascular volume anisotropy in the brain, where such a result has never been demonstrated. Another potential application may be the monitoring of blood vessel growth during angiogenesis in the heart, using anisotropy as an indicator of capillary organization.
ACKNOWLEDGMENTS
The authors gratefully acknowledge the help of Dr. Vinay Pai with pulse programming, and of Joni Taylor, Diana Lancaster, and Gina Orcino with preparation of the animals.
Footnotes
This article is a US Government work and, as such, is in the public domain in the United States of America.
REFERENCES
- 1.Decking UKM. Spatial heterogeneity in the heart—recent insights and open questions. News Physiol Sci. 2002;17:246–250. doi: 10.1152/nips.01393.2002. [DOI] [PubMed] [Google Scholar]
- 2.Umetani K, Yagi N, Suzuki Y, Ogasawara Y, Kajiya F, Matsumoto T, Tachibana H, Goto M, Yamashita T, Imai S, Kajihara Y. Observation and analysis of microcirculation using high-spatial-resolution image detectors and synchrotron radiation. Proc SPIE. 2000;3977:522–533. [Google Scholar]
- 3.Bauer WR, Hiller K-H, Galuppo P, Neubauer S, Kopke J, Haase A, Waller C, Ertl G. Fast high-resolution magnetic resonance imaging demonstrates fractality of myocardial perfusion in microscopic dimensions. Circ Res. 2001;88:340–346. doi: 10.1161/01.res.88.3.340. [DOI] [PubMed] [Google Scholar]
- 4.Wilke N, Jerösch-Herold M, Stillman AE, Kroll K, Tsekos N, Merkle H, Parrish T, Hu X, Wang Y, Bassingthwaighte J, Bache RJ, Ugurbil K. Concepts of myocardial perfusion imaging in magnetic resonance imaging. Magn Reson Q. 1994;10:249–286. [PubMed] [Google Scholar]
- 5.Kahler E, Waller C, Rommel E, Hiller KH, Voll S, Broich A, Hu K, Schnackerz KD, Bauer WR, Ertl G, Haase A. Quantitative regional blood volume studies in rat myocardium in vivo. Magn Reson Med. 1998;40:517–525. doi: 10.1002/mrm.1910400404. [DOI] [PubMed] [Google Scholar]
- 6.Waller C, Kahler E, Hiller KH, Hu K, Nahrendorf M, Voll S, Haase A, Ertl G, Bauer WR. Myocardial perfusion and intracapillary blood volume in rats at rest and with coronary dilatation: MR imaging in vivo with use of a spin-labeling technique. Radiol. 2000;215:189–197. doi: 10.1148/radiology.215.1.r00ap07189. [DOI] [PubMed] [Google Scholar]
- 7.Barbier E, Silva AC, Kim S-G, Koretsky AP. Perfusion imaging using dynamic arterial spin labeling (DASL) Magn Reson Med. 2001;45:1021–1029. doi: 10.1002/mrm.1136. [DOI] [PubMed] [Google Scholar]
- 8.Schwarzbauer C, Morrissey SP, Haase A. Quantitative magnetic resonance imaging of perfusion using magnetic labeling of water proton spins within the detection slice. Magn Reson Med. 1996;35:540–546. doi: 10.1002/mrm.1910350413. [DOI] [PubMed] [Google Scholar]
- 9.LeBihan D, Breton E, Lallemand D, Grenier P, Cabani E, Jeantet LM. MR imaging of intravoxel incoherent motions: application to diffusion and perfusion in neurologic disorders. Radiology. 1986;161:401–407. doi: 10.1148/radiology.161.2.3763909. [DOI] [PubMed] [Google Scholar]
- 10.Callaghan PT. Principles of nuclear magnetic resonance microscopy. Clarendon Press; Oxford: 1991. p. 430. [Google Scholar]
- 11.Le Bihan D, Breton E, Lallemand D, Aubin ML, Vignaud J, Laval-Jeantet M. Separation of diffusion and perfusion in intra voxel incoherent motion MR imaging. Radiology. 1988;168:497–505. doi: 10.1148/radiology.168.2.3393671. [DOI] [PubMed] [Google Scholar]
- 12.Henkelman RM, Neil JJ, Xiang Q-S. A quantitative interpretation of IVIM measurements of vascular perfusion in the rat brain. Magn Reson Med. 1994;32:464–469. doi: 10.1002/mrm.1910320407. [DOI] [PubMed] [Google Scholar]
- 13.Neil JJ, Bosch CS, Ackerman JH. An evaluation of the sensitivity of the intravoxel incoherent motion (IVIM) method of blood flow measurement to changes in cerebral blood flow. Magn Reson Med. 1994;32:60–65. doi: 10.1002/mrm.1910320109. [DOI] [PubMed] [Google Scholar]
- 14.Powers TA, Lorenz CH, Holburn GE, Price RR. Renal-artery stenosis—in vivo perfusion MR imaging. Radiology. 1991;178:543–548. doi: 10.1148/radiology.178.2.1987621. [DOI] [PubMed] [Google Scholar]
- 15.Muller MF, Prasad PV, Edelman RR. Can the IVIM model be used for renal perfusion imaging? Eur J Radiol. 1998;26:297–303. doi: 10.1016/s0720-048x(97)01161-3. [DOI] [PubMed] [Google Scholar]
- 16.Bassingthwaighte JB, Beard DA, Li Z. The mechanical and metabolic basis of myocardial blood flow heterogeneity. Basic Res Cardiol. 2001;96:582–594. doi: 10.1007/s003950170010. [DOI] [PMC free article] [PubMed] [Google Scholar]
- 17.Le Bihan D, Turner R. The capillary network, a link between IVIM and classical perfusion. Magn Reson Med. 1992;27:171–178. doi: 10.1002/mrm.1910270116. [DOI] [PubMed] [Google Scholar]
- 18.Kassab GS, Fung Y-CB. Topology and dimensions of pig coronary capillary network. Am J Physiol. 1994;267:H319–H325. doi: 10.1152/ajpheart.1994.267.1.H319. [DOI] [PubMed] [Google Scholar]
- 19.Brown RE. The pattern of the microcirculatory bed in the ventricular myocardium of domestic mammals. Am J Anat. 1965;116:355–374. doi: 10.1002/aja.1001160203. [DOI] [PubMed] [Google Scholar]
- 20.Toyota E, Fujimoto K, Ogasawara Y, Kajita T, Shigeto F, Matsumoto T, Goto M, Kajiya F. Dynamic changes in three-dimensional architecture and vascular volume of transmural coronary microvasculature between diastolic- and systolic-arrested rat hearts. Circ Res. 2002;105:621–626. doi: 10.1161/hc0502.102964. [DOI] [PubMed] [Google Scholar]
- 21.Mootha VK, Arai AE, Balaban RS. Maximum oxidative phosphorylation capacity of the mammalian heart. Am J Physiol. 1997;272:H769–H775. doi: 10.1152/ajpheart.1997.272.2.H769. [DOI] [PubMed] [Google Scholar]
- 22.Henkelman RM. Does IVIM measure classical perfusion? Magn Reson Med. 1990;16:470–475. doi: 10.1002/mrm.1910160313. [DOI] [PubMed] [Google Scholar]
- 23.Zhu JM, Smith IC. Stimulated anti-echo selection in spatially localized NMR spectroscopy. J Magn Reson. 1999;136:1–5. doi: 10.1006/jmre.1998.1621. [DOI] [PubMed] [Google Scholar]
- 24.Fisher SE, Stuber M, Scheidegger MB, Boesiger P. Limitations of stimulated echo acquisition mode (STEAM) techniques in cardiac applications. Magn Reson Med. 1995;34:80–91. doi: 10.1002/mrm.1910340113. [DOI] [PubMed] [Google Scholar]
- 25.Poncelet BP, Koelling TM, Schmidt CJ, Kwong KK, Reese TG, Ledden P, Kantor HL, Brady TJ, Weisskoff RM. Measurement of human myocardial perfusion by double-gated flow alternating inversion-recovery EPI. Magn Reson Med. 1999;41:510–519. doi: 10.1002/(sici)1522-2594(199903)41:3<510::aid-mrm13>3.0.co;2-g. [DOI] [PubMed] [Google Scholar]
- 26.Klocke FJ, Simonetti OP, Judd RM, Kim RJ, Harris KR, Hedjbeli S, Fieno DS, Miller S, Chen V, Parker MA. Limits of detection of regional differences in vasodilated flow in viable myocardium by first-pass magnetic resonance perfusion imaging. Circ Res. 2001;104:2412–2416. doi: 10.1161/hc4501.099306. [DOI] [PubMed] [Google Scholar]
- 27.Wacker CM, Wiesmann F, Bock M, Jakob P, Sandstede JJ, Lehning A, Ertl G, Shad LR, Haase A, Bauer WR. Determination of regional blood volume and intra-extracapillary water exchange in human myocardium using Feruglose: first clinical results in patients with coronary artery disease. Magn Reson Med. 2002;47:1013–1016. doi: 10.1002/mrm.10125. [DOI] [PubMed] [Google Scholar]
- 28.Jensen D. The principles of physiology. Appleton-Century-Crofts; New York: 1976. p. 644. [Google Scholar]
- 29.Garrido L, Wedeen VJ, Spencer U, Kantor H. Anisotropy of water diffusion in the myocardium of the rat. Circ Res. 1994;74:789–793. doi: 10.1161/01.res.74.5.789. [DOI] [PubMed] [Google Scholar]
- 30.Scollan DF, Holmes A, Winslow R, Forder J. Histological validation of myocardial microstructure obtained from diffusion tensor magnetic resonance imaging. Am J Physiol. 1998;275:H2308–H2318. doi: 10.1152/ajpheart.1998.275.6.H2308. [DOI] [PubMed] [Google Scholar]
- 31.Reese TG, Weisskoff RM, Smith RN, Rosen BR, Dinsmore RE, Wedeen VJ. Imaging myocardial fiber architecture in vivo with magnetic resonance. Magn Reson Med. 1995;34:786–791. doi: 10.1002/mrm.1910340603. [DOI] [PubMed] [Google Scholar]
- 32.Edelman RR, Gaa J, Wedeen VJ, Loh E, Hare JM, Prasad P, Li W. In vivo measurement of water diffusion in the human heart. Magn Reson Med. 1994;32:423–428. doi: 10.1002/mrm.1910320320. [DOI] [PubMed] [Google Scholar]
- 33.Hsu EW, Muzikant AL, Matulevicius SA, Penland RC, Henriquez CS. Magnetic resonance myocardial fiber-orientation mapping with direct histological correlation. Am J Physiol. 1998;274:H1627–H1634. doi: 10.1152/ajpheart.1998.274.5.H1627. [DOI] [PubMed] [Google Scholar]
- 34.Liess C, Radda GK, Clarke K. Metabolite and water apparent diffusion coefficients in the isolated rat heart: effects of ischemia. Magn Reson Med. 2000;44:208–214. doi: 10.1002/1522-2594(200008)44:2<208::aid-mrm7>3.0.co;2-i. [DOI] [PubMed] [Google Scholar]
- 35.Dou J, Reese TG, Tseng W-YI, Wedeen VJ. Cardiac diffusion MRI without motion effects. Magn Reson Med. 2002;48:105–114. doi: 10.1002/mrm.10188. [DOI] [PubMed] [Google Scholar]
- 36.Rother J, deCrespigny AJ, Darceuil H, Iwai K, Moseley ME. Recovery of apparent diffusion coefficient after ischemia-induced spreading depression relates to cerebral perfusion gradient. Stroke. 1996;27:980–986. doi: 10.1161/01.str.27.5.980. [DOI] [PubMed] [Google Scholar]
- 37.Sehy JV, Ackerman JJH, Neil JJ. Evidence that both fast and slow water ADC components arise from intracellular space. Magn Reson Med. 2002;48:765–770. doi: 10.1002/mrm.10301. [DOI] [PubMed] [Google Scholar]
- 38.Duong TQ, Ackerman JJH, Ying HS, Neil JJ. Evaluation of extra- and intracellular apparent diffusion in normal and globally ischemic rat brain via F-19 NMR. Magn Reson Med. 1998;40:1–13. doi: 10.1002/mrm.1910400102. [DOI] [PubMed] [Google Scholar]
- 39.Moore JR, Garrido L, Ackerman JL. Solid-state P-31 magnetic resonance imaging of bone-mineral. Magn Reson Med. 1995;33:293–299. doi: 10.1002/mrm.1910330303. [DOI] [PubMed] [Google Scholar]
- 40.Donahue KM, Burstein D, Manning WJ, Gray ML. Studies of Gd-DTPA relaxivity and proton exchange rates in tissue. Magn Reson Med. 1994;32:66–76. doi: 10.1002/mrm.1910320110. [DOI] [PubMed] [Google Scholar]