Abstract
The purpose of this study was to prospectively assess the effects of two adaptive postprocessing techniques on the evaluation of myocardial function with displacement-encoded magnetic resonance (MR) imaging, including sensitivity for abnormal wall motion, with two-dimensional echocardiography as the reference standard. Sixteen patients (11 men, five women; age range, 26–74 years) and 12 volunteers (six men, six women; age range, 29–53 years) underwent breath-hold MR imaging. Institutional review board approval and informed consent were obtained. Adaptive phase-unwrapping and spatial filtering techniques were compared with conventional phase-unwrapping and spatial filtering techniques. Use of the adaptive techniques led to a reduced rate of failure with the phase-unwrapping technique from 18.9% to 0.6% (P < .001), resulted in lower variability of segmental strain measurements among healthy volunteers (P < .001 to P = .02), and increased the sensitivity of quantitative detection of abnormal segments in patients from 82.5% to 87.7% (P = .034). The adaptive techniques improved the semiautomated postprocessing of displacement-encoded cardiac images and increased the sensitivity of detection of abnormal wall motion in patients.
Noninvasive imaging of myocardial function yields valuable information that can be used to diagnose and manage many forms of heart disease (1–4). Among clinical imaging modalities, magnetic resonance (MR) imaging is often considered the reference standard (5–10). There are two well-developed MR techniques that are used to measure intramyocardial motion: tagged imaging (11,12) and cine phase-contrast velocity imaging (13–15). Tagged imaging is well suited for tissue tracking (16,17); however, its spatial resolution is somewhat limited, as displacement vectors can only be measured for the tag lines. Cine phase-contrast imaging can be used to measure velocity at the spatial resolution of the anatomic images, but it lacks the inherent tissue-tracking capability of tagged imaging (18).
The displacement encoding with stimulated-echo (DENSE) technique (19–22) was developed in an attempt to combine the advantages of the previously mentioned methods. It directly provides the three-dimensional displacement vector of each pixel, the use of which has been validated against tagged imaging in phantom and clinical studies (23,24). The cine DENSE pulse sequences enable multiphase data to be collected in one breath hold (24,25). This increased imaging speed has yielded a corresponding increase in the volume of collected data and necessitated the development of rapid postprocessing techniques.
Advances in Knowledge.
-
■
With the adaptive phase-unwrapping technique, the rate of phase-unwrapping errors is reduced from 18.9% to 0.60% (P < .001) compared with the error rate for the conventional phase-unwrapping technique.
-
■
Adaptive spatial filtering reduced the noise of circumferential strain measurements (P < .001) and the variability of segmental strain curves (P < .001) in healthy volunteers.
-
■
In reference to two-dimensional echocardiography, use of adaptive techniques leads to increased sensitivity in the quantitative detection of abnormal segments in patients from 82.5% to 87.7% (P = .034) and does not change the specificity (P > .75).
Two key steps in the postprocessing of displacement-encoded images are phase unwrapping and noise suppression. Quality map–guided phase-unwrapping techniques have been developed for use with MR images (26–35). We found that a substantial number of failures occur when these techniques are applied to displacement-encoded data; therefore, we developed an adaptive phase-unwrapping (APU) technique to reduce the failure rate. The APU technique differs from existing approaches because it incorporates the location of the myocardial wall into the quality map. This is the same idea that underlies the implementation of the adaptive spatial filter (ASF) technique, which is used to reduce the myocardial strain noise that arises from noise on the displacement maps. Conventional fixed-kernel filters are susceptible to partial volume effects at the borders of the myocardial wall and tend to smooth variations that may exist across the wall. Use of an ASF technique that takes into account the local orientation of the myocardial wall (36) can help to avoid these issues.
The purpose of our study was to prospectively assess the effects of two adaptive postprocessing techniques on the evaluation of myocardial function with displacement-encoded MR imaging, including sensitivity for abnormal wall motion, with two-dimensional echocardiography as the reference standard.
Implication for Patient Care.
■ The adaptive techniques show promise for improving the quantitative assessment of myocardial wall motion in patients.
Materials and Methods
Imaging Protocol in Patients and Healthy Volunteers
Our study included 16 patients (11 men, five women; age range, 26–74 years) and 12 healthy volunteers (six men, six women; age range, 29–53 years). The volunteers were recruited as part of a Health Insurance Portability and Accountability Act (HIPAA)–compliant institutional review board–approved protocol for 1.5- and 3.0-T MR imaging, which included screening with a medical history questionnaire, physical examination, and chest radiography or MR imaging. Informed consent was obtained from all volunteers.
Between March 28 and October 30, 2006, 17 consecutive eligible patients who were already participating in one of three other institutional review board–approved HIPAA-compliant protocols gave consent to participate in our study. The first study was the Genetic Analysis of African American Hypertensives Protocol (n = 6). African American patients older than 21 years who were able to give informed consent and had a history of hypertension, a kinase allele (homo-or heterozygous) that affected the phosphorylation of a myosin regulatory light chain (37), and left ventricular ejection fraction less than 35% as determined with any quantitative imaging technique were included. Exclusion criteria were history of myocardial infarction, valve disease, rheumatic heart disease, or primary hypertrophic or infiltrative cardiomyopathy; chronic atrial arrhythmia or definite myocardial infarction on an electrocardiogram; inability to undergo metabolic stress testing or cardiac MR imaging; and poor echocardiographic windows that precluded accurate analysis.
The second protocol was the MR Imaging Assessment in Endoscopic Robotic Coronary Artery Bypass Graft Procedures Protocol (n = 9). Patients were included if they had documented one- or two-vessel coronary artery disease (proved with coronary angiography) with an ejection fraction of more than 50% and were referred for presurgical assessment. Patients were excluded if they were unable to undergo cardiac MR imaging or poor echocardiographic windows precluded accurate analysis.
The third protocol was the Early Functional Abnormalities in Type 2 Diabetic Patients Protocol (n = 2). Patients were included if they had type 2 diabetes mellitus without global left ventricular function abnormalities or history of cardiac disease or events (excluded with standard echocardiography). Exclusion criteria were the same as those in the second protocol.
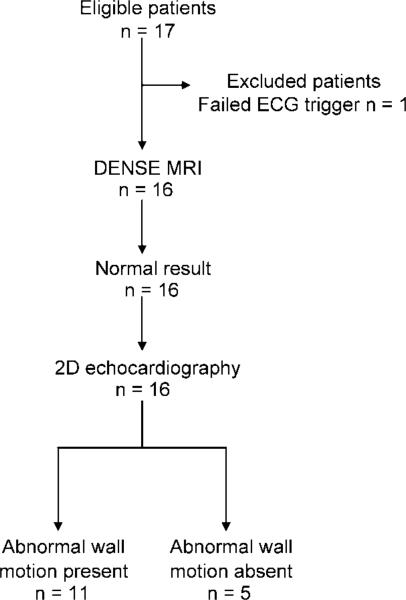
One of the 17 eligible patients (a 54-year-old man) did not undergo MR imaging because the electrocardiographic signal was insufficient to trigger the imager; thus, 16 patients remained in the study. All MR examinations were performed with a commercial 1.5-T clinical imager (Sonata or Avanto; Siemens, Erlangen, Germany) and the same protocol. Echocardiography and MR imaging were performed on the same day, without any treatment administered between examinations. Echocardiography revealed that seven patients had abnormal myocardial function and four had mildly abnormal myocardial function; thus, 11 patients had abnormal wall motion (Fig 1).
Figure 1.
Flow diagram shows patient inclusion and exclusion. Of the 17 consecutive eligible patients, one patient was excluded because electrocardiographic (ECG) signal was insufficient to trigger the imager. The remaining 16 patients underwent displacement-encoded cardiac MR imaging and two-dimensional (2D) echocardiography. Two-dimensional echocardiography revealed abnormal myocardial wall motion—including hypokinetic, dyskinetic, and akinetic segments—in 11 patients.
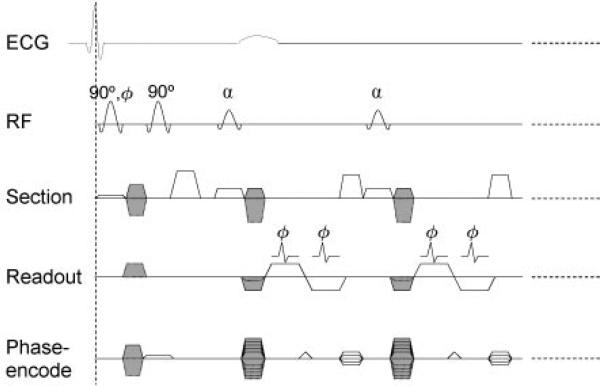
We used a two-dimensional cine DENSE pulse sequence with short-echo-train echo-planar imaging readout (Fig 2) to measure three-dimensional displacement vectors by acquiring four cine data sets in different encoding directions during a breath hold that spanned 18 heartbeats (24,38). The imaging parameters included 128 (readout) × 48 (phase encode) matrix, 512 × 192-mm or 384 × 144-mm field of view (field of view size depended on heart size), 7.0-mm section thickness, 1300 Hz/pixel receiver bandwidth, echo train length of six per radiofrequency excitation, 7.7-msec radiofrequency repetition time, 0.97-msec interecho spacing, displacement-encoding sensitivities of 0.63–0.84 radian per millimeter, and the average of two acquisitions was used to suppress noise. In each cardiac phase, 24 k-space lines were acquired in four radiofrequency excitations that lasted 31 msec. Between 17 and 20 cardiac phases were imaged.
Figure 2.
The pulse sequence of displacement-encoded cardiac MR imaging was triggered by the R wave of the electrocardiographic (ECG) signal. The position-encoding section included the first two 90° pulses and the encoding gradient pulses between them. Position-encoding and position-decoding gradient pulses are shaded in this diagram. Readout portion is a two-dimensional cine DENSE sequence with short-echo-train echo-planar imaging readout. It is used to measure three-dimensional displacement vectors by acquiring four cine data sets in different encoding directions. These are as follows: (a) Y, Z; (b) –Y, Z; (c) X, Z; and (d) X, –Z, where X, Y, and Z are the readout, phase-encode, and section directions, respectively. Decoding gradient in the phase-encode direction is merged with phase-encode gradient; this results in the three types of phase-encode gradient pulses shown. The echo train length is six per radiofrequency (RF) excitation (schematically shown as two), and in each cardiac phase, 24 k-space lines were acquired in four radiofrequency excitations that lasted 31 msec. This was repeated (dotted lines) for 17–20 cardiac phases, depending on the heart rate. The image matrix was 128 × 48, and two signals were acquired. A total of 16 heartbeats were needed for the complete data set.
There were several differences between the pulse sequence used in this study and the one used by Kim et al (24). We used a higher readout bandwidth to increase temporal resolution. Selective field-of-view excitation in the phase-encode direction by one of the encoding radiofrequency pulses reduced the number of k-space lines required (23). Four encoding directions were needed instead of three for the three-dimensional displacement vectors. The flip angle of the train of readout radiofrequency pulses in a heartbeat was increased to equalize the signal amplitudes of the cine frames (39). In each participant, images were obtained in three or four short-axis views, as well as in the horizontal (four-chamber) and vertical (two-chamber) long-axis views.
Postprocessing Outline
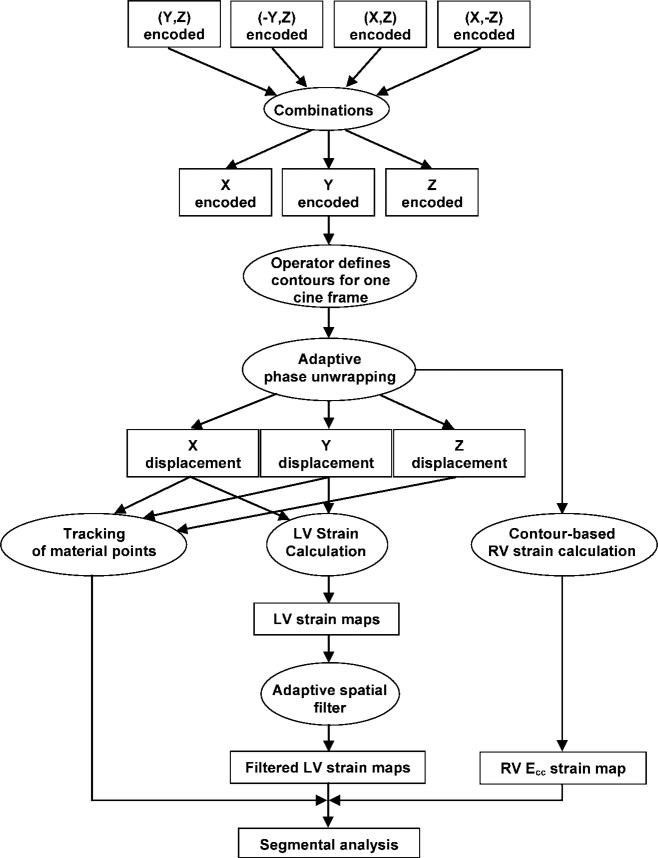
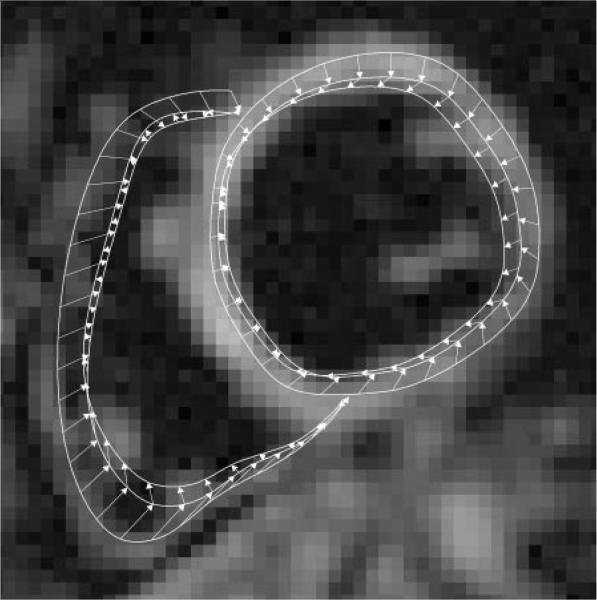
Initial multichannel complex images were combined into three cine sets encoded in the three Cartesian directions in a manner optimized for signal-to-noise ratio (Fig 3) (40). The operator (K.S.K. or K.A.M., neither of whom had prior experience in cardiac MR imaging) then manually defined the myocardial wall on the last cine frame by drawing the endo- and epicardial borders of the left ventricle and the midline contour of the right ventricular wall (Fig 4). All phase maps were unwrapped with the APU technique, converted to displacement vectors, and spatially filtered. In the next step of tissue tracking, myocardial pixels were followed over time with displacement vectors (41,42). Through this process, manual segmentation of the last cine frame was extended to the other frames. Circumferential strain (Ecc) and radial strain (Err) maps were calculated, and all further segmental analyses followed the American Heart Association 17-segment model (43).
Figure 3.
Outline of the postprocessing procedure. Ecc = circumferential strain, LV = left ventricle, RV = right ventricle.
Figure 4.
Three sets of left and right ventricular contours of the last (20th), 15th, and 13th cine frames are shown on the last cine frame of the midleft ventricle short-axis view. The contours of the intermediate frames have been omitted for clarity. The outermost contours are of the last frame and have been drawn manually. These are automatically updated for the other cine frames on the basis of the displacement vectors. Arrows indicate the sequence of contour generation. They point from contour positions in a later cine frametothoseinanearlierframeinthe reversetrackingprocess(Appendix E1,http://radiology.rsnajnls.org/cgi/content/full/246/1/229/DC1).
Because the right ventricular wall is frequently thinner than 2 pixels, only Ecc could be calculated for the right ventricle. This value was derived from the lengthening of the right ventricular contour.
Postprocessing was performed with a laptop computer and lasted 8 minutes for a complete data set. The software was compatible with the Windows operating system and can be downloaded at ftp://zeus.nhlbi.nih.gov.
Comparison of Adaptive and Conventional Phase-unwrapping Techniques
Description
The types of phase-unwrapping techniques suitable for MR imaging are termed region-growing techniques (35). These techniques begin from a seed point and surrounding initial region on the phase map. This region is incrementally expanded in space, time, or both, while the presence of phase fringes at its border is checked. When a fringe is encountered, the appropriate multiples of 2π are added to or subtracted from the border pixels to remove the fringe.
Quality maps are used to prioritize border pixels to determine the order in which they will be incorporated into the region. In the conventional phase-unwrapping technique, quality maps are functions of the phase gradient, signal level, or both, and preferentially guide the region growth along paths of smooth phase variation or high signal-to-noise ratio (26–28,32). The phase gradient is the phase difference between neighboring pixels after the removal of multiples of 2π. Frequently, the quality maps impose a threshold of maximum phase gradient.
In our proposed APU technique (Appendix E1, http://radiology.rsnajnls.org/cgi/content/full/246/1/229/DC1), region growth is preferentially guided along the myocardial wall. This is done by multiplying a conventional quality map by a weight function. The weight function is biased toward the midline contours of the myocardial wall. The operator draws the contour positions of the last cine frame. The positions are updated incrementally as each frame is unwrapped and its displacement vectors become available (Fig 4).
Statistical analysis
The failure rate of phase unwrapping in a participant's data for a specific phase-unwrapping technique and the threshold of maximum phase gradient is defined as the percentage of complete data sets that contain one or more incorrectly unwrapped cine frames. Two authors (K.S.K. and K.A.M.) performed conventional phase-unwrapping and APU techniques in the 16 patients and 12 volunteers for six threshold of maximum phase gradient values (0.7–1.2 radians). Values of less than 0.7 radian caused a high rate of pixel loss and were excluded. The same two authors then calculated failure rates for each participant, as well as for the threshold of maximum phase gradient and the unwrapping method. This resulted in 12 groups of rates (six threshold of maximum phase gradients times two techniques), each of which contained 28 values. Means and 95% confidence intervals were calculated for each group (44). Two-way analysis of variance was performed with statistical software (SPSS for Windows, version 11.0.1; SPSS, Chicago, Ill) to detect any differences between the conventional phase-unwrapping and APU techniques. (The threshold of maximum phase gradient and the technique used served as the two factors.) The threshold of maximum phase gradient value that yielded the lowest mean failure rate was identified for each technique, and the lowest failure rates of the two techniques were compared by using a paired t test.
Comparison of Adaptive and Fixed Spatial Filters
Description
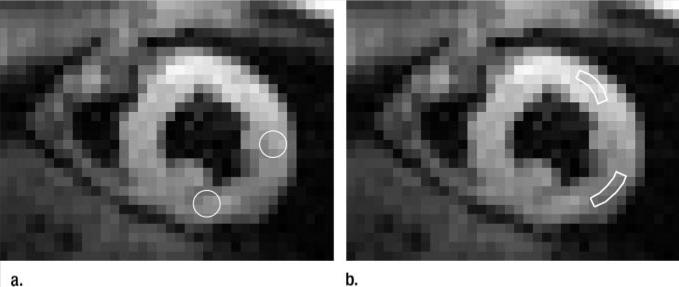
Noise suppression with spatial filtering can be viewed as smoothing in an area around the pixel of interest. Conventional spatial filtering involves the use of fixed shapes for the area, regardless of the location. Thus, conventional spatial filters have fixed kernels (Fig 5a).
Figure 5.
(a) The kernel of a fixed filter is identical at all locations. This short-axis view shows identical circular kernels at two locations in the left ventricle. (b) The kernel of an adaptive filter is always aligned with the local circumferential direction. The same short-axis view shows the arc-shaped kernels at two locations in the left ventricle.
The ASFs described in this article have kernels in the shape of thin arc sectors. The kernels (Appendix E1, http://radiology.rsnajnls.org/cgi/content/full/246/1/229/DC1) are 1 pixel thick and n pixels long (n is defined by the user) and are automatically aligned with the ventricular contours for all pixels (Fig 5b). Thus, the smoothing effect occurs only in the circumferential direction. In our study, both the adaptive and the fixed spatial filters were mean filters with equal weights for all pixels in the kernel.
In addition to the regular breath-hold acquisitions, one author (H.W., 11 years of cardiac MR imaging experience) acquired DENSE images with a high signal-to-noise ratio in four of the 12 volunteers. These images were used as the reference standard in assessing the noise and bias associated with different filters. In these examinations, the number of signals acquired was increased to 12, and respiratory gating was used instead of breath holding.
Noise levels and systematic errors associated with filters
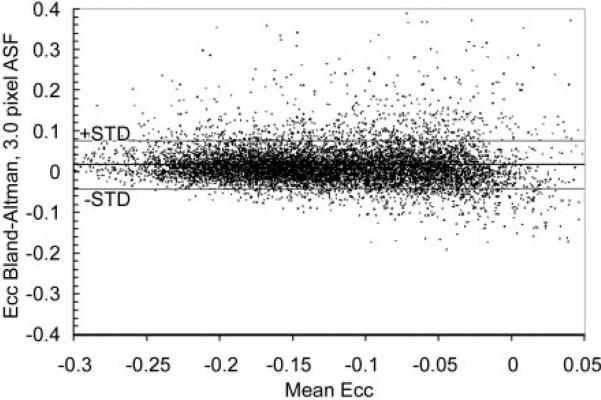
Two authors (D.B.L. and E.E.B., no prior experience and 6 years of experience with cardiac MR imaging, respectively) working in consensus estimated the noise levels and systematic errors of the strain maps against high signal-to-noise ratio standards in four volunteers after the filters were applied to displacement data. Three filter lengths (3.0, 5.7, and 8.5 pixels) were tested. Comparisons were made for each volunteer, strain type, and filter type and length, as well as on a pixel-by-pixel basis, by using Bland-Altman plots (45). A total of 56 Bland-Altman plots were generated with the following formula: (four volunteers times three filter lengths times two strain types times two filter techniques) plus (four volunteers times one unfiltered datum times two strain types). The unfiltered plots did not differentiate between the two filter techniques and were not used in subsequent statistical analyses.
In the Bland-Altman plot, the mean difference and standard deviation represent systematic bias and noise level in the filtered strain map. These were grouped according to strain type and filter type and length and resulted in 12 groups (two strain types times two filter techniques times three filter lengths). Each group contained values from the four volunteers. Means and 95% confidence intervals were calculated for each group (44). For each strain type, two-way analysis of variance was performed to compare the two filter types. Filter size and type served as the two factors. Optimal filter length was defined as the filter length with the fewest systematic biases and lowest noise levels.
Variability of segmental strain among healthy volunteers
If the spatial filters were able to lower noise levels in strain maps, we reasoned that they should bring about reduced variability in segmental strain measurements in volunteers. To test this hypothesis, two authors applied both types of filters (3-pixel length) to Ecc and Err strain maps of all volunteers (K.A.M. and E.E.B. studied seven and five volunteers, respectively) and determined the standard deviation of the group for each segment at three levels of short-axis views. A third author (H.W.) then calculated the mean and 95% confidence interval of the standard deviation for all segments. The same author compared the adaptive and fixed spatial filters with a paired t test.
Statistical analysis
All 95% confidence intervals were based on the t distribution of the specific sample size. Comparisons between the two filters were performed by using paired t tests, where results obtained with the two filters for the same segment were paired.
Effect of Adaptive Techniques on Quantitative Detection of Abnormal Wall Motion in Patients
Receiver operating characteristics relative to echocardiography
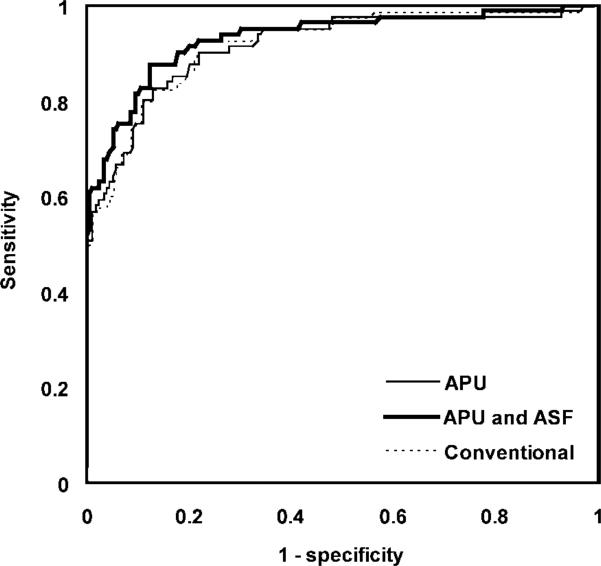
All patients underwent two-dimensional echocardiography (reference standard), which was performed by an author (J.F.P.) and a contributing physician. These physicians evaluated wall motion in the 17-segment model with trained visual inspection. Specifically, they classified each segment as normal (negative echocardiographic findings), which meant it had normal contractility, or abnormal (positive echocardiographic findings), which meant it was hypokinetic, dyskinetic, or akinetic. Three authors (R.P.L., E.E.B., and H.W.) classified the same segments with MR measurement of segmental Ecc. Specifically, two authors (R.P.L., who had no prior cardiac MR imaging experience, and E.E.B. examined 11 and five patients, respectively) who were blinded to echocardiographic results calculated the peak Ecc for 16 of the 17 segments (excluding the apex) from DENSE data in three short-axis views. A total of 256 segmental Ecc values were obtained. This was repeated in the following three postprocessing configurations: with the conventional phase-unwrapping technique and a fixed spatial filter, with the APU technique and a fixed spatial filter, and with both adaptive techniques. An author (H.W., no experience with echocardiography) classified each segment as normal (MR findings were negative for wall motion abnormality) if its Ecc was above a threshold and as abnormal (MR findings were positive for wall motion abnormality) if its Ecc was below a threshold. A two-by-two contingency table was used to compare MR imaging classification with the echo classification described previously (46), and sensitivity (number of segments with positive echocardiographic and MR findings divided by number of segments with positive echocardiographic findings) and specificity (number of segments with negative echocardiographic and MR findings divided by number of segments with negative echocardiographic findings) were calculated. This was repeated for 600 Ecc threshold values between –0.3 and 0.0 in increments of 0.0005 to create a receiver operating characteristic (ROC) curve. This process was repeated for the three postprocessing configurations described previously.
The Err had a higher noise level than did the Ecc. It is also a passive effect from the active myocardial shortening in the circumferential and longitudinal directions. For these reasons, Err was not used for MR imaging classification of segmental wall motion in our study.
Statistical analysis
Three ROC curves corresponding to postprocessing without the adaptive techniques, with only APU, and with both APU and ASF were obtained. Optimal sensitivity and optimal specificity were defined as the points of maximal product of sensitivity and specificity, respectively, on the ROC curve, and 95% confidence intervals were calculated (44). Comparisons among the three sets of values were performed by using paired t tests. Additionally, areas under the ROC curves were calculated to indicate the accuracy of the MR imaging tests relative to two-dimensional echocardiography, and statistical comparisons of the areas were performed with the methods described by Hanley and McNeil (47) and Obuchowski (48).
Results
Comparison of Adaptive and Conventional Phase-unwrapping Techniques
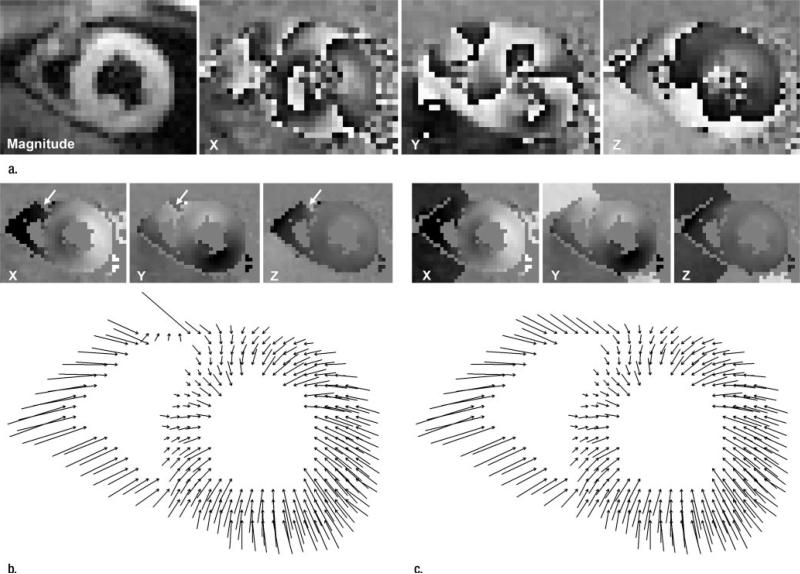
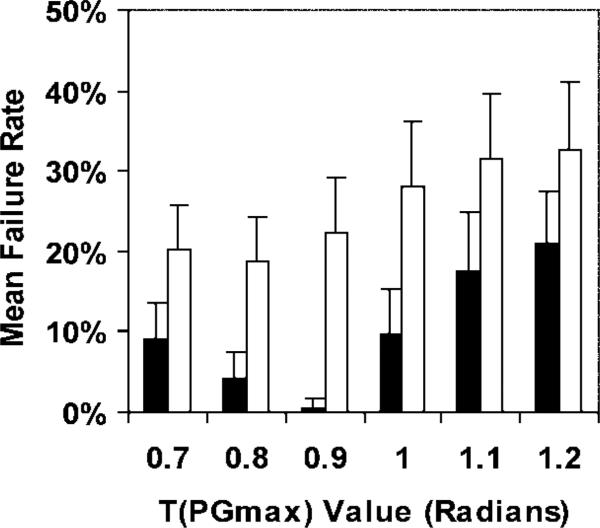
The conventional technique failed to unwrap the anterior portion of the right ventricle, as shown in Figure 6. This figure came from one of the 30 image sets that contained errors (out of a total of 159 image sets for volunteers and patients). With the exception of one failed set, all sets were corrected with APU. The APU technique had lower failure rates than did the conventional phase-unwrapping technique for all threshold of maximum phase gradient values (P < .001) (Fig 7). The optimal threshold of maximum phase gradient value for the adaptive technique was 0.9, and the corresponding mean failure rate and 95% confidence interval was 0.60% ± 1.2. The optimal threshold of maximum phase gradient value for the conventional technique was 0.8, and the corresponding mean failure rate was 18.9% ± 5.3. APU reduced the failure rate from 18.9% to 0.60% (P < .001).
Figure 6.
(a) Magnitude image and initial X, Y, and Z displacement-encoded phase maps. (b, c) Illustrations of phase unwrapping of an end-systolic cine frame of a short-axis view obtained in a volunteer. Spatial resolution is 3.0 mm. In-plane projections of three-dimensional displacement vectors are shown. The X-, Y-, and Z-encoded phase maps are shown at the top of each image. In b, the conventional phase-unwrapping technique leaves a phase fringe (arrows) in the anterior right ventricle. In c, the APU technique removes errors and pushes phase fringes beyond ventricular walls.
Figure 7.
Graph shows mean failure rates and 95% confidence intervals (error bars) of the conventional phase-unwrapping (white bars) and APU (black bars) techniques for a range of threshold of maximum phase gradient T(PGmax) values. Two-way analysis of variance was used to detect differences between the two techniques. Threshold of maximum phase gradient and technique served as the two factors. The APU technique had lower failure rates than did the conventional phase-unwrapping technique (P < .001). We compared the lowest failure rates of the two techniques and found that APU enabled reduction of the failure rate from 18.9% to 0.60% (P < .001).
Comparison of Adaptive and Fixed Spatial Filters
Noise levels and systematic errors associated with filters
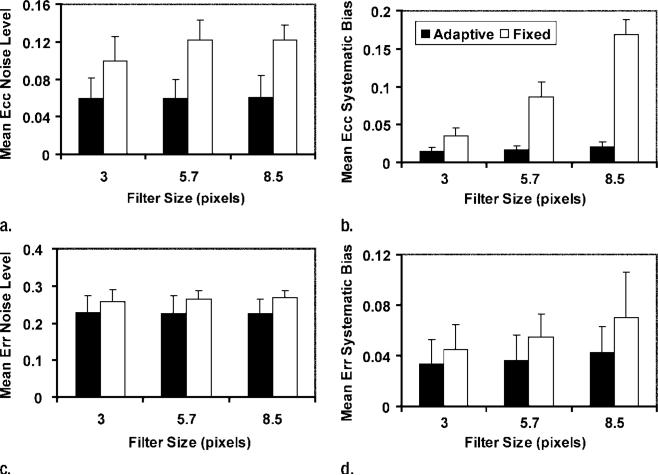
For both Ecc and Err, use of ASFs resulted in lower systematic biases (P < .001 for Ecc and P = .029 for Err) and noise levels (P < .001 for both Ecc and Err) than did use of fixed filters (Fig 8). The optimal length for ASFs was 3.0 pixels. On the Bland-Altman plot (Fig 9), a slight increase in the systematic error can be seen toward the low-strain end (Ecc > –0.05). This is probably because these data points came from the last few cine frames, in which the unencoded signal had more time to recover from T1 relaxation and was more likely to mix into the displacement-encoded signal and introduce systematic errors when its suppression was affected by patient motion or heart rate variation during the examination (38).
Figure 8.
Graphs show the effect of filters on noise levels, and systematic biases of strain maps are shown for three filter lengths. Mean and 95% confidence intervals (error bars) are shown for (a, b) Ecc and (c, d) Err. Filter types were compared with two-way analysis of variance, with filter length and type as the two factors. Adaptive filters (black bars) led to lower noise levels (a)(P < .001) and biases (b)(P < .001) in Ecc than did fixed filters (white bars). Adaptive filters also led to lower noise levels (c)(P < .001) and biases (d)(P = .029) in Err.
Figure 9.
Bland-Altman plot shows pixel-wise differences between ASF and high SNR reference standard maps of Ecc for a filter length of 3 pixels. Means and standard deviations (STD) of the differences on such plots were used to indicate systematic biases and noise levels in filtered data.
Variability of segmental strain among volunteers
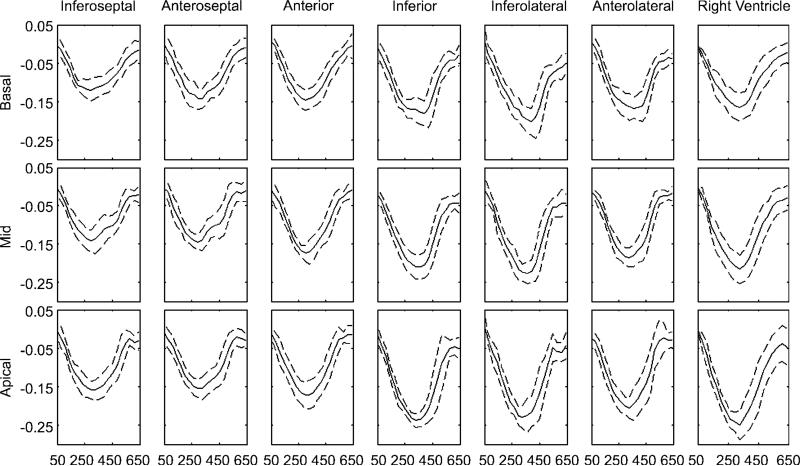
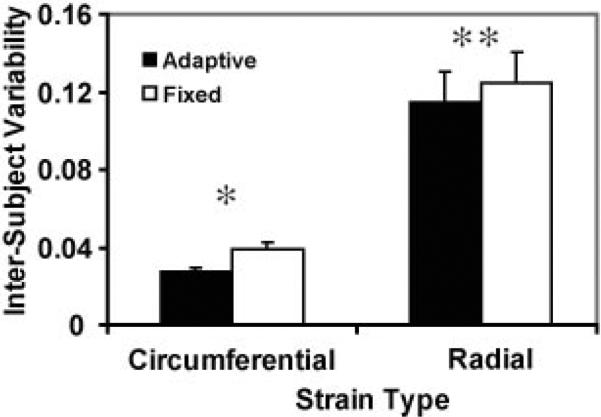
Use of the ASF resulted in lower variability among volunteers for both Ecc (P < .001) and Err (P = .020) (Figs 10, 11).
Figure 10.
Average segmental Ecc curves of the left and right ventricles for all volunteers. Solid lines are the mean, and dashed lines are 1 standard deviation. The abscissa is the time after the electrocardiographic R wave (measured in milliseconds). Short-axis views at three levels are included. Temporal resolution was 31 msec, and 20 cine frames were acquired.
Figure 11.
Variability of segmental strain values among healthy volunteers was found to be lower with an ASF than with a fixed filter. P values were less than .001 (*) and equal to .020 (**).
Effect of Adaptive Techniques on Quantitative Detection of Abnormal Wall Motion in Patients
Echocardiography enabled us to classify 80 of the 256 segments as abnormal. The 95% confidence intervals of the sensitivities for MR imaging classification without the adaptive techniques, with APU only, and with both APU and ASF were 82.5% ± 4.6, 82.7% ± 4.6, and 87.7% ± 4.0, respectively (Fig 12). The corresponding specificities were 87.1% ± 4.1, 87.1% ± 4.1, and 87.7% ± 4.0, respectively. With use of the adaptive techniques, we found a significant increase in sensitivity (P = .034) and no significant change in spec-ificity (P > .75). The Ecc threshold corresponding to the optimal point on the ROC curve with the adaptive techniques was –0.122, or 12.2% circumferential shortening. The mean areas under the ROC curves for the three postprocessing configurations were 0.918 ± 0.022 (standard error), 0.914 ± 0.022, and 0.931 ± 0.020 (Fig 13). The differences among the areas were not significant (P > .44).
Figure 12.
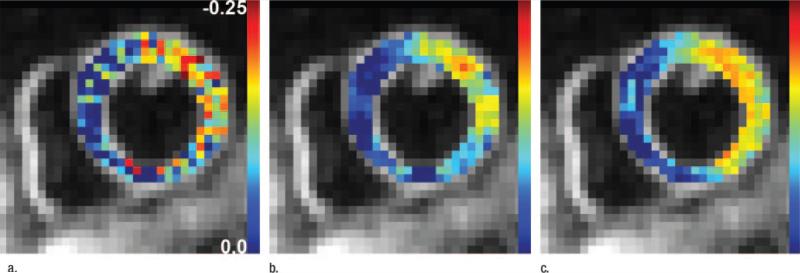
The effect of adaptive versus fixed filters on the Ecc distribution is shown in midlevel short-axis views obtained in a patient with myocardial infarction. Baseline Ecc maps obtained (a) without filters, (b) with a 3-pixel fixed filter, and (c) with a 3-pixel ASF. Different results from adaptive and conventional spatial filters led to different sensitivities in the detection of abnormal segments in patients compared with two-dimensional echocardiographic examination results.
Figure 13.
ROC curves of MR imaging classification of normal (MR negative) and abnormal (MR positive) left ventriclular segments relative to echocardiographic normal (negative echocardiographic findings) and abnormal (positive echocardiographic findings) classification (reference standard) for three postprocessing configurations with conventional techniques, with APU only, and with both APU and ASF. MR classification was based on comparison of segmental Ecc with a threshold value. The range of Ecc thresholds that produced the ROC curves was –0.3 to 0.0 in increments of 0.0005.
Discussion
The spatial resolution of current breath-hold DENSE sequences is between 3 and 4 mm (24,38), which is lower than that of breath-hold tagged imaging (2 mm) (49). However, the density of displacement measurements obtained with this method is the same as the pixel size without interpolation and is therefore higher than the 6–8-mm density that is attainable with tagged imaging.
A number of quality map–guided phase-unwrapping techniques have been developed for MR image processing (26–34,42); however, to our knowledge, there are few published reports on the failure rates in human subjects, and not one of these reports describes adaptive techniques. In our study, we found that the failure rate of conventional techniques was 18.9% with displacement-encoded images and that use of an adaptive technique reduced the failure rate to 0.60%. Our findings show that conventional techniques can be further improved by adapting the process to the anatomic areas of interest.
Errors caused by the conventional phase-unwrapping technique occurred mostly in the right ventricle. This was probably the reason for the unchanged sensitivity and specificity with and without APU in the ROC study of left ventricular segments in patients. The ASF is generally applicable as a noise suppression tool when it is desirable to have nonisotropic filters that conform to local image features.
ASFs have been used for noise suppression in the postprocessing of radiographic images and have been shown to enhance image contrast and aid in the detection of disease (50,51). Our study results showed that ASF yielded a greater decrease in noise levels in myocardial strain measurements than did fixed filters. The radiographic implementations of ASF are fully automatic and are based purely on image intensity gradients (50,51). The rationale for this approach is that gradients are highest at the boundaries between different tissue regions and therefore are indicative of the anatomic features. Similarly, on displacement-encoded cardiac MR images, the contrast between the myocardial wall and the blood pool may lead to a high gradient at the endocardial border. However, this becomes less reliable in the presence of papillary muscles, trabeculae, and occasional signal loss in the wall. For this reason, the ASFs in our study were based on semiautomated contour definition.
Our study had some limitations. First, echocardiographic findings were considered the true diagnosis (reference standard) of segmental wall motion in patients. Echocardiographic examinations have intrinsic uncertainties that arise from the variable image quality and the reader's training. However, we chose it as the reference standard primarily because of its complete independence from MR imaging. APU was not a fail-safe technique. All of the spatial filters used in our study were mean filters with uniform weight distribution over the filter kernel, and the options for other weight distributions were limited when the kernel length was only a few pixels. We also found that Err maps in the left ventricle were noisier than Ecc maps, in spite of the use of filters. This was probably due to phase oscillation in the radial direction caused by ringing artifacts from the endo- and epicardial borders. Last, ASFs have the effect of smoothing data in the circumferential direction. In patients in whom myocardial strain has abrupt changes circumferentially (eg, between injured and normal myocardium), this filter may artificially blur the transition zone.
In conclusion, use of the adaptive techniques applied in this study improves the quality of semiautomated postprocessing of displacement-encoded cardiac images and increases the sensitivity of detection of abnormal wall motion in patients.
Acknowledgment
We are grateful to Laura Ernande, MD, of Hôpital Cardiologique et Pneumologique for performing two-dimensional echocardiography in some patients.
Supported by the National Heart, Lung, and Blood Institute, National Institutes of Health.
Abbreviations
- APU
adaptive phase unwrapping
- ASF
adaptive spatial filter
- DENSE
displacement encoding with stimulated echo
- Ecc
circumferential strain
- Err
radial strain
- ROC
receiver operating characteristic
Appendix
Procedure of Adaptive Phase-Unwrapping
The existing quality map-guided phase unwrapping method consists of the following steps(35): 1. Identify a seed point in the phase map; 2. Expand a region around the seed point by including pixels bordering the region, while at the same time, searching for phase fringes; 3. When a phase fringe is encountered, the appropriate multiples of 2π are added or subtracted to the newly included pixels to remove the phase fringe. A quality map is employed to determine the order in which the border pixels are added to the region. Quality maps are functions of the signal intensity or phase gradient and preferentially guide the growth of the unwrapped region along paths of high SNR and/or smooth phase variation.
Adaptive phase-unwrapping is a modification of the above method in which the quality map takes into account the location of the myocardial wall. In APU, the quality map is defined as the product of the conventional quality map and a weight function (see “The Adaptive Weight Function for Phase-Unwrapping” section below). The weight function is biased towards the contours of the myocardial wall. APU of displacement-encoded cardiac images consists of the following steps:
The operator draws midline contours of the left and right ventricular walls in the last cine frame. The quality map for this frame is then calculated and quality map-guided 2D phase-unwrapping is then performed.
The quality map of the previous frame in the cine sequence is calculated using the contours of the current frame. Three-dimensional region growth then proceeds in a volume that includes the two frames in a third (time) axis: the unwrapped phase map of the current frame and the raw phase map of the previous frame. All unwrapped pixels in the current frame are taken as seed points and region growth is guided by the quality maps of both frames. A phase-gradient threshold is used to gate the region growth.
The contours are updated for the previous frame (see “Updating Mid-line Ventricular Contours During Adaptive Phase-Unwrapping” below) using the displacement vectors calculated from the unwrapped phase maps in step 2.
The previous frame then becomes the current frame, and steps 2 and 3 are repeated until all cine frames are unwrapped. Empirically we find that step 2 is more reliable when the phase-gradient in the temporal dimension is defined as the apparent acceleration of phase(52).
Updating Mid-line Ventricular Contours During Adaptive Phase-Unwrapping
The displacement vectors obtained in DENSE imaging represent tissue displacement from the time of position-encoding immediately after the R wave of the ECG, to the time of each cine frame. The ventricular contours are defined manually for the last cine frame. The process to update them for the other frames proceeds simultaneously with adaptive phase-unwrapping. It consists of the following steps:
The last cine frame (frame N) is unwrapped using the known contours. The displacement vectors on the contours are fitted to parametric functions of the length variable along the contour, l. These functions are denoted as DN(l)
The contours of frame N are passed to frame N-1, which are used for the APU of frame N-1. This step also uses the unwrapped phase maps of frame N as starting seeds. The displacement vectors on the contours are again fitted to parametric functions as in step 1. This yields DN-1(l).
The new contour for frame N-1 is calculated as CN–1(l)=CN(l)+DN–1(l)–DN(l), where CN(l) and CN-1(l) are the contour positions of frames N and N-1, respectively.
These steps are repeated until all cine frames are unwrapped.
The Adaptive Weight Function for Phase-Unwrapping
In adaptive phase-unwrapping the quality map is defined as Q(x,y) = I(x, y)W(x, y), where I(x, y) is the image intensity masked by the phase gradient threshold, and the weight function W(x, y) is biased towards the ventricular contours. It has the form of
where l is the length variable along the contours, xc(l) and yc(l) are the coordinates of the contours, and the constant Δ is set to one pixel width.
The T(PGmax) in the temporal direction is further refined to be the apparent acceleration of phase(52) (ϕi - ϕi-1) - (ϕi-1 - ϕi-2), where ϕi is the phase of the current frame i, and ϕi-1 and ϕi-2 are the phases of the previous two frames.
Calculation of Adaptive-Filter Kernels
Since the kernels are aligned locally with the circumferential direction (CD), the first step is to calculate the map of CD vectors. For pixels that fall on the contours, the CD is simply the tangent direction of the contour. These tangent vectors are then expanded to the entire image using a distance weighted formula, where the CD at a specific pixel is the sum of the tangents all along the contours weighted inversely by the distance between the pixel and the contour points.
The CD vectors are also used in the calculation of circumferential and radial strain values.
Footnotes
Supplemental material: http://radiology.rsnajnls.org/cgi/content/full/246/1/229/DC1
Authors stated no financial relationship to disclose.
References
- 1.Braunwald E, Antman EM, Beasley JW, et al. ACC/AHA guidelines for the management of patients with unstable angina and non-ST-segment elevation myocardial infarction: a report of the American College of Cardiology/American Heart Association Task Force on Practice Guidelines (Committee on the Management of Patients with Unstable Angina). J Am Coll Cardiol. 2000;36:970–1062. doi: 10.1016/s0735-1097(00)00889-5. [Published correction appears in J Am Coll Cardiol 2001;38:294–295.] [DOI] [PubMed] [Google Scholar]
- 2.Hunt SA, Baker DW, Chin MH, et al. ACC/AHA guidelines for the evaluation and management of chronic heart failure in the adult: executive summary—a report of the American College of Cardiology/American Heart Association Task Force on Practice Guidelines (Committee to Revise the 1995 Guidelines for the Evaluation and Management of Heart Failure). J Am Coll Cardiol. 2001;38:2101–2113. doi: 10.1016/s0735-1097(01)01683-7. [DOI] [PubMed] [Google Scholar]
- 3.Lipton MJ, Bogaert J, Boxt LM, Reba RC. Imaging of ischemic heart disease. Eur Radiol. 2002;12:1061–1080. doi: 10.1007/s003300101131. [DOI] [PubMed] [Google Scholar]
- 4.Wu KC, Lima JA. Noninvasive imaging of myocardial viability: current techniques and future developments. Circ Res. 2003;93:1146–1158. doi: 10.1161/01.RES.0000103863.40055.E8. [DOI] [PubMed] [Google Scholar]
- 5.Franklin K, Marwick TH. Non-invasive techniques for assessing cardiovascular function: which, if any, are relevant to clinical practice? Coron Artery Dis. 2002;13:391–397. [Google Scholar]
- 6.Grude M, Juergens KU, Wichter T, et al. Evaluation of global left ventricular myocardial function with electrocardiogram-gated multidetector computed tomography: comparison with magnetic resonance imaging. Invest Radiol. 2003;38:653–661. doi: 10.1097/01.rli.0000077070.40713.76. [DOI] [PubMed] [Google Scholar]
- 7.Notomi Y, Setser RM, Shiota T, et al. Assessment of left ventricular torsional deformation by Doppler tissue imaging: validation study with tagged magnetic resonance imaging. Circulation. 2005;111:1141–1147. doi: 10.1161/01.CIR.0000157151.10971.98. [DOI] [PubMed] [Google Scholar]
- 8.Mahnken AH, Katoh M, Bruners P, et al. Acute myocardial infarction: assessment of left ventricular function with 16-detector row spiral CT versus MR imaging—study in pigs. Radiology. 2005;236:112–117. doi: 10.1148/radiol.2361040923. [DOI] [PubMed] [Google Scholar]
- 9.Raman SV, Shah M, McCarthy B, Garcia A, Ferketich AK. Multi-detector row cardiac computed tomography accurately quantifies right and left ventricular size and function compared with cardiac magnetic resonance. Am Heart J. 2006;151:736–744. doi: 10.1016/j.ahj.2005.04.029. [DOI] [PubMed] [Google Scholar]
- 10.Isbell DC, Kramer CM. Cardiovascular magnetic resonance: structure, function, perfusion, and viability. J Nucl Cardiol. 2005;12:324–336. doi: 10.1016/j.nuclcard.2005.02.001. [DOI] [PubMed] [Google Scholar]
- 11.Zerhouni EA, Parish DM, Rogers WJ, Yang A, Shapiro EP. Human heart: tagging with MR imaging—a method for noninvasive assessment of myocardial function. Radiology. 1988;169:59–63. doi: 10.1148/radiology.169.1.3420283. [DOI] [PubMed] [Google Scholar]
- 12.Axel L, Dougherty L. MR imaging of motion with spatial modulation of magnetization. Radiology. 1989;171:841–845. doi: 10.1148/radiology.171.3.2717762. [DOI] [PubMed] [Google Scholar]
- 13.Pelc LR, Sayre J, Yun K, et al. Evaluation of myocardial motion tracking with cine-phase contrast magnetic resonance imaging. Invest Radiol. 1994;29:1038–1042. doi: 10.1097/00004424-199412000-00005. [DOI] [PubMed] [Google Scholar]
- 14.Constable RT, Rath KM, Sinusas AJ, Gore JC. Development and evaluation of tracking algorithms for cardiac wall motion analysis using phase velocity MR imaging. Magn Reson Med. 1994;32:33–42. doi: 10.1002/mrm.1910320106. [DOI] [PubMed] [Google Scholar]
- 15.Jung B, Zaitsev M, Hennig J, Markl M. Navigator gated high temporal resolution tissue phase mapping of myocardial motion. Magn Reson Med. 2006;55:937–942. doi: 10.1002/mrm.20808. [DOI] [PubMed] [Google Scholar]
- 16.Guttman MA, Prince JL, McVeigh ER. Tag and contour detection in tagged MR images of the left ventricle. IEEE Trans Med Imaging. 1994;13:74–88. doi: 10.1109/42.276146. [DOI] [PubMed] [Google Scholar]
- 17.Stuber M, Scheidegger MB, Fischer SE, et al. Alterations in the local myocardial motion pattern in patients suffering from pressure overload due to aortic stenosis. Circulation. 1999;100:361–368. doi: 10.1161/01.cir.100.4.361. [DOI] [PubMed] [Google Scholar]
- 18.Meyer FG, Constable RT, Sinusas AJ, Duncan JS. Tracking myocardial deformation using phase contrast MR velocity fields: a stochastic approach. IEEE Trans Med Imaging. 1996;15:453–465. doi: 10.1109/42.511749. [DOI] [PubMed] [Google Scholar]
- 19.Callaghan PT, Eccles CD, Xia Y. NMR microscopy of dynamic displacements: k-space and q-space imaging. J Phys Chem E Sci Instrum. 1988;21:820–822. [Google Scholar]
- 20.Aletras AH, Ding SJ, Balaban R, Wen H. Proceedings of the Sixth Meeting of the International Society for Magnetic Resonance in Medicine. International Society for Magnetic Resonance in Medicine; Berkeley, Calif: 1998. Displacement encoding in cardiac functional MRI [abstr]. p. 281. [Google Scholar]
- 21.Aletras AH, Ding SJ, Balaban RS, Wen H. DENSE: displacement encoding with stimulated echoes in cardiac functional MRI. J Magn Reson. 1999;137:247–252. doi: 10.1006/jmre.1998.1676. [DOI] [PMC free article] [PubMed] [Google Scholar]
- 22.Tseng WY, Reese TG, Weisskoff RM, Brady TJ, Wedeen VJ. Myocardial fiber shortening in humans: initial results of MR imaging. Radiology. 2000;216:128–139. doi: 10.1148/radiology.216.1.r00jn39128. [DOI] [PubMed] [Google Scholar]
- 23.Aletras AH, Balaban RS, Wen H. High-resolution strain analysis of the human heart with fast-DENSE. J Magn Reson. 1999;140:41–57. doi: 10.1006/jmre.1999.1821. [DOI] [PubMed] [Google Scholar]
- 24.Kim D, Gilson WD, Kramer CM, Epstein FH. Myocardial tissue tracking with two-dimensional cine displacement-encoded MR imaging: development and initial evaluation. Radiology. 2004;230:862–871. doi: 10.1148/radiol.2303021213. [DOI] [PubMed] [Google Scholar]
- 25.Buonocore MH. Latest pulse sequence for displacement-encoded MR imaging incorporates essential technical improvements for multiphase measurement of intramyocardial strain. Radiology. 2004;230:615–617. doi: 10.1148/radiol.2303031989. [DOI] [PubMed] [Google Scholar]
- 26.Axel L, Morton D. Correction of phase wrapping in magnetic resonance imaging. Med Phys. 1989;16:284–287. doi: 10.1118/1.596378. [DOI] [PubMed] [Google Scholar]
- 27.Hedley M, Rosenfeld D. A new 2-dimensional phase unwrapping algorithm for MRI images. Magn Reson Med. 1992;24:177–181. doi: 10.1002/mrm.1910240120. [DOI] [PubMed] [Google Scholar]
- 28.Szumowski J, Coshow WR, Li F, Quinn SF. Phase unwrapping in the three-point Dixon method for fat suppression MR imaging. Radiology. 1994;192:555–561. doi: 10.1148/radiology.192.2.8029431. [DOI] [PubMed] [Google Scholar]
- 29.Song SM, Napel S, Pelc NJ, Glover GH. Phase unwrapping of MR phase images using Poisson equation. IEEE Trans Image Proc. 1995;4:667–676. doi: 10.1109/83.382500. [DOI] [PubMed] [Google Scholar]
- 30.An L, Xiang QS, Chavez S. A fast implementation of the minimum spanning tree method for phase unwrapping. IEEE Trans Med Imaging. 2000;19:805–808. doi: 10.1109/42.876306. [DOI] [PubMed] [Google Scholar]
- 31.Chen CW, Zebker HA. Two-dimensional phase unwrapping with use of statistical models for cost functions in nonlinear optimization. J Opt Soc Am A Opt Image Sci Vis. 2001;18:338–351. doi: 10.1364/josaa.18.000338. [DOI] [PubMed] [Google Scholar]
- 32.Cusack R, Papadakis N. New robust 3-D phase unwrapping algorithms: application to magnetic field mapping and undistorting echoplanar images. Neuroimage. 2002;16:754–764. doi: 10.1006/nimg.2002.1092. [DOI] [PubMed] [Google Scholar]
- 33.Jenkinson M. Fast, automated, N-dimensional phase-unwrapping algorithm. Magn Reson Med. 2003;49:193–197. doi: 10.1002/mrm.10354. [DOI] [PubMed] [Google Scholar]
- 34.Ying L, Liang ZP, Munson DC, Koetter R, Frey BJ. Unwrapping of MR phase images using a Markov random field model. IEEE Trans Med Imaging. 2006;25:128–136. doi: 10.1109/TMI.2005.861021. [DOI] [PubMed] [Google Scholar]
- 35.Ghiglia DC, Pritt MD. Two-dimensional phase unwrapping: theory, algorithms, and software. Wiley; New York, NY: 1998. [Google Scholar]
- 36.Wen H. Proceedings of the 22nd Meeting of the European Society of Magnetic Resonance in Medicine and Biology. European Society of Magnetic Resonance in Medicine and Biology; Basle, Switzerland: 2005. Anatomically guided shaped smoothing in myocardial strain analysis [abstr]. p. 469. [Google Scholar]
- 37.Davis JS, Hassanzadeh S, Winitsky S, et al. The overall pattern of cardiac contraction depends on a spatial gradient of myosin regulatory light chain phosphorylation. Cell. 2001;107:631–641. doi: 10.1016/s0092-8674(01)00586-4. [DOI] [PubMed] [Google Scholar]
- 38.Bennett E, Spottiswoode BS, Lorenz CH, Wen H. Optimal combination of phase cycling and gradient spoiling in DENSE displacement mapping [abstr]. Proceedings of the 14th Meeting of the International Society for Magnetic Resonance in Medicine. Berkeley, Calif: International Society for Magnetic Resonance in Medicine. 2006:1649. [Google Scholar]
- 39.Bennett E, Pai V, Wen H. Ultrafast DENSE technique for mapping the volumetric 3D wall motion of the left ventricle [abstr]. Proceedings of the 10th Meeting of the International Society for Magnetic Resonance in Medicine. Berkeley, Calif: International Society for Magnetic Resonance in Medicine. 2002:775. [Google Scholar]
- 40.Bernstein MA, Grgic M, Brosnan TJ, Pelc NJ. Reconstructions of phase contrast, phased array multicoil data. Magn Reson Med. 1994;32:330–334. doi: 10.1002/mrm.1910320308. [DOI] [PubMed] [Google Scholar]
- 41.Wen H, Bennett E, Epstein ND, Plehn J. Cardiac contractile dyssynchrony mapping using DENSE displacement imaging, preliminary tests in normal subjects [abstr]. J Cardiac Magn Reson. 2006;8(suppl):96–97. [Google Scholar]
- 42.Spottiswoode BS, Zhong X, Meintjes EM, Mayosi BM, Epstein FH. Proceedings of the 13th Meeting of the International Society for Magnetic Resonance in Medicine. International Society for Magnetic Resonance in Medicine; Berkeley, Calif: 2005. Improved myocar-dial tissue tracking and strain accuracy in cine-DENSE using temporal fitting [abstr]. p. 778. [Google Scholar]
- 43.Cerqueira MD, Weissman NJ, Dilsizian V, et al. Standardized myocardial segmentation and nomenclature for tomographic imaging of the heart: a statement for health-care professionals from the Cardiac Imaging Committee of the Council on Clinical Cardiology of the American Heart Association. Circulation. 2002;105:539–542. doi: 10.1161/hc0402.102975. [DOI] [PubMed] [Google Scholar]
- 44.Medina LS, Zurakowski D. Measurement variability and confidence intervals in medicine: why should radiologists care? Radiology. 2003;226:297–301. doi: 10.1148/radiol.2262011537. [DOI] [PubMed] [Google Scholar]
- 45.Bland JM, Altman DG. Statistical methods for assessing agreement between two methods of clinical measurement. Lancet. 1986;1:307–310. [PubMed] [Google Scholar]
- 46.Langlotz CP. Fundamental measures of diagnostic examination performance: usefulness for clinical decision making and research. Radiology. 2003;228:3–9. doi: 10.1148/radiol.2281011106. [DOI] [PubMed] [Google Scholar]
- 47.Hanley JA, Mcneil BJ. The meaning and use of the area under a receiver operating characteristic (ROC) curve. Radiology. 1982;143:29–36. doi: 10.1148/radiology.143.1.7063747. [DOI] [PubMed] [Google Scholar]
- 48.Obuchowski NA. Receiver operating characteristic curves and their use in radiology. Radiology. 2003;229:3–8. doi: 10.1148/radiol.2291010898. [DOI] [PubMed] [Google Scholar]
- 49.Kramer U, Deshpande V, Fenchel M, et al. Cardiac MR tagging: optimization of sequence parameters and comparison at 1.5 T and 3.0 T in a volunteer study [in German]. Rofo. 2006;178:515–524. doi: 10.1055/s-2006-926473. [DOI] [PubMed] [Google Scholar]
- 50.Correa J, Souto M, Tahoces PG, et al. Digital chest radiography: comparison of unprocessed and processed images in the detection of solitary pulmonary nodules. Radiology. 1995;195:253–258. doi: 10.1148/radiology.195.1.7892481. [DOI] [PubMed] [Google Scholar]
- 51.Ueyama T, Kawamoto K, Yamada Y, Yoshikawa H, Masuda K. Advance in the diagnosis of esophageal carcinoma: a new imaging process by adaptive spatial filtering of computed esophagograms. Acta Radiol. 1998;39:47–51. doi: 10.1080/02841859809172148. [DOI] [PubMed] [Google Scholar]


