

Abstract
Cystathionine β-synthase (CBS) is a key enzyme that catalyzes the rate-limiting step for homocysteine (Hcy) metabolism via the trans-sulfuration pathway and is also responsible for the production of H2S through the desulfhydration reaction. Our recent studies demonstrate that renal ischemia/reperfusion decreased the CBS activity leading to Hcy accumulation and H2S reduction in the kidney, which in turn contributed to kidney injury. Both Hcy and H2S play important roles in physiological and pathological processes. In this study we investigated the molecular mechanism by which CBS activity was regulated in the kidney. The left kidney of Sprague-Dawley rat was subjected to 45 min of ischemia followed by 6 h of reperfusion. Ischemia/reperfusion caused a significant decrease in CBS mRNA and protein levels in the kidney. As a consequence, there was a marked reduction in the CBS enzyme activity. Transfection of kidney proximal tubular cells with transcription factor (Sp1) small interfering RNA caused a marked reduction in CBS mRNA, indicating a pivotal role for Sp1 in regulating CBS expression in kidney cells. Electrophoretic mobility shift assay and chromatin immunoprecipitation assay detected a lower Sp1 activity in kidneys subjected to ischemia/reperfusion as compared with that in a sham-operated group. ERK-mediated phosphorylation of Sp1 was responsible for a decreased transcriptional activity of Sp1 in the kidney upon ischemia/reperfusion. These results suggest that reduced kidney CBS gene expression during ischemia/reperfusion is mediated via a decrease in Sp1 transcriptional activity. Regulation of CBS-mediated Hcy and H2S homeostasis may offer a renal protective effect against ischemia/reperfusion injury.
Keywords: Enzymes, Homocysteine, Ischemia, Kidney, Metabolism, Sp1
Introduction
Homocysteine (Hcy)2 and H2S are two important molecules produced in the body during the metabolism of sulfur amino acids. Cystathionine β-synthase (CBS, EC 4.2.1.22) is a key enzyme that regulates the metabolism of Hcy and H2S (1). Hcy is an intermediate amino acid formed during the conversion of methionine to cysteine and is central to the supply of methyl groups that are critical to normal cell function. Hcy can be metabolized via two major pathways, namely the remethylation pathway (remethylation of Hcy to methionine) and the trans-sulfuration pathway (trans-sulfuration of Hcy to cysteine) (2). CBS catalyzes the rate-limiting step in the trans-sulfuration pathway (2). When Hcy metabolism is impaired, an increase in its concentration in the blood occurs, a condition termed hyperhomocysteinemia. Regarded as a risk factor for cardiovascular and cerebral vascular diseases (3–5), Hcy, at elevated levels, also affects the function of other organs such as liver and kidney (6, 7). The kidney plays an important role in regulating Hcy concentrations in the circulation. It is estimated that the kidney is responsible for the removal of ∼20% of Hcy from the systemic circulation (8). Metabolism of Hcy in the kidney (up to 78%) is primarily through the trans-sulfuration pathway, in which the CBS enzyme regulates the rate-limiting step by condensing Hcy with serine to form cystathionine (8). Impaired kidney function is inversely correlated with the Hcy level in the circulation (9). CBS is also responsible for the endogenous synthesis of H2S from cysteine and Hcy through a β-replacement reaction (10, 11). H2S has recently emerged as an important biologically active compound in human health and disease. At physiological concentrations, H2S acts as an essential gaseous neurotransmitter (12) and has the ability to attenuate myocardial ischemia/reperfusion injury in animal models (13). A decrease in H2S production leads to various diseases including Alzheimer disease (14), atherosclerosis (15), and portal hypertension (6). Our recent study indicates that a reduction of endogenous H2S production is associated with kidney ischemia/reperfusion injury (16). Because of the critical roles of CBS in regulating Hcy and H2S levels, it is of great importance to understand the mechanisms that govern CBS regulation.
The active form of the CBS enzyme is a homotetramer that is composed of four identical polypeptide monomers (17). Each monomer (63 kDa) consists of three domains: the heme-binding domain (N-terminal amino acids), the catalytic core domain (the central amino acids), and the regulatory domain (C-terminal amino acids). The CBS activity is regulated at the transcriptional and post-translational levels. Previous studies have mapped the transcriptional start sites of five human CBS mRNA isoforms, among which CBS-1a and -1b form the vast majority of transcripts and CBS-1b promoter has the greatest promoter activity (18, 19). Several transcription factors, Sp1/Sp3, nuclear factor Y, and upstream stimulatory factor 1, have been suggested as potential transactivators for the human CBS-1b basal promoter (20–22). The significance of Sp1/Sp3-binding sites has been confirmed in human cells to be responsible for the predominant regulation of CBS-1b promoter activity (20, 21). According to the 5′-end DNA sequence of rat gene, there are two homologous Sp1-binding sites in the promoter region of the CBS gene (23). However, little is known regarding the transcriptional regulation of CBS expression in rodents.
Kidney ischemia/reperfusion injury is often experienced by patients in the perioperative period, which leads to a high rate of morbidity and mortality. Ischemia/reperfusion injury is a result of decreased blood flow to the tissue followed by restoration of blood flow to the ischemic area. Hyperhomocysteinemia is a common clinical finding in patients with chronic kidney disease or acute renal failure (24). We have investigated the role of CBS in Hcy and H2S metabolism in a rat model with kidney ischemia/reperfusion (16, 25, 26). Ischemia/reperfusion causes a reduction of CBS activity leading to Hcy accumulation in the kidney (26). Hcy, at elevated levels, exacerbates oxidative stress and cell death in the kidney (25). We have also observed that ischemia/reperfusion leads to a reduction of H2S levels in the kidney (16). Administration of exogenous H2S donor or anti-Hcy antibodies reduces ischemia/reperfusion-induced cell death and significantly improves kidney function (16, 25). Although metabolic acidosis and nitric oxide accumulation contribute to the reduced CBS activity in the kidney, the correction of pH and removal of excess nitric oxide cannot fully restore CBS activity (26). Additional mechanisms may be involved in the regulation of CBS activity in the kidney.
The aim of the present study was to elucidate the molecular mechanism by which CBS expression was regulated in the kidney during ischemia/reperfusion injury. Our results demonstrated that ischemia/reperfusion caused a reduction of CBS mRNA gene expression leading to a decrease in CBS protein levels and enzyme activity. Further analysis revealed that ischemia/reperfusion-induced reduction in CBS expression was due to a decrease in the transcriptional regulation by transcription factor Sp1. Activation of ERK resulted in increased phosphorylation of Sp1, which accounted for decreased transcriptional activation of CBS gene expression in the kidney during ischemia/reperfusion.
EXPERIMENTAL PROCEDURES
Kidney Ischemia/Reperfusion
Male Sprague-Dawley rats weighing 250–300 g were anesthetized with intraperitoneal injection of sodium pentobarbital (50 mg/kg). The rats were kept on a heat pad, and the rectal temperature was maintained at 37 °C throughout the experimental procedure. Renal ischemia was induced by clamping the left renal artery for 45 min (25, 26). The rats were subjected to 6 h of reperfusion after ischemia. A sham-operated group of rats were subjected to the same surgical procedure but without inducing ischemia/reperfusion and were sacrificed at the corresponding time points. The results obtained from this group were used as controls. A blood sample was drawn from the abdominal aorta before the rat was sacrificed. The plasma was separated by centrifugation of blood at 3000 × g for 20 min at 4 °C. The plasma creatinine level was determined by using a commercial assay kit (Wako Chemical Industries) (25–27). The kidneys were harvested and collected in ice-cold potassium phosphate buffer. The Hcy concentration in the kidney tissue homogenate was measured with the IMx Hcy assay, which was based on fluorescence polarization immunoassay technology (Abbott Diagnostics, Abbott Park, IL) (25, 28–30), whereas the H2S concentration was measured based on a method described by Stipanuk and Beck (31). All of the procedures were performed in accordance with the Guide to the Care and Use of Experimental Animals published by the Canadian Council on Animal Care and approved by the University of Manitoba Protocol Management and Review Committee. All of the chemicals were obtained from Sigma-Aldrich unless otherwise indicated.
Induction of Ischemia/Reperfusion in Cell Culture
Human kidney cortex proximal tubular cells (HK-2; CRL-2190) were purchased from the American Type Culture Collection and cultured in keratinocyte serum-free medium supplied with human recombinant epidermal growth factor and bovine pituitary extract (Invitrogen) at 37 °C in a normal atmosphere of 95% air and 5% CO2. Ischemia in cultured cells was induced by oxygen-glucose deprivation as previously described (32, 33). In brief, tubular cells were incubated for 2 h in a modified Krebs buffer (137 mm NaCl, 3.8 mm KCl, 0.49 mm MgCl2, 0.9 mm CaCl2, and 4 mm HEPES) supplemented with 10 mm 2-deoxyglucose, 20 mm sodium lactate, 12 mm KCl, and 1 mm sodium dithionite (pH 6.2) in a hypoxia chamber (Billups-Rothenberg, Inc., Del Mar, CA) containing 95% N2 and 5% CO2 at 37 °C. Control cells were incubated in a modified Krebs buffer (pH 7.4) containing d-glucose at 37 °C in a normal atmosphere. After incubation for 2 h, the Krebs buffer was replaced with keratinocyte serum-free medium, and the cells were cultured for another 6 h. To determine the role of the ERK1/2 pathway in the regulation of Sp1 transcriptional activity, tubular cells were preincubated with 10 μm inhibitor PD98059 (Calbiochem, San Diego, CA) for 30 min followed by ischemia/reperfusion.
Real Time PCR
Total RNAs were isolated from the kidney tissue or human tubular cells with TRIzol reagent (Invitrogen) according to the manufacturer's instructions. CBS and Sp1 mRNA were determined by a real time PCR analysis using the iQ5 real time PCR detection system (Bio-Rad). In brief, 2 μg of RNA was reverse transcribed to cDNA in a total volume of 20 μl with the reverse transcription reagents mixer. The reaction mixture of real time PCR contained 0.4 μm of 5′ and 3′ primers, 2 μl of cDNA product, and iQ-SYBR green supermix reagent (Bio-Rad) in a total volume of 25 μl. The sequences of the primers are as follows: rat CBS (148 bp), 5′-TCGTGATGCCAGAGAAGATG-3′ (forward) and 5′-TTGGGGATTTCGTTCTTCAG-3′ (reverse) (GenBankTM accession number NM_012522); human CBS (148 bp), 5′-TCGTGATGCCTGAGAAGATG-3′ (forward) and 5′-TTGGGGATTTCGTTCTTCAG-3′ (reverse) (GenBankTM accession number NM_000071); human Sp1 (185 bp), 5′-TGCAGCAGAATTGGAGTCACC-3′ (forward) and 5′-TTGGTACTGCTGCCACTCTG-3′ (reverse) (GenBankTM accession number NM_138473); rat GAPDH, 5′-TCAAGAAGGTGGTGAAGCAG-3′ (forward) and 5′-AGGTGGAAGAATGGGAGTTG-3′ (reverse) (GenBankTM accession number NM_017008); and human GAPDH: 5′-ATCATCCCTGCCTCTACTGG-3′ (forward) and 5′-GTCAGGTCCACCACTGACAC-3′ (reverse) (GenBankTM accession number NM_002046). All of the primers were purchased from Invitrogen.
Western Immunoblotting Analysis
CBS, Sp1, phospho-ERK1/2, and total ERK1/2 proteins in the kidney tissue or tubular cells were determined by Western immunoblotting analysis. In brief, kidney proteins (60 μg) were separated by electrophoresis in a 10% SDS-polyacrylamide gel. Proteins in the gel were transferred to a nitrocellulose membrane that was probed with mouse polyclonal anti-CBS antibodies (Abnova Corporation), rabbit polyclonal anti-Sp1 antibodies (Millipore, Billerica, MA), rabbit polyclonal anti-phospho-ERK1/2 antibodies (Cell Signaling Technology, Inc., Danvers, MA), rabbit polyclonal anti-ERK1/2 antibodies (Cell Signaling Technology, Inc.), rabbit polyclonal anti-β-actin antibodies (Santa Cruz Biotechnology, Inc., Santa Cruz, CA), or rabbit monoclonal anti-GAPDH antibodies (Cell Signaling Technology, Inc.). The membrane was visualized using enhanced chemiluminescence reagents and analyzed with a gel documentation system (Bio-Rad Gel Doc1000).
Electrophoretic Mobility Shift Assay (EMSA)
Nuclear proteins were prepared from the kidney tissue and tubular cells (34, 35). Nuclear proteins (10 μg) were incubated with excess 32P-end-labeled oligonucleotides containing the consensus sequence specific for the Sp1-DNA-binding site (Promega, Madison, WI). The sequence of the oligonucleotide probe was 5′-ATTCGATCGGGGCGGGGCGAG-3′. The reaction mixture was then separated in a 6% nondenaturing polyacrylamide gel and dried on a piece of filter paper followed by autoradiography (30, 34, 35). The cold competition experiment was performed by adding a 100-fold excess unlabeled Sp1 probe prior to the addition of the 32P-end-labeled oligonucleotide in the reaction mixture to confirm the specificity of binding 32P-labeled oligonucleotide with Sp1. In another set of experiments, nuclear proteins were incubated with 32P-labeled Sp1 consensus oligonucleotides. The Sp1-DNA complex was separated from free DNA oligonucleotides in a 6% nondenaturing polyacrylamide gel and dried on a piece of filter paper followed by autoradiography. The area of the Sp1-DNA bands was cut out according to the autoradiograph image, and radioactivity corresponding to each band was measured using a liquid scintillation counter (30). The supershift assay was performed by preincubating nuclear proteins (1 μg) with 1 μl of anti-Sp1 antibodies (Millipore) or anti-phosphoserine antibodies (Sigma-Aldrich) for 30 min followed by nondenaturing polyacrylamide gel (4%) electrophoresis (35).
Chromatin Immunoprecipitation Assay (ChIP)
ChIP was performed as previously described (30, 36). In brief, cross-linking of DNA with proteins was performed by treating a portion of kidney tissue with 1% formaldehyde. The nuclei were isolated, and sheared chromatin was prepared by sonication. The sheared chromatin was immunoprecipitated with rabbit polyclonal anti-Sp1 antibodies. Another aliquot of sheared chromatin without incubation with antibodies was prepared to normalize the amount of total DNA subjected to ChIP assay (termed mock immunoprecipitation). DNA was then isolated from the immunoprecipitate, and real time PCR was performed using primers specific for the CBS promoter region with the Sp1-binding consensus sequence based on the information from GenBankTM number U43723 and NW_047598. The sequences of the primers for the CBS promoter region were 5′-TAGACGGCAGAGCCTTTCGA-3′ (forward) and 5′-AATCCCCGGCCGTAGAAC-3′ (reverse).
Transfection of Cells with Sp1 siRNA
Human proximal tubular cells (HK2) were transfected with Sp1 siRNA duplex oligoribonucleotides (StealthTM RNA interference; Invitrogen) according to the manufacturer's instructions. For a negative control, the cells were transfected with StealthTM RNA interference negative control (Invitrogen) consisting of a scrambled sequence that was unable to inhibit gene expression. At 72 h after transfection, the cells were collected, and total RNAs as well as proteins were isolated. The Sp1 and CBS mRNA were determined by real time PCR analysis. The Sp1 and CBS proteins were determined by Western immunoblotting analysis.
Immunoprecipitation and Immunoblotting Analysis
Immunoprecipitation and Western immunoblotting were conducted to detect phosphorylated Sp1 in the kidney tissue. In brief, a portion of kidney tissue was homogenized in immunoprecipitation buffer (50 mm HEPES, pH 7.4, 150 mm NaCl, 10 mm sodium pyrophosphate, 10 mm EDTA, 10 mm EGTA, and 1 mm sodium orthovanadate) with 1% Triton X-100 and mixture protease inhibitors. Kidney proteins (1000 μg) were incubated with rabbit polyclonal anti-Sp1 antibodies (Millipore) at 4 °C overnight followed by precipitation with protein A-agarose beads (40 μl). The immunoprecipitated proteins were then subjected to Western immunoblotting analysis using mouse monoclonal anti-phosphoserine antibodies (Sigma-Aldrich). The total Sp1 protein in the immunoprecipitate was determined by Western immunoblotting analysis using polyclonal anti-Sp1 antibodies. The phosphorylated Sp1 protein level was normalized to the total Sp1 detected in the immunoprecipitate.
Nuclear Protein Dephosphorylation
Nuclear proteins (10 μg) from sham-operated or ischemia/reperfused kidneys were incubated with or without 2 milliunits of calf intestinal alkaline phosphatase (New England Biolabs) for 5 min at room temperature in dephosphorylation buffer (25 mm HEPES, pH 7.5, 34 mm KCl, and 50 mm MgCl2). The dephosphorylated nuclear protein was used for EMSA (20, 37).
CBS Activity Assay
The CBS activity in the kidney tissue was determined as previously described (25, 26). In brief, a reaction mixture contained an aliquot of kidney tissue homogenate (0.1 mg of proteins), 125 mm Tris-HCl (pH 8.5), 2.1 mm EDTA, 0.146 mm l-cystathionine, 41.7 mm dl-Hcy, 0.316 mm S-adenosylmethionine, 2.1 mm propargylglycine, and 0.42 mm pyridoxal-5′-phosphate. The reaction was initiated by adding 30 mm [14C]serine (PerkinElmer Life Sciences) to the reaction mixture. After incubation for 1 h at 37 °C, ice-cold 15% trichloroacetic acid (300 μl) was added to stop the reaction. An aliquot of the reaction mixture was applied to a Bio-Rad AG 50W-X8 anion exchange column containing hydrogen-form resin. The column was washed with a series of water and 1 n HCl. Cystathionine was eluted with 3 n NH4OH. The radioactivity associated with cystathionine was determined by using a Beckman liquid scintillation counter.
Statistical Analysis
The results were analyzed by a two-tailed Student's t test or one-way analysis of variance followed by Newman-Keul's test. The data were presented as the means ± S.E. A p value of less than 0.05 was considered significant.
RESULTS
Decreased CBS mRNA and Protein Levels in Kidneys Subjected to Ischemia/Reperfusion
Kidney CBS mRNA was measured by a real time PCR analysis. The level of CBS mRNA was markedly reduced by ∼70% in kidneys subjected to ischemia/reperfusion as compared with the sham-operated group (Fig. 1A). To determine whether the reduction of CBS mRNA expression leads to a decrease in CBS protein level in the kidney, Western immunoblotting analysis was carried out. In accordance with mRNA expression, the level of CBS protein was significantly decreased in the kidney upon ischemia/reperfusion as compared with the sham-operated group (Fig. 1B). Kidney proximal tubular cells are more susceptible to ischemia/reperfusion-induced injury (16, 25, 26, 38). Induction of ischemia/reperfusion in cultured human tubular cells also caused a significant decrease in the expression of CBS mRNA (Fig. 1C). These results indicated that ischemia/reperfusion could result in a decrease in CBS gene levels in the kidney and in tubular cells.
FIGURE 1.
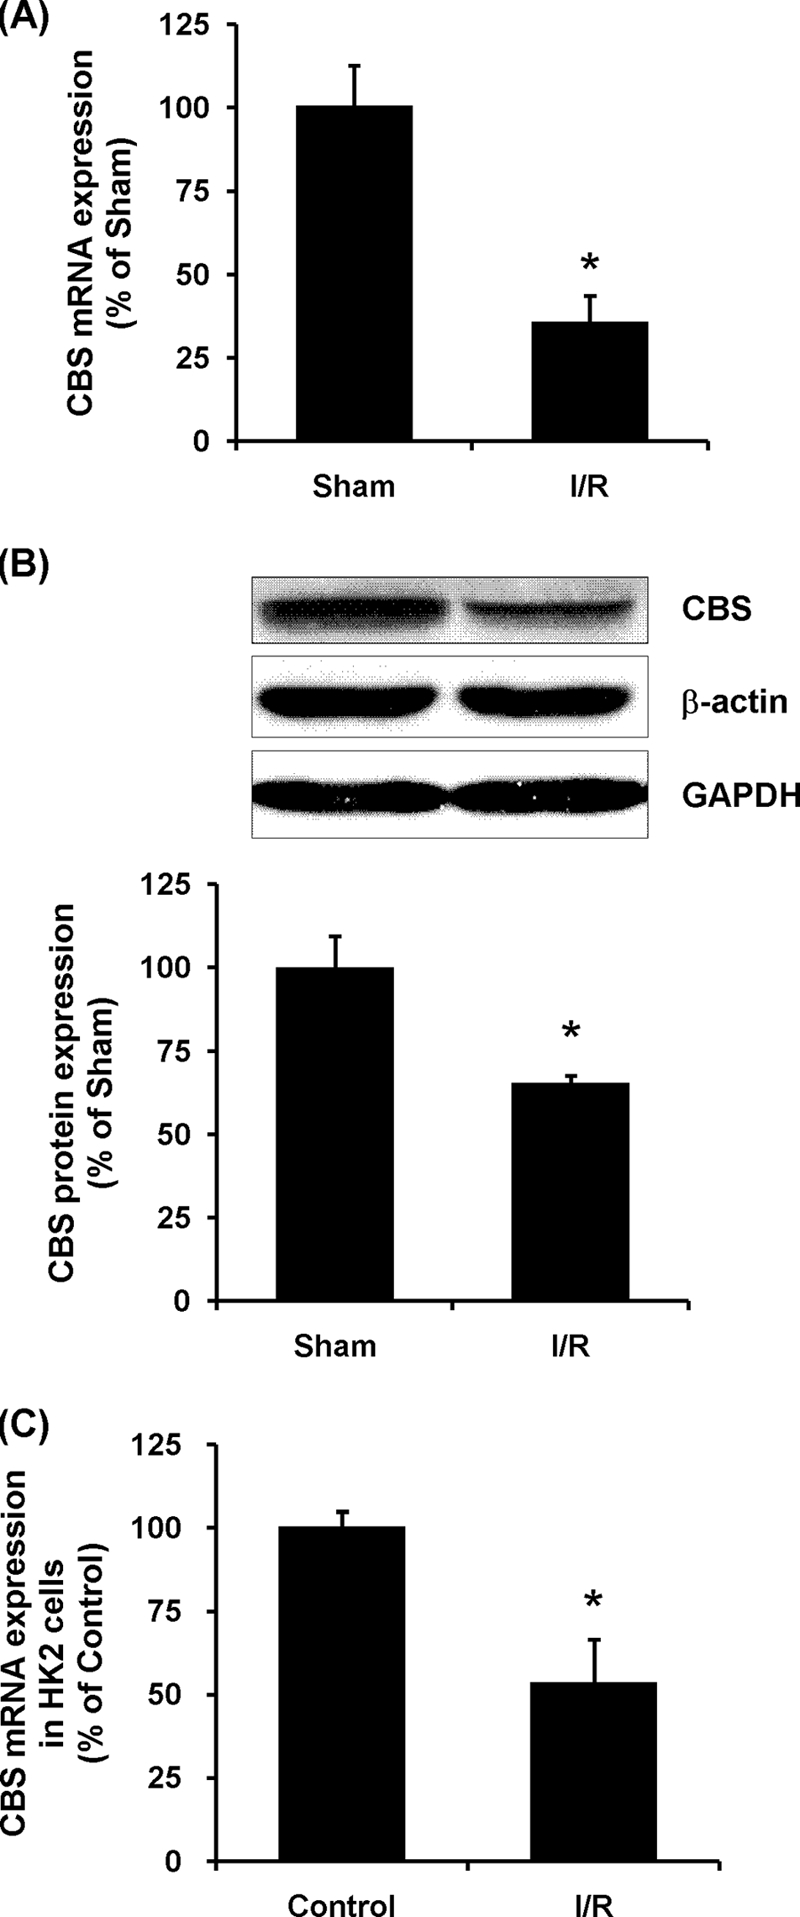
CBS mRNA and protein expression in the kidney. A, the left kidney was subjected to sham operation (Sham) or ischemia/reperfusion (I/R). CBS mRNA in the kidney tissue was determined by real time PCR assay. Crossing threshold values were normalized to GAPDH expression. B, CBS protein in kidney was determined by Western immunoblotting analysis. C, human proximal tubular epithelial cells (HK2) were subjected to ischemic conditions for 2 h followed by incubation in the maintenance medium for 6 h (I/R) as described under “Experimental Procedures.” CBS mRNA in control cells and in ischemia/reperfusion cells was determined by real time PCR assay. The results are expressed as the means ± S.E. from six separate experiments, each performed in duplicate. *, p < 0.05 when compared with the value obtained from sham-operated group (A and B) or when compared with the value obtained from control cells (C).
Transcriptional Regulation of CBS Expression by Sp1
To determine whether the reduction of the CBS mRNA level in the kidney upon ischemia/reperfusion was due to a change in the transcriptional regulation, nuclear proteins were prepared from the kidney tissue, and EMSA was performed. The protein level of total Sp1 in kidneys subjected to ischemia/reperfusion was similar to that in the sham-operated group (Fig. 2A). However, the binding activity of Sp1 to the 32P-labeled oligonucleotide containing a consensus sequence for the Sp1-binding site was significantly decreased in kidneys subjected to ischemia/reperfusion (Fig. 2B). To confirm the specificity of Sp1 binding to the 32P-labeled oligonucleotide, a 100-fold excess of unlabeled Sp1 consensus oligonucleotides was added to the nuclear extract. Unlabeled Sp1 consensus oligonucleotides, at an excessive amount, competed with 32P-labeled Sp1 probe, leading to an absence of 32P-labeled Sp1-DNA complex in the EMSA gel (Fig. 2B). Furthermore, to identify the proteins in the Sp1-DNA complex in the EMSA, a supershift assay was performed using either anti-Sp1 antibodies or anti-phosphoserine antibodies. Preincubation of nuclear proteins with anti-Sp1 antibodies but not anti-phosphoserine antibodies resulted in a slower migration of the protein-DNA complex (Fig. 2C). To further investigate whether ischemia/reperfusion affected the interaction of Sp1 with the CBS promoter, ChIP assay was performed (Fig. 2D). Quantitative real time PCR analysis revealed a significant decrease in the level of the CBS promoter region associated with Sp1 protein in kidneys subjected to ischemia/reperfusion as compared with the sham-operated group (Fig. 2D). These results suggested that a reduction of CBS expression in the kidney upon ischemia/reperfusion might be due to a decreased transcriptional regulation by Sp1.
FIGURE 2.

Effect of ischemia/reperfusion on Sp1 activation in the kidney. The left kidney was subjected to sham operation (Sham) or ischemia/reperfusion (I/R). A, the Sp1 protein level in the kidney tissue was determined by Western immunoblotting analysis. B, the DNA binding activity of Sp1 in the kidney tissue was determined by EMSA. The area of the Sp1-DNA bands in the EMSA gel was cut out according to the autoradiograph image, and the radioactivity corresponding to each band was measured using a liquid scintillation counter. The average radioactivity detected in the sham-operated group was 61,259 cpm and was expressed as 100%. C, nuclear proteins were incubated with anti-Sp1 antibodies (Sp1 Ab) or anti-phosphoserine antibodies (p-Ser Ab) for supershift assays. D, a schematic diagram shows the CBS promoter 5′-untranslated region. The bold letters indicate the potential binding sequences for Sp1. The transcription starting site of the rat CBS gene is indicated by an asterisk. ChIP assay was conducted in the kidney tissue. The expression of CBS promoter region associated with Sp1 was determined by real time PCR assay. As an internal control, an aliquot of sheared chromatin unincubated with antibodies was prepared (mock immunoprecipitation) to normalize the amount of total DNA subjected to ChIP assay. The results are expressed as the means ± S.E. from four separate experiments, each performed in duplicate. *, p < 0.05 when compared with the value obtained from the sham-operated group.
To further confirm a causative relationship between Sp1 activation and CBS expression, tubular cells were transiently transfected with Sp1 siRNA. Transfection of tubular cells with Sp1 siRNA resulted in a significant reduction of Sp1 mRNA and protein levels (Fig. 3, A and B). Inhibition of Sp1 activation using Sp1 siRNA also attenuated CBS gene and protein expression in those cells (Fig. 3, C and D). As a control, the cells were transfected with scrambled siRNA (negative control), which had no effect on Sp1 and CBS expression in tubular cells. Taken together, these results suggested that Sp1 might play a major role in regulating CBS expression in kidney cells.
FIGURE 3.

Effect of Sp1 siRNA transfection on CBS expression in proximal tubular cells. Human proximal tubular cells were transiently transfected with Sp1 siRNA or with a scramble siRNA (Negative control). Sp1 mRNA expression (A) and CBS mRNA expression (C) were determined by a real time PCR assay. Crossing threshold values were normalized to GAPDH expression. Sp1 protein expression (B) and CBS protein expression (D) were determined by Western immunoblotting analysis. The mRNA or protein expression in negative control cells (transfected with scrambled siRNA) was expressed as 100%. The results are expressed as the means ± S.E. from six separate experiments, each performed in duplicate. *, p < 0.05 when compared with the value obtained from the negative control.
Mechanisms of Reduced Sp1 Transcriptional Activity during Ischemia/Reperfusion
The binding of Sp1 to the promoter region and its transcriptional activity can be influenced by its phosphorylation status (39, 40). To investigate the potential mechanism underlying the reduction of Sp1 transcription activity in the kidney upon ischemia/reperfusion, the phosphorylation status of Sp1 in the kidney was examined. The protein level of total Sp1 in kidneys subjected to ischemia/reperfusion was similar to that in the sham-operated group (Fig. 2A). However, there was a significant increase in serine phosphorylation of Sp1 in kidneys subjected to ischemia/reperfusion (Fig. 4A). On the other hand, there was no significant change in Sp1 mRNA levels in the kidney upon ischemia/reperfusion (data not shown). To further confirm the role of Sp1 phosphorylation in Sp1 transcriptional activity during renal ischemia/reperfusion, Sp1-DNA binding activity was measured after nuclear protein was dephosphorylated by phosphatase. Pretreatment of nuclear protein with calf intestinal phosphatase significantly increased the Sp1-DNA binding activity in ischemia/reperfused kidney tissue (Fig. 4B). These results suggested that increased phosphorylation of Sp1 was responsible for its decreased transcriptional activity upon ischemia/reperfusion leading to a reduction of CBS expression in the kidney.
FIGURE 4.

Effect of ischemia/reperfusion on phosphorylation of Sp1 in the kidney. The left kidney was subjected to sham operation (Sham) or ischemia/reperfusion (I/R). A, Sp1 protein in the kidney tissue was immunoprecipitated (IP) using anti-Sp1 antibodies followed by Western immunoblotting (IB) analysis using anti-phosphoserine antibodies to detect serine-phosphorylated Sp1 protein. The total Sp1 protein in the immunoprecipitate was determined by Western immunoblotting analysis using polyclonal anti-Sp1 antibodies. Phosphorylated Sp1 protein level was normalized to the total Sp1 detected in the immunoprecipitate. B, dephosphorylation of Sp1 increased Sp1-DNA binding activity in ischemia/reperfusion. Nuclear proteins from ischemia/reperfused kidney tissue were incubated with or without calf intestinal phosphatase (CIP, 0.2 milliunits/μg of nuclear proteins). EMSA was performed to determine the Sp1-DNA binding activity. The area of the Sp1-DNA bands in the EMSA gel was cut out according to the autoradiograph image, and the radioactivity corresponding to each band was measured using a liquid scintillation counter. The average radioactivity detected in the sham-operated group was expressed as 100%. The results are expressed as the means ± S.E. from four separate experiments, each performed in duplicate. *, p < 0.05 when compared with the value obtained from the sham-operated group. #, p < 0.05 when compared with the value obtained from the ischemia/reperfusion group.
To investigate the mechanism of increased Sp1 phosphorylation in the kidney, the activation of ERK was examined by Western immunoblotting analysis. The levels of phospho-ERK1/2 were significantly elevated in ischemia/reperfused kidney (Fig. 5), indicating an activation of ERK signaling pathway in the kidney during ischemia/reperfusion injury. To confirm a causative relation between ERK signaling pathway and increased Sp1 phosphorylation, kidney tubular cells were preincubated with an ERK inhibitor (PD98059) followed by ischemia/reperfusion. Prevention of Sp1 phosphorylation by ERK inhibitor effectively restored the Sp1-DNA binding activity and CBS expression (Fig. 6). These results suggested that activation of the ERK signaling pathway might play a regulatory role in Sp1 phosphorylation during ischemia/reperfusion, leading to reduced transcriptional activation of CBS expression in the kidney.
FIGURE 5.

Effect of ischemia/reperfusion on ERK activation in the kidney. The left kidney was subjected to sham operation (Sham) or ischemia/reperfusion (I/R). Phosphorylated ERK1/2 protein (p-ERK) and total ERK1/2 protein in the kidney were determined by Western immunoblotting analysis. The results are expressed as the means ± S.E. from four separate experiments, each performed in duplicate. *, p < 0.05 when compared with the value obtained from the sham-operated group.
FIGURE 6.
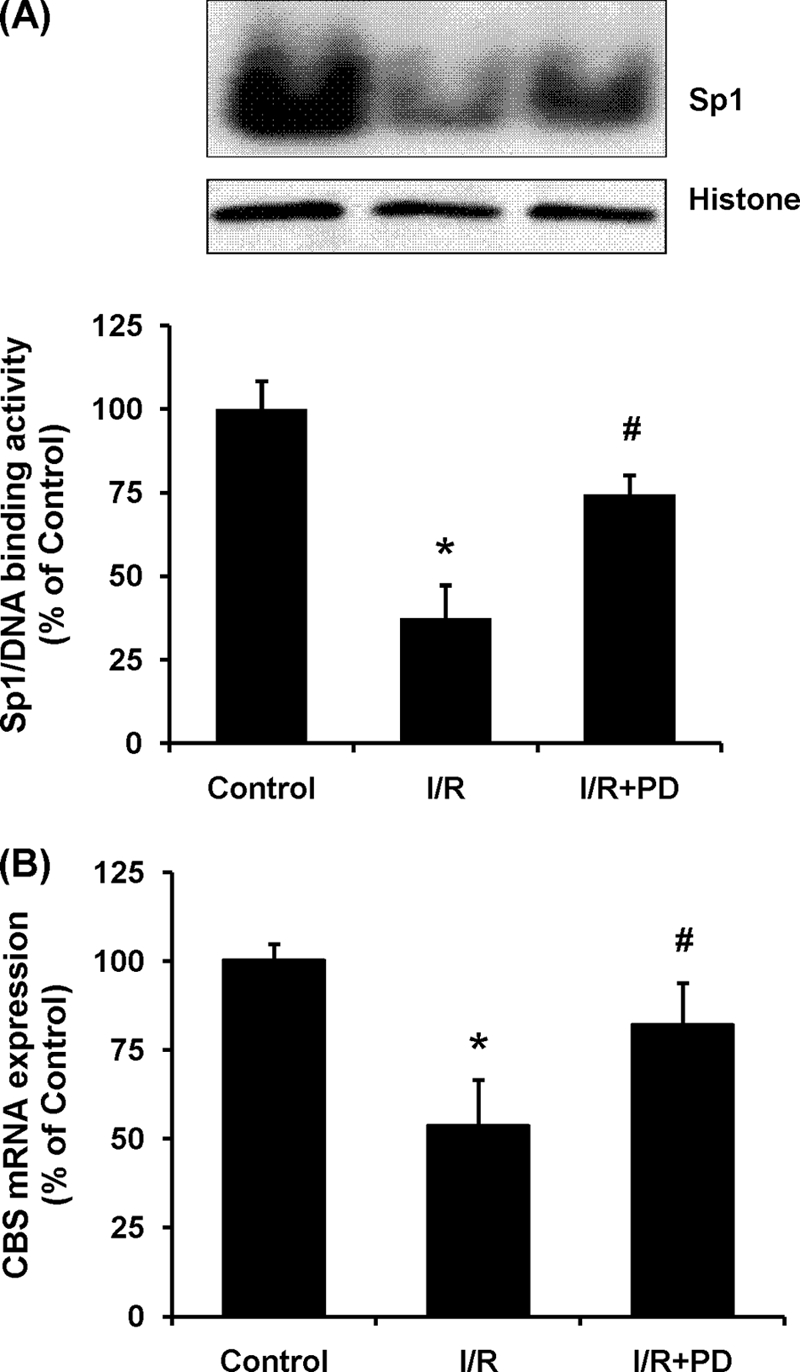
Effect of ERK inhibitor on Sp1 activation and CBS expression in proximal tubular cells. A, human proximal tubular epithelial cells (HK2) were pretreated with 10 μm ERK inhibitor, PD98059, for 30 min and then subjected to ischemic condition for 2 h followed by incubation in the maintenance medium for 6 h (I/R) in the presence of PD98059 (I/R+PD). Sp1-DNA binding activity was determined by EMSA. The area of the Sp1-DNA bands in the EMSA gel was cut out according to the autoradiograph image, and the radioactivity corresponding to each band was measured using a liquid scintillation counter. The average radioactivity detected in the sham-operated group was expressed as 100%. B, CBS mRNA expression in ischemia/reperfused cells with or without PD98059 treatment was determined by real time PCR assay. Crossing threshold values were normalized to GAPDH expression. The results are expressed as the means ± S.E. from four separate experiments, each performed in duplicate. *, p < 0.05 when compared with the value obtained from control cells. #, p < 0.05 when compared with the value obtained from cells subjected to ischemia/reperfusion.
Effect of Ischemia/Reperfusion on CBS-mediated Hcy and H2S Metabolism
The CBS activity was determined in kidneys isolated from the ischemia/reperfusion group and the sham-operated group. There was a significant decrease in the CBS activity in kidneys subjected to ischemia/reperfusion (Fig. 7A). This was accompanied by an elevation of Hcy levels (Fig. 7B) and a reduction of H2S levels (Fig. 7C) in the kidney tissue. Apart from CBS, another enzyme, namely cystathionine γ-lyase, is also responsible for the synthesis of endogenous H2S in mammalian cells. The activity of cystathionine γ-lyase was not significantly changed in the kidney upon ischemia/reperfusion (16). These results suggested that imbalanced Hcy and H2S homeostasis in the kidney during ischemia/reperfusion was mainly caused by a significant reduction of CBS activity. There was a significant increase in the plasma creatinine level in rats that were subjected to kidney ischemia/reperfusion (0.42 ± 0.0212 mg/dl in ischemia/reperfusion group versus 0.12 ± 0.0036 mg/dl in sham group), indicating that kidney function was impaired by ischemia/reperfusion.
FIGURE 7.
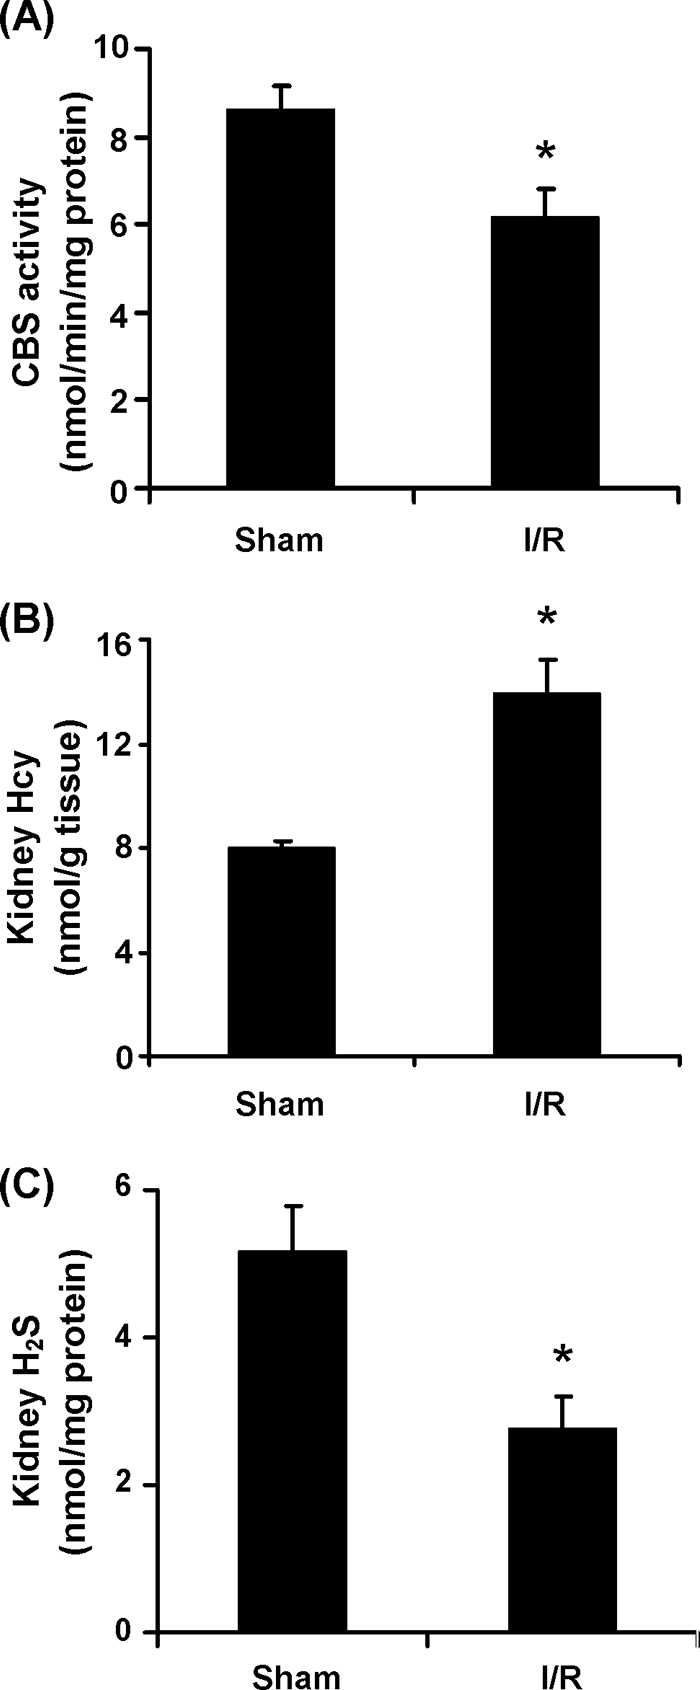
Effect of ischemia/reperfusion on CBS activity, Hcy, and H2S levels in the kidney. The left kidney was subjected to sham operation (Sham) or ischemia/reperfusion (I/R). A, the CBS activity in the kidney tissue was determined. B and C, the levels of Hcy (B) and H2S (C) in the kidney tissue were measured. The results are expressed as the means ± S.E. from six separate experiments, each performed in duplicate. *, p < 0.05 when compared with the value obtained from the sham-operated group.
DISCUSSION
CBS plays an important role in maintaining the homeostasis of Hcy and H2S in our bodies. Perturbations of CBS activity can lead to an imbalance in Hcy and H2S metabolism. The results obtained from the present study have identified a novel mechanism by which CBS is regulated in the kidney during ischemia/reperfusion. Sp1 is found to play an important role in the transcriptional regulation of CBS gene expression in the kidney. Increased phosphorylation of Sp1 is mediated via ERK, which in turn contributes to a reduced DNA binding activity of Sp1 and subsequently a decrease in the CBS gene expression. As a consequence, there is a significant decrease in CBS enzyme activity, causing an elevation of the Hcy level and a decline of the H2S level in the kidney.
The CBS activity is tightly regulated at the transcriptional (20, 21) and post-translational (41) levels. In the present study, upon ischemia/reperfusion, both the CBS mRNA and protein levels in the kidney were significantly decreased. A reduction of CBS expression was also detected in kidney proximal tubular cells. Several lines of evidence suggested that Sp1 was directly involved in the down-regulation of CBS gene expression in the kidney. First, the EMSA demonstrated that the DNA binding activity of Sp1 was markedly reduced in the kidney upon ischemia/reperfusion. Second, results from the chromatin immunoprecipitation assay revealed a significant decrease in the binding of Sp1 to the promoter region of CBS gene in the kidney subjected to ischemia/reperfusion. Third, the role of Sp1 in the transcriptional regulation of CBS gene expression was further investigated in tubular cells that were transiently transfected with Sp1 siRNA. Inhibition of Sp1 activation caused a marked reduction of CBS gene expression in those cells. Although a few transcriptional factors, such as Sp1, Sp3, nuclear factor Y, and upstream stimulatory factor 1, have been suggested to regulate the expression of the human CBS gene (20), only two homologous Sp1 sites have been identified in the promoter region of the rodent CBS gene (23). Currently, little information is available regarding the regulation of CBS expression in rats. The results from the present study suggested that Sp1 played an important role in regulating CBS gene expression in the rat kidney. Decreased transcriptional activity of Sp1 upon ischemia/reperfusion led to a significant reduction of CBS expression in the kidney.
Sp1 is a ubiquitously expressed 778-amino acid transcription factor that recognizes the GC-rich sequences in the promoters of eukaryotic genes (42). As shown in the present study, the critical and indispensable role of Sp1 in the regulation of rat CBS expression in the kidney is in agreement with its role in regulating human CBS expression in other tissues or cells reported in previous studies (20, 22, 43). Post-translational modifications, such as phosphorylation and glycosylation, have been indicated as important mechanisms in the regulation of Sp1 binding to the promoter regions of targeted genes (44, 45). Sp1 protein can be phosphorylated at various sites leading to changes in the DNA binding and its transcriptional activity (40, 45–47). Human Sp1 has 61 putative phosphorylation sites, with 48 of these residues being serine, 10 threonine, and 3 tyrosine (45). Serine residues in human and rodent Sp1 proteins have been shown to be the most common sites for phosphorylation (42, 48). It has been shown in the liver, hepatoma cells, and lymphocytes that increased phosphorylation of Sp1 leads to a decrease in the Sp1-DNA binding activity and a reduction of the transcriptional activity (40, 46, 47). However, increased phosphorylation of Sp1 may not always lead to a decrease in its transcriptional activity. It has been reported that Sp1 phosphorylation causes an increase in the Sp1-DNA binding activity in rat endothelial cells (49). Therefore, regulation of Sp1-DNA binding and transcriptional activity by phosphorylation may be tissue- and cell-specific. To examine whether ischemia/reperfusion altered the phosphorylation status of Sp1 in the kidney, we performed an immunoprecipitation with anti-Sp1 antibodies followed by Western immunoblotting analysis with anti-phosphoserine antibodies. Serine-phosphorylation of Sp1 was significantly increased in the kidney subjected to ischemia/reperfusion. It has been reported that phosphorylation of Sp1 can be achieved through MAP kinase pathways such as ERK, c-Jun N-terminal kinase (JNK), or p38 in different types of cells and in various disease models (50–52). However, which MAP kinase pathway is involved in the phosphorylation of Sp1 remains elusive. In the present study, the ERK activity was markedly elevated in the kidney subjected to ischemia/reperfusion. Treatment of tubular cells with PD98059, an inhibitor that prevents ERK activation, not only restored ischemia/reperfusion-impaired Sp1-DNA binding activity but also corrected CBS expression in those cells. Taken together, these results suggested that an increased ERK-mediated phosphorylation in Sp1 might represent one of the mechanisms that account for a reduction of Sp1-DNA binding activity and subsequently a decrease in CBS expression in the kidney upon ischemia/reperfusion.
CBS is a pyridoxal-5′-phosphate-dependent enzyme in which heme is a cofactor associated with its N-terminal domain (17). Heme acts as a redox sensor to regulate CBS activity, and changes in the redox status of heme can affect CBS activity (41, 53). From acidic to physiological pH, heme in the CBS is in the ferric form, whereas at alkaline pH, heme is in the ferrous form, which predominates in the more active form of CBS (54). We have detected a higher CBS activity in the kidney tissue with pH levels ranging from 7.5 to 9.0, and the optimum enzyme activity was at pH 8.5 (26). The pH is decreased in the kidney during the ischemia period because of metabolic acidosis, which in turn causes a significant reduction of CBS activity (26). Correction of pH by an alkaline solution could partially restore the CBS activity and reduce cell death (26). Apart from ischemia-induced acidosis, there is a marked increase in NO production in the kidney during the reperfusion period (26). Nitric oxide can interact with the heme in the CBS especially under alkaline conditions, causing an inhibition of CBS activity (26, 55). In a previous study, we have found that during the reperfusion period, the pH in the kidney increases, thus rendering the CBS more susceptible to nitric oxide inhibition (26). Administration of nitric oxide scavenger partially restores the CBS activity and hence reduces Hcy levels (26) and increases H2S levels (16) in the kidney. However, correction of tissue pH and scavenging of excess nitric oxide are unable to fully restore ischemia/reperfusion impaired CBS activity (26). These results indicate that additional mechanism(s) might be involved in the regulation of CBS activity in the kidney. The results obtained from the present study unveiled that reduced CBS gene expression might constitute an important molecular mechanism responsible for the reduction of CBS activity in the kidney upon ischemia/reperfusion, which in turn led to an accumulation of Hcy and a reduction of H2S in the kidney (16, 25, 26).
In summary, the present study, for the first time, has identified a novel mechanism accounting for a reduced CBS expression in the kidney during ischemia/reperfusion. Increased Sp1 phosphorylation via ERK activation resulted in a decreased Sp1 transcriptional regulation of CBS gene expression in the kidney upon ischemia/reperfusion. As a consequence, the CBS-mediated Hcy and H2S metabolism is impaired, leading to a significant increase in the Hcy level and a marked decrease in the H2S level in the kidney. Such an imbalance in Hcy and H2S homeostasis contributes to ischemia/reperfusion-induced kidney injury. Better understanding the unique pathways that regulate CBS activity will help preserve the function of this enzyme in balancing Hcy and H2S homeostasis in the kidney.
This work was supported by the Natural Sciences and Engineering Research Council of Canada and the St. Boniface Hospital & Research Foundation.
- Hcy
- homocysteine
- CBS
- cystathionine β-synthase
- ChIP
- chromatin immunoprecipitation assay
- EMSA
- electrophoretic mobility shift assay
- GAPDH
- glyceraldehyde-3-phosphate dehydrogenase
- siRNA
- small interfering RNA
- ERK
- extracellular signal-regulated kinase
- MAP
- mitogen-activated protein kinase.
REFERENCES
- 1.Eto K., Kimura H. (2002) J. Biol. Chem. 277, 42680–42685 [DOI] [PubMed] [Google Scholar]
- 2.Wang L., Jhee K. H., Hua X., DiBello P. M., Jacobsen D. W., Kruger W. D. (2004) Circ. Res. 94, 1318–1324 [DOI] [PubMed] [Google Scholar]
- 3.Lentz S. R. (2005) J. Thromb. Haemost. 3, 1646–1654 [DOI] [PubMed] [Google Scholar]
- 4.Refsum H., Ueland P. M., Nygård O., Vollset S. E. (1998) Annu. Rev. Med. 49, 31–62 [DOI] [PubMed] [Google Scholar]
- 5.Wald D. S., Law M., Morris J. K. (2002) BMJ 325, 1202. [DOI] [PMC free article] [PubMed] [Google Scholar]
- 6.Distrutti E., Mencarelli A., Santucci L., Renga B., Orlandi S., Donini A., Shah V., Fiorucci S. (2008) Hepatology 47, 659–667 [DOI] [PubMed] [Google Scholar]
- 7.Yi F., Li P. L. (2008) Am. J. Nephrol. 28, 254–264 [DOI] [PMC free article] [PubMed] [Google Scholar]
- 8.House J. D., Brosnan M. E., Brosnan J. T. (1997) Biochem. J. 328, 287–292 [DOI] [PMC free article] [PubMed] [Google Scholar]
- 9.Francis M. E., Eggers P. W., Hostetter T. H., Briggs J. P. (2004) Kidney Int. 66, 303–312 [DOI] [PubMed] [Google Scholar]
- 10.Singh S., Padovani D., Leslie R. A., Chiku T., Banerjee R. (2009) J. Biol. Chem. 284, 22457–22466 [DOI] [PMC free article] [PubMed] [Google Scholar]
- 11.Chen X., Jhee K. H., Kruger W. D. (2004) J. Biol. Chem. 279, 52082–52086 [DOI] [PubMed] [Google Scholar]
- 12.Moore P. K., Bhatia M., Moochhala S. (2003) Trends Pharmacol. Sci. 24, 609–611 [DOI] [PubMed] [Google Scholar]
- 13.Elrod J. W., Calvert J. W., Morrison J., Doeller J. E., Kraus D. W., Tao L., Jiao X., Scalia R., Kiss L., Szabo C., Kimura H., Chow C. W., Lefer D. J. (2007) Proc. Natl. Acad. Sci. U.S.A. 104, 15560–15565 [DOI] [PMC free article] [PubMed] [Google Scholar]
- 14.Eto K., Asada T., Arima K., Makifuchi T., Kimura H. (2002) Biochem. Biophys. Res. Commun. 293, 1485–1488 [DOI] [PubMed] [Google Scholar]
- 15.Wang Y., Zhao X., Jin H., Wei H., Li W., Bu D., Tang X., Ren Y., Tang C., Du J. (2009) Arterioscler. Thromb. Vasc. Biol. 29, 173–179 [DOI] [PubMed] [Google Scholar]
- 16.Xu Z., Prathapasinghe G., Wu N., Hwang S. Y., Siow Y. L., O K. (2009) Am. J. Physiol. Renal Physiol. 297, F27–F35 [DOI] [PubMed] [Google Scholar]
- 17.Meier M., Janosik M., Kery V., Kraus J. P., Burkhard P. (2001) EMBO J. 20, 3910–3916 [DOI] [PMC free article] [PubMed] [Google Scholar]
- 18.Kraus J. P., Oliveriusová J., Sokolová J., Kraus E., Vlcek C., de Franchis R., Maclean K. N., Bao L., Bukovsk, Patterson D., Paces V., Ansorge W., Kozich V. (1998) Genomics 52, 312–324 [DOI] [PubMed] [Google Scholar]
- 19.Bao L., Vlcek C., Paces V., Kraus J. P. (1998) Arch. Biochem. Biophys. 350, 95–103 [DOI] [PubMed] [Google Scholar]
- 20.Ge Y., Matherly L. H., Taub J. W. (2001) J. Biol. Chem. 276, 43570–43579 [DOI] [PubMed] [Google Scholar]
- 21.Ge Y., Konrad M. A., Matherly L. H., Taub J. W. (2001) Biochem. J. 357, 97–105 [DOI] [PMC free article] [PubMed] [Google Scholar]
- 22.Maclean K. N., Kraus E., Kraus J. P. (2004) J. Biol. Chem. 279, 8558–8566 [DOI] [PubMed] [Google Scholar]
- 23.Roper M. D., Straubhaar J. R., Kraus E., Sokolová J., Hrebícek M., Kraus J. P. (1996) Mamm. Genome 7, 754–757 [DOI] [PubMed] [Google Scholar]
- 24.Friedman A. N., Bostom A. G., Selhub J., Levey A. S., Rosenberg I. H. (2001) J. Am. Soc. Nephrol. 12, 2181–2189 [DOI] [PubMed] [Google Scholar]
- 25.Prathapasinghe G. A., Siow Y. L., O K. (2007) Am. J. Physiol. Renal Physiol. 292, F1354–F1363 [DOI] [PubMed] [Google Scholar]
- 26.Prathapasinghe G. A., Siow Y. L., Xu Z., O K. (2008) Am. J. Physiol. Renal Physiol. 295, F912–F922 [DOI] [PubMed] [Google Scholar]
- 27.Zhu T., Au-Yeung K. K., Siow Y. L., Wang G., O K. (2002) Clin. Exp. Pharmacol. Physiol. 29, 852–854 [DOI] [PubMed] [Google Scholar]
- 28.Au-Yeung K. K., Woo C. W., Sung F. L., Yip J. C., Siow Y. L., O K. (2004) Circ. Res. 94, 28–36 [DOI] [PubMed] [Google Scholar]
- 29.Woo C. W., Prathapasinghe G. A., Siow Y. L., O K. (2006) Biochim. Biophys. Acta 1762, 656–665 [DOI] [PubMed] [Google Scholar]
- 30.Woo C. W., Siow Y. L., O K. (2008) J. Biol. Chem. 283, 1282–1292 [DOI] [PubMed] [Google Scholar]
- 31.Stipanuk M. H., Beck P. W. (1982) Biochem. J. 206, 267–277 [DOI] [PMC free article] [PubMed] [Google Scholar]
- 32.Mockridge J. W., Marber M. S., Heads R. J. (2000) Biochem. Biophys. Res. Commun. 270, 947–952 [DOI] [PubMed] [Google Scholar]
- 33.Deng W., Rosenberg P. A., Volpe J. J., Jensen F. E. (2003) Proc. Natl. Acad. Sci. U.S.A. 100, 6801–6806 [DOI] [PMC free article] [PubMed] [Google Scholar]
- 34.Woo C. W., Siow Y. L., Pierce G. N., Choy P. C., Minuk G. Y., Mymin D., O K. (2005) Am. J. Physiol. Endocrinol. Metab. 288, E1002–E1010 [DOI] [PubMed] [Google Scholar]
- 35.Woo C. W., Siow Y. L., O K. (2006) Arterioscler. Thromb. Vasc. Biol. 26, 1043–1050 [DOI] [PubMed] [Google Scholar]
- 36.Nelson J. D., Denisenko O., Bomsztyk K. (2006) Nat. Protoc. 1, 179–185 [DOI] [PubMed] [Google Scholar]
- 37.Kavurma M. M., Santiago F. S., Bonfoco E., Khachigian L. M. (2001) J. Biol. Chem. 276, 4964–4971 [DOI] [PubMed] [Google Scholar]
- 38.Weinberg J. M. (1991) Kidney Int. 39, 476–500 [DOI] [PubMed] [Google Scholar]
- 39.Daniel S., Zhang S., DePaoli-Roach A. A., Kim K. H. (1996) J. Biol. Chem. 271, 14692–14697 [DOI] [PubMed] [Google Scholar]
- 40.Lacroix I., Lipcey C., Imbert J., Kahn-Perlès B. (2002) J. Biol. Chem. 277, 9598–9605 [DOI] [PubMed] [Google Scholar]
- 41.Zou C. G., Banerjee R. (2003) J. Biol. Chem. 278, 16802–16808 [DOI] [PubMed] [Google Scholar]
- 42.Black A. R., Jensen D., Lin S. Y., Azizkhan J. C. (1999) J. Biol. Chem. 274, 1207–1215 [DOI] [PubMed] [Google Scholar]
- 43.Maclean K. N., Janosík M., Kraus E., Kozich V., Allen R. H., Raab B. K., Kraus J. P. (2002) J. Cell. Physiol. 192, 81–92 [DOI] [PubMed] [Google Scholar]
- 44.Majumdar G., Harrington A., Hungerford J., Martinez-Hernandez A., Gerling I. C., Raghow R., Solomon S. (2006) J. Biol. Chem. 281, 3642–3650 [DOI] [PubMed] [Google Scholar]
- 45.Tan N. Y., Khachigian L. M. (2009) Mol. Cell. Biol. 29, 2483–2488 [DOI] [PMC free article] [PubMed] [Google Scholar]
- 46.Leggett R. W., Armstrong S. A., Barry D., Mueller C. R. (1995) J. Biol. Chem. 270, 25879–25884 [DOI] [PubMed] [Google Scholar]
- 47.Armstrong S. A., Barry D. A., Leggett R. W., Mueller C. R. (1997) J. Biol. Chem. 272, 13489–13495 [DOI] [PubMed] [Google Scholar]
- 48.Liao M., Zhang Y., Dufau M. L. (2008) Mol. Endocrinol. 22, 1449–1463 [DOI] [PMC free article] [PubMed] [Google Scholar]
- 49.Yun S., Dardik A., Haga M., Yamashita A., Yamaguchi S., Koh Y., Madri J. A., Sumpio B. E. (2002) J. Biol. Chem. 277, 34808–34814 [DOI] [PubMed] [Google Scholar]
- 50.Milanini-Mongiat J., Pouysségur J., Pagès G. (2002) J. Biol. Chem. 277, 20631–20639 [DOI] [PubMed] [Google Scholar]
- 51.Benasciutti E., Pagès G., Kenzior O., Folk W., Blasi F., Crippa M. P. (2004) Blood 104, 256–262 [DOI] [PubMed] [Google Scholar]
- 52.Xu K., Shu H. K. (2007) Cancer Res. 67, 6121–6129 [DOI] [PubMed] [Google Scholar]
- 53.Taoka S., Ohja S., Shan X., Kruger W. D., Banerjee R. (1998) J. Biol. Chem. 273, 25179–25184 [DOI] [PubMed] [Google Scholar]
- 54.Pazicni S., Lukat-Rodgers G. S., Oliveriusová J., Rees K. A., Parks R. B., Clark R. W., Rodgers K. R., Kraus J. P., Burstyn J. N. (2004) Biochemistry 43, 14684–14695 [DOI] [PubMed] [Google Scholar]
- 55.Taoka S., Banerjee R. (2001) J. Inorg. Biochem. 87, 245–251 [DOI] [PubMed] [Google Scholar]