Abstract
The pathogenesis and treatment of nonalcoholic steatohepatitis (NASH) are not well established. Feeding a diet deficient in both methionine and choline (MCD) is one of the most common models of NASH, which is characterized by steatosis, mitochondrial dysfunction, hepatocellular injury, oxidative stress, inflammation, and fibrosis. However, the individual contribution of the lack of methionine and choline in liver steatosis, advanced pathology and impact on mitochondrial S-adenosyl-l-methionine (SAM) and glutathione (GSH), known regulators of disease progression, has not been specifically addressed. Here, we examined the regulation of mitochondrial SAM and GSH and signs of disease in mice fed a MCD, methionine-deficient (MD), or choline-deficient (CD) diet. The MD diet reproduced most of the deleterious effects of MCD feeding, including weight loss, hepatocellular injury, oxidative stress, inflammation, and fibrosis, whereas CD feeding was mainly responsible for steatosis, characterized by triglycerides and free fatty acids accumulation. These findings were preceded by MCD- or MD-mediated SAM and GSH depletion in mitochondria due to decreased mitochondrial membrane fluidity associated with a lower phosphatidylcholine/phosphatidylethanolamine ratio. MCD and MD but not CD feeding resulted in increased ceramide levels by acid sphingomyelinase. Moreover, GSH ethyl ester or SAM therapy restored mitochondrial GSH and ameliorated hepatocellular injury in mice fed a MCD or MD diet. Thus, the depletion of SAM and GSH in mitochondria is an early event in the MCD model of NASH, which is determined by the lack of methionine. Moreover, therapy using permeable GSH prodrugs may be of relevance in NASH.
Keywords: Cell Death, Glutathione, Hepatocyte, Homocysteine, Liver Injury, Liver Metabolism, Membrane Biophysics, Methionine, Sphingolipid, Nonalcoholic Steatohepatitis
Introduction
Nonalcoholic fatty liver disease is one of the most common forms of liver dysfunction in Western countries whose incidence is on the rise because of its association with obesity (1). Nonalcoholic fatty liver disease encompasses a spectrum of hepatic alterations that begins with steatosis, which can further progress to more advanced states such as nonalcoholic steatohepatitis (NASH),4 cirrhosis, and hepatocellular carcinoma (2, 3). The development of genetic and nutritional models have extensively expanded our knowledge of the underlying molecular mechanisms of the disease, which include oxidative stress, mitochondrial dysfunction, cytokine overexpression, impaired insulin signaling, ER stress or unfolded protein response (2–9). However, the pathogenesis of NASH in the context of the two-hit hypothesis (10) remains still incompletely known, in particular, the mechanisms promoting the transition from simple steatosis to NASH.
The nutritional model of feeding a diet deficient in both methionine and choline (MCD) is one of the most common in NASH research, and it is characterized by macrovesicular steatosis, hepatocellular death, inflammation, oxidative stress, and fibrosis. The onset of these disease signs is determined by the lack of methionine and choline. Whereas choline is essential in the de novo synthesis of phosphatidylcholine (PC), needed for the export of triglycerides (TG) out of hepatocytes via very low density lipoproteins packaging (11), methionine is an essential amino acid that plays a key role in many cellular functions because it is used for protein synthesis and as an intermediate in S-adenosylmethionine (SAM, also called AdoMet) and glutathione (GSH) synthesis, two important metabolites in cellular homeostasis and hepatocyte function (12, 13). Moreover, SAM is an essential precursor for polyamines and a critical methyl donor, thereby regulating key cellular constituents and signaling pathways (12, 14).
Most studies with the MCD diet model to induce NASH used diets supplemented with methionine and choline as controls (15–17). With the exception of a few reports that compared the MCD diet with the choline-deficient (CD) diet (18) or MCD diet supplemented with methionine (19, 20), to the best of our knowledge no reports have evaluated side by side the individual contribution of methionine and choline deficiency in the disease progression of the MCD model. In addition to assessing the specific contribution of methionine and choline in the pathology of the MCD model, and because mitochondrial dysfunction is considered a critical factor in NASH, we examined the effect of methionine and choline deficiency on mitochondrial SAM and GSH stores, which are known to be critical in the maintenance of mitochondrial function and hepatocellular survival (21, 22). Our data show that whereas the lack of choline contributes to the macrovesicular steatosis seen in MCD characterized by TG and free fatty acids, the absence of methionine reproduces the characteristic features of NASH induced by MCD such as hepatocellular injury, inflammation, oxidative stress, and fibrosis due to the limitation of SAM and GSH in mitochondria. Mitochondrial GSH depletion is accompanied by membrane fluidity loss associated with decreased PC/PE ratio. In addition, the MCD or MD but not CD diet increases ceramide levels by acid sphingomyelinase. Importantly, we show that these deleterious effects are prevented by mitochondrial GSH restoration with GSH ethyl ester (GSH-EE) or SAM but not with N-acetylcysteine (CysNAc).
EXPERIMENTAL PROCEDURES
Materials and Diets
GSH, GSSG, GSH-EE, PC, PE, TMA-DPH, SAM, and SAH were purchased from Sigma. Ceramide standards were from Biomol, and NBD-C6 sphingomyelin was from Molecular Probes (Invitrogen). Other reagents were of analytical grade. The Baker amino acid diet (catalogue no. 44181; TestDiet, Richmond, IN) was used as control diet from which methionine, choline, or both were omitted (custom-made) to assess the specific contribution of these essential nutritional components. The daily intake of the different diets, MCD, MD, or CD, was comparable (110–120 mg/g of body weight per day).
C57BL/6 strain male mice from Charles River (8 weeks old) were used and fed with a MCD, MD, or CD diet from 1 to 15 days. Animals had unrestricted access to food and water and were housed in temperature- and humidity-controlled rooms and kept on a 12-h light/dark cycle. Before sacrifice, some animals received an intraperitoneal injection of GSH-EE (1.25 mmol/kg twice a day), SAM (p-toluenesulfonate form, 5 mg/mouse), or CysNAc (5 mg/mouse). Heart blood samples were collected for AST/ALT determinations. All animal studies were approved by the Health Service Animal Care and Ethics Committee of the University of Barcelona and conformed to the highest international standards of humane care of animals in biomedical research.
Isolation of Mitochondria
A rapid centrifugation through Percoll density gradient was used to prepare liver mitochondria as described previously (6, 23). Mitochondrial enrichment was ascertained by the specific activity of succinic dehydrogenase, whereas contamination with ER, plasma membrane, early or recycling endosomes was evaluated by the levels of Bip/GRP78, Na+/K+ATPase α1, Rab5A, and Rab11, respectively. In addition, acid phosphatase activity monitored the contamination with lysosomes. Mitochondrial integrity was determined by the acceptor control ratio as the ADP-stimulated oxygen consumption over its absence using a Clark oxygen electrode with glutamate/malate or succinate as substrates for respiratory sites for complexes I or II.
Hematoxylin and Eosin, Myeloperoxidase (MPO), Oil Red, Filipin, and Sirius Red Staining
Liver samples from the various nutritional groups were processed for histology, oil red, MPO, Sirius red, and filipin staining for the qualitative assessment of neutral fat deposition, inflammation, fibrosis, and free cholesterol, respectively, as described previously (24). In some cases, mice were fed a hypercholesterolemic diet, and liver samples were processed for filipin staining and free cholesterol determination by HPLC.
Acidic and Neutral Sphingomyelinase Activity Measurement
Acidic (ASMase) and neutral (NSMase) sphingomyelinases were determined from liver extracts from mice fed a MCD, MD, or CD diet as described before (25) using a fluorescent sphingomyelin analog (NBD C6-sphingomyelin) (26). Samples were incubated for 1 h 30 min for ASMase and 2 h for NSMase at 37 °C in incubation buffer containing 10 μmol/liter NBD C6-sphingomyelin (250 mmol/liter sodium acetate, 0.1% Triton X-100, pH 5.0, for ASMase analysis, and 10 mmol/liter HEPES, 1 mmol/liter MgCl2, 0.2% Triton X-100 for NSMase). Lipids were extracted, dried in a speed vacuum, and separated by TLC (chloroform, methanol, 20% NH4OH; 70:30:5, v/v). NBD-ceramide was visualized under UV light, and images were acquired using a Gel DocXR System (Bio-Rad) with J free software.
Ceramide Determination
To determine the effect of diet intake on intracellular levels of ceramide, lipid was extracted and assayed using HPLC as described previously (25, 27), with some modifications. Briefly, cellular lipids were extracted with methanol and chloroform (1:2, v/v). The extracts were dried and resuspended in 250 μl of 1 m KOH in methanol and incubated at 100 °C for 1 h. After the samples had cooled to room temperature, 500 μl of chloroform and 250 μl of phosphate-buffered saline were added. The free long chain bases were recovered in the chloroform phase, washed, and dried.
Lipids were dissolved in 50 μl of methanol and then mixed with 50 μl of o-phthalaldehyde reagent, which was prepared fresh daily by mixing 10 ml of 3% (w/v) boric acid in water (pH adjusted to 10.5 with KOH) and 100 μl of ethanol containing 5 mg of o-phthalaldehyde and 50 μl of 2-mercaptoethanol. After incubation of 30 min at room temperature in the dark, 200 μl of methanol and 5 mm potassium phosphate (pH 7.0) (90:10, v/v) was added, and samples were centrifuged and analyzed by HPLC in a reverse-phase C18 column (waters) using a Gilson fluorometric detector with an excitation wavelength of 340 nm and an emission wavelength of 455 nm or 418 nm cutoff filter, respectively.
Statistical Analyses
Experiments were performed routinely with at least four to six animals per group. Statistical comparison of the mean values was performed using Student's t test for unpaired data.
Additional Methods
The supplemental Methods describe the procedures for the measurement of reactive oxygen species and GSH; mitochondrial order parameter; total and free cholesterol; PC and PE determination, and SAM and SAH analyses. See also the supplemental Discussion.
RESULTS
Mice Fed MCD and MD Diets but Not CD Diet Exhibit Weight Loss and Hepatocellular Injury
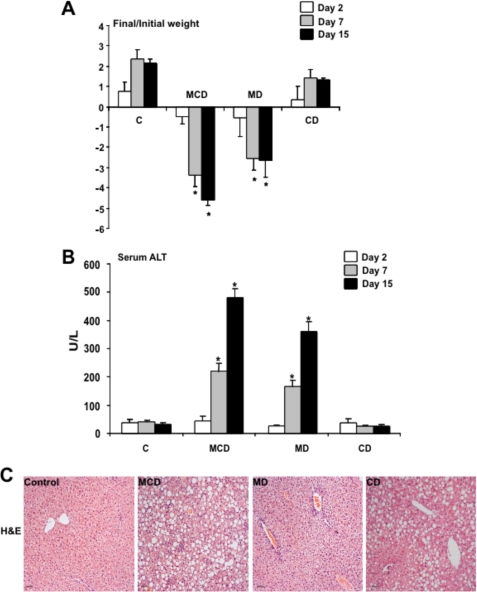
The nutritional model of NASH induced by MCD diet feeding is characterized by hepatocellular injury and weight loss in addition to inflammation, oxidative stress, and fibrosis. We first examined the individual contribution of methionine or choline deficiency on the weight loss and hepatocyte injury induced by the MCD diet. As seen, feeding the MCD diet for 1–15 days induced a progressive weight loss that was reproduced in mice fed the MD but not CD diet (Fig. 1A). In addition, hepatocellular injury reflected by the serum transaminase values indicated that both MCD and MD diets caused a progressive ALT (Fig. 1B) and AST (not shown) release from day 7 to day 15 of feeding, whereas feeding the CD diet for the same period of time did not cause these changes. These findings were confirmed histologically by hematoxylin and eosin staining, indicating substantial hepatocellular damage induced by feeding the MCD or MD diet but not the CD (Fig. 1C), consistent with previous findings (6). Thus, these results indicate that the nutritional deficiency of methionine reproduces the characteristic weight loss and hepatocellular injury of feeding the MCD diet.
FIGURE 1.
Effect of MCD, MD, or CD diet on weight loss and hepatocellular damage. Mice were fed the corresponding diets for 1–15 days, analyzing the impact on weight loss (A) and serum ALT release (B). Moreover, liver samples were processed for hematoxylin and eosin staining to show the effect of feeding on parenchymal architecture and organization (C). Results in A and B are the mean ± S.D. (error bars) of four to six individual mice; the images shown in C are representative of four or five individual mice. *, p < 0.05 versus control mice C.
Hepatic Steatosis in Mice Fed MCD, MD, and CD Diets
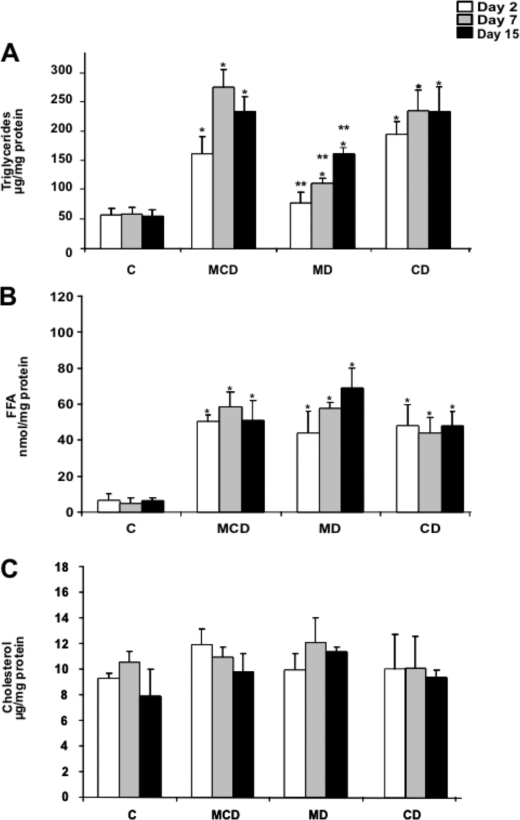
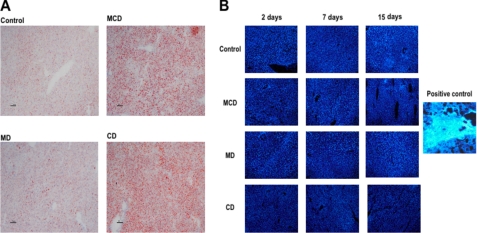
Because one of the prominent effects of the MCD diet is the onset of hepatic steatosis, we next characterized the relative contribution of MD and CD in lipid homeostasis. Hepatic lipid profile revealed a time-dependent increase in TG accumulation in mice fed the MCD diet from 1 to 15 days that was paralleled by feeding the CD diet (Fig. 2A). In both cases, the steatosis was macrovesicular as seen by hematoxylin and eosin analyses (Fig. 1C), consistent with the quantitative accumulation of TG in the MCD and CD groups (Fig. 2A). In addition, the increased hepatic TG content following MD diet was observed at 7 and 15 days of feeding with significantly lower levels compared with those observed with either the MCD or CD diet (Fig. 2A). A similar outcome with hepatic levels of free fatty acids was observed at 1, 7, and 15 days after feeding a MCD, MD or CD diet (Fig. 2B). However, none of the diets changed the total cholesterol content at any of the time points examined (Fig. 2C), in agreement with previous findings (6, 28, 29). These biochemical characteristics were consistent with the staining of liver samples with oil red and filipin, which monitor the level of neutral lipids and free cholesterol, respectively (Fig. 3, A and B). Again and consistent with the changes of TG levels, oil red staining was lower in mice fed the MD diet compared with either the MCD or CD group. In the case of filipin, we processed a liver biopsy from mice fed a hypercholesterolemic diet as a positive control showing the characteristic staining of free cholesterol (6, 24). Thus, steatosis, characterized by TG and free fatty acids but not cholesterol, is a common feature for the three diets examined, although it is more prominent upon feeding the MCD or CD diet.
FIGURE 2.
Hepatic lipid profile of mice fed the MCD, MD, or CD diet. Liver samples from the different groups of mice were processed for the biochemical determination of TG (A), free fatty acids (B), or cholesterol (C). Results are the mean ± S.D. (error bars) of four to six individual mice. *, p < 0.05 versus control mice C; **, p < 0.05 versus MDC group.
FIGURE 3.
Oil red and filipin staining of liver samples from mice fed the MCD, MD, or CD diet. A, samples from mice fed the different diets for 15 days were processed for neutral lipid accumulation monitored by oil red staining. B, alternatively, samples were stained with filipin to monitor free cholesterol accumulation after 2, 7, and 15 days of feeding the MCD, MD, or CD diet. The image on the right shows a representative liver sample of mice fed a hypercholesterolemic diet for 2 days followed by filipin staining. Images are representative of four to six individual mice showing similar findings.
MD Diet Reproduces the Inflammation and Fibrosis Observed in Mice Fed MCD Diet
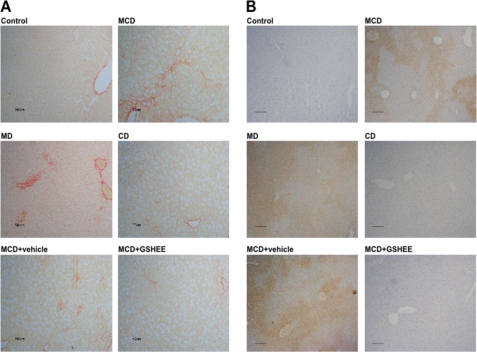
Because steatosis is the first step in the progression to NASH, which is typically characterized by inflammation and fibrosis, we next examined the appearance of these signs following the feeding of the different diets. Confirming previous findings, MCD feeding caused fibrosis as assessed by collagen deposition stained by Sirius red as well as neutrophil infiltration examined by MPO staining (Fig. 4, A and B). Paralleling these findings, we observed that MD feeding reproduced the fibrosis (Sirius red staining) and inflammation (MPO staining) caused by the MCD diet, in contrast to mice fed the CD diet. Similar findings were observed with hydroxyproline levels, indicative of collagen up-regulation induced by MCD and MD diets (data not shown). Thus, these data underscore that the lack of methionine in the MCD diet plays a major role in the inflammation and fibrosis in the MCD model.
FIGURE 4.
Collagen deposition and neutrophil infiltration of liver samples from mice fed the MCD, MD, or CD diet. A, samples from mice fed the different diets for 15 days were stained with Sirius red to monitor collagen deposition. Please note that mice fed the MCD, MD, but not CD diet exhibit higher collagen deposition reflected by increased red fibers. B, parallel samples from mice fed the different diets were processed for MPO staining, indicative of neutrophil infiltration and inflammation. As with the Sirius red staining, mice fed the MCD, MD, but not CD diet display MPO staining. Moreover, some mice were fed the MCD diet and treated with GSH-EE intraperitoneally twice a week and then processed for Sirius red and MPO staining, indicating that GSH-EE ameliorated the extent of collagen accumulation and inflammation compared with mice. Images are representative of five to seven individual mice showing similar findings.
Mitochondrial SAM and GSH Homeostasis in Mice Fed MCD, MD, and CD Diets
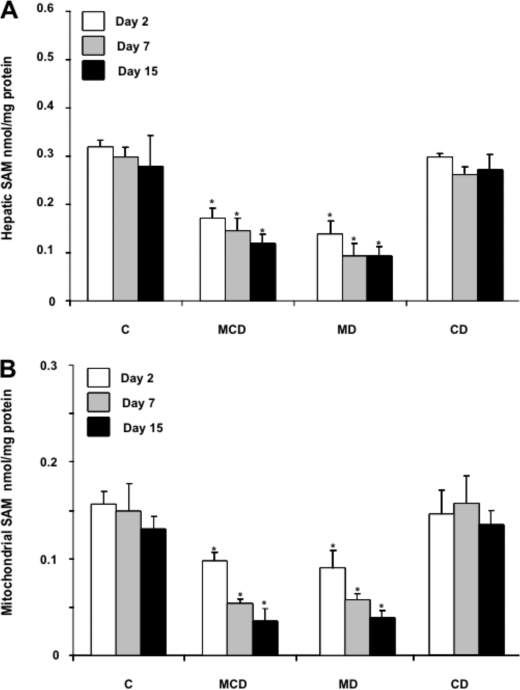
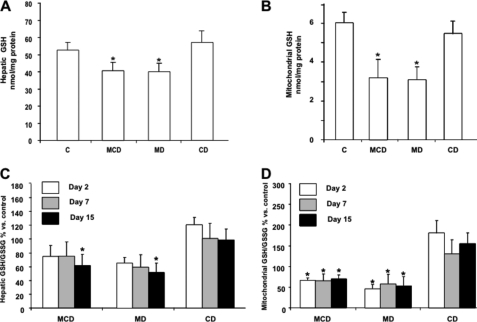
The metabolism of methionine in the liver exhibits unique features, including its conversion into SAM catalyzed by the liver-specific methionine adenosyltransferase 1A (14). SAM is an essential intermediate of the methionine cycle, and it is used in the methylation of multiple molecular targets, in the synthesis of polyamines, and in the formation of cysteine in the transsulfuration pathway, which is predominantly used in the synthesis of GSH (13, 14). Consistent with these biochemical features, one of the consequences of MCD feeding results in the limitation of hepatic SAM and GSH levels. Although both metabolites are synthesized exclusively in the cytosol, they are also found predominantly in mitochondria due to the function of specific carriers (13, 22). Unlike hepatic SAM and GSH whose levels have been widely reported in NASH (18, 19), the role of the specific mitochondrial pool of SAM and GSH in relation to the pathology of the MCD model has not been previously examined. Liver samples from mice fed MCD, MD, or CD were fractionated to isolate mitochondria to examine the levels of SAM and GSH. As seen, the levels of mitochondrial SAM diminish gradually with the time of feeding of the MCD or MD but not CD diet, paralleling the decrease seen in total hepatic extracts (Fig. 5A and B). Moreover, these changes in hepatic SAM levels were accompanied by increased SAH and homocysteine (supplemental Fig. 1). These are intriguing findings because methionine deprivation is expected to result in lower SAH and homocysteine levels. However, recent observations indicated that the lack of methionine induces a posttranscriptional down-regulation of cystathionine β-synthase, which may contribute to the maintenance of SAM and SAH levels despite the lack of methionine (30). In the case of GSH compartmentation, although both MCD and MD diets induced a modest (about 20–25%) GSH decrease in hepatic extracts (Fig. 6A), interestingly, mitochondrial GSH was substantially depleted by 50–60% following MCD or MD feeding (Fig. 6B). In either case, feeding the CD diet did not modify the total or mitochondrial GSH levels (Fig. 6, A and B). Furthermore, the GSH/GSSG significantly decreased in hepatic mitochondria from mice fed the MCD or MD diet but not CD diet, whereas the ratio in hepatic extracts diminished after 15 days of MCD or MD feeding (Fig. 6, C and D). Thus, these findings report for the first time the severe depletion of both SAM and GSH in mitochondria from mice fed the MCD or MD but not the CD diet.
FIGURE 5.
Hepatic and mitochondrial SAM levels from liver samples of mice fed the MCD, MD, or CD diet. A, liver samples from the different nutritional groups were homogenized and processed for SAM determination by HPLC as described under “Experimental Procedures.” B, alternatively, samples were fractionated to isolate mitochondria and processed for SAM determination as in A. Results are the mean ± S.D. (error bars) of four to six individual mice. *, p < 0.05 versus control mice.
FIGURE 6.
Hepatic and mitochondrial GSH content from mice fed the MCD, MD or CD diet. Liver samples from mice fed the different diets for 1, 7, or 15 days were processed for GSH and GSH/GSSG determination by HPLC in total hepatic extracts (A and C) or isolated mitochondria (B and D). Results are the mean ± S.D. (error bars) of four to six individual mice. *, p < 0.05 versus control mice.
MCD and MD Feeding Decreases Mitochondrial Membrane Fluidity and Increases Ceramide Levels
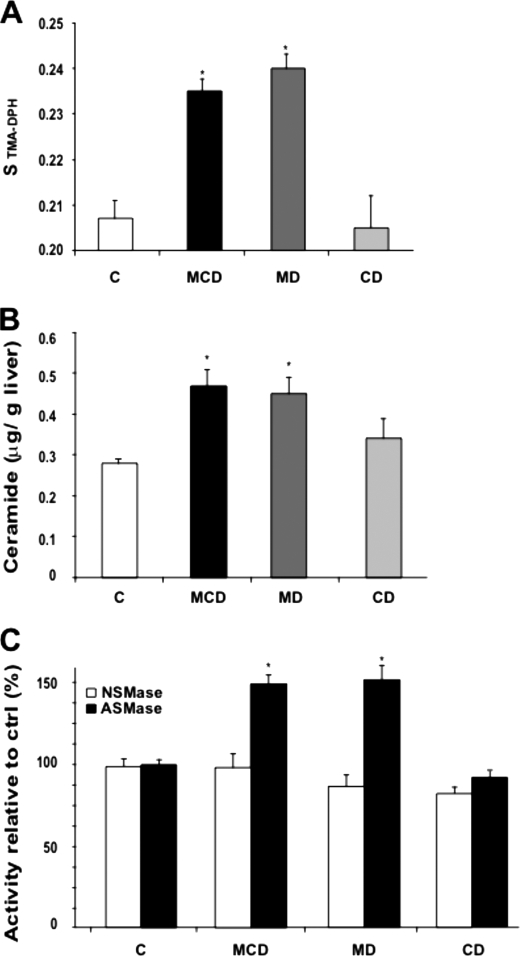
Given the above findings on the depletion of mitochondrial GSH levels by MCD and MD diets and because this particular pool of GSH arises from the transport of cytosolic GSH by a specific carrier sensitive to membrane dynamics (21), we next examined whether MCD or MD feeding altered mitochondrial membrane fluidity. Compared with mitochondria isolated from CD-fed mice livers, feeding the MCD or MD diet increased the order parameter of isolated mitochondria labeled with TMA-DPH, indicating reduced membrane fluidity (Fig. 7A). Interestingly, although the cholesterol/phospholipids molar ratio is a major determinant of membrane dynamics, the increased order parameter of hepatic mitochondria from mice fed the MCD or MD diet occurred despite lack of cholesterol enrichment in the liver (Figs. 2 and 3) or mitochondria (data not shown). In addition to cholesterol, the PC/PE ratio is also known to regulate membrane fluidity. Indeed, lower plasma membrane PC/PE in NASH has been shown to result in decreased membrane fluidity (31). In eukaryotic cells, PC and PE, the major phospholipid components of membranes, are synthesized de novo via two branches of the Kennedy pathway, the CDP-ethanolamine or CDP-choline pathways (32). In addition, PC can also be generated from PE by three methylation steps by PE methyltransferases. The mitochondrial PC/PE ratio was reduced following MCD and MD feeding (supplemental Fig. 2). In contrast, CD feeding did not significantly change this ratio, consistent with previous findings in which choline deficiency by itself does not limit the synthesis of PC due to the activation of CTP:phosphocholine cytidyltransferase and availability of phosphocholine above the Km for the cytidyltransferase (33). However, the limitation and decrease of PC following MD feeding is intriguing because the normal levels of choline in this particular diet are expected to drive the synthesis of PC via de CDP-choline pathway. However, it has been previously shown that ceramide blocks the CDP-choline pathway (34). Therefore, we set out to determine the hepatic ceramide levels under the three nutritional regimes. As seen, MCD and MD but not CD diet increased significantly the levels of ceramide (Fig. 7B), in agreement with previous findings in PC12 cells (35) and consistent with the effects observed in the mitochondrial order parameter. Moreover, this outcome was accompanied by the stimulation of ASMase but not NSMase by MCD or MD feeding (Fig. 7C). Thus, these findings indicate that MCD and MD feeding perturb mitochondrial membrane dynamics associated with decreased PC/PE ratio and increased ceramide levels.
FIGURE 7.
Mitochondrial membrane order parameter and ceramide and sphingomyelinase activities. A, mitochondria from mice fed the MCD, MD, or CD diet for 15 days were labeled with TMA-DPH to monitor fluorescence anisotropy and subsequent order parameter as described under “Experimental Procedures.” B and C, liver samples were processed for ceramide determination by HPLC (B) and ASMase and NSMase activities from NBD C6-sphingomyelin analyzing the NBD C6-ceramide by thin layer chromatograpy (C). Results are the mean ± S.D. (error bars) of four to six individual mice. *, p < 0.05 versus control mice.
GSH-EE or SAM but Not CysNAc Therapy Protects Mice Fed MCD and MD Diets against NASH
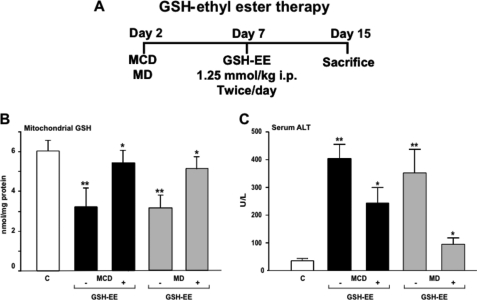
Based on the preceding findings showing the depletion of mitochondrial GSH by MCD due to decreased SAM and perturbed membrane dynamics, we next examined the potential relevance of strategies that replenish mitochondrial GSH in the hepatocellular damage and course of disease induced by the different diets. Because the mitochondrial pool of GSH derives from the transport of cytosolic GSH by a specific carrier sensitive to membrane dynamics (21), using GSH precursors such as CysNAc would not be expected to boost mitochondrial GSH, as shown previously in alcohol-fed rats which exhibited decreased mitochondrial membrane dynamics and impaired mitochondrial GSH transport (22, 36). To overcome this pitfall we used GSH-EE, which has been shown to be able to replete the mitochondrial pool of GSH despite impaired transport due to increased mitochondrial cholesterol loading (36). Thus, mice were fed the MCD or MD diet for 2 weeks, and in some cases GSH-EE was given intraperitoneally twice a day for the last 7 days (Fig. 8A). GSH-EE restored mitochondrial GSH levels, and this was accompanied by the attenuation of ALT release in the serum indicating reduced hepatocellular damage (Fig. 8, B and C). Furthermore, this response also resulted in the amelioration of fibrosis and inflammation analyzed by Sirius red and MPO staining (Fig. 4, A and B). In contrast and consistent with previous findings in alcohol-fed rats (22, 36), the administration of CysNAc was inefficient in restoring mitochondrial GSH levels and in the protection against MCD or MD-mediated NASH.5 Moreover, SAM therapy was as effective as GSH-EE in replenishing mitochondrial GSH and in the attenuation of hepatocellular damage in mice fed the MCD diet (supplemental Fig. 3). Thus, these findings indicate that the depletion of mitochondrial GSH is critical for NASH and that therapies aimed to increase this critical GSH pool may be of relevance for NASH.
FIGURE 8.
GSH-EE therapy restores mitochondrial GSH and protects against MCD- and MD-induced hepatocellular damage. A, scheme outlines the treatment of MCD and MD-fed mice with GSH-EE. GSH-EE was administered intraperitoneally 1 week after mice were fed a MCD or MD diet and maintained for another week given twice a day. B, liver samples were processed and fractionated to isolate mitochondria to determine GSH levels. C, ALT release in serum was determined from the different groups of mice with or without GSH-EE administration. Results are the mean ± S.D. of four to six individual mice. *, p < 0.05 versus control mice.
DISCUSSION
In the present study we examined the specific contribution of methionine and choline in NASH induced by MCD diet, focusing on the impact on mitochondrial SAM and GSH. The major finding is that the lack of methionine in the diet reproduces most of the deleterious effects induced by MCD and that methionine deficiency determines the depletion of mitochondrial SAM and GSH, with modest changes in the total hepatic levels. The transport of SAM and GSH in mitochondria operates through distinct carriers, which exhibit differential dependence on mitochondrial membrane dynamics (21). Although cholesterol loading is emerging as a critical factor in NASH, particularly in mitochondria (6, 24), interestingly we observed that hepatic mitochondria from mice fed MCD or MD exhibit increased order parameter without cholesterol accumulation which is known to regulate membrane dynamics. Rather, the decrease in membrane fluidity induced by the lack of methionine is accompanied by a lower PC/PE ratio, which is also considered an important modulator of membrane fluidity. Indeed, previous findings in PE methyltransferase knock-out mice fed a CD diet resulted in steatohepatitis due to low plasma membrane PC/PE ratio, which contributed to disrupted membrane integrity and decreased membrane fluidity (31). The observed outcome is intriguing as unlike MCD diet the MD diet contains an adequate choline level, which would be expected to drive the CDP-choline branch of the Kennedy pathway to synthesize PC de novo (11, 32), although the PC synthesis from PE methylation would be predicted to be impaired due to the limitation of SAM. To account for this unexpected finding (decreased PC/PE ratio despite choline in the MD group), we observed that methionine deficiency increased hepatic ceramide levels in agreement with previous observations in PC12 cells (35) and in mice fed the MCD diet (37). Although we did not determine whether the lack of methionine stimulated de novo ceramide synthesis from palmitoyl-CoA and serine, we did observe the activation of ASMase but not NSMase. The mechanism, however, underlying this observation is currently unknown and deserves further investigation. Moreover, based on previous observations in neuroblastoma cells exposed to C2-ceramide, the increase in ceramide levels induced by MD or MCD would be expected to inhibit the CDP-choline pathway and hence the synthesis of PC (34). The alternative synthesis of PC from PE by PE methyltransferases is anticipated to be impaired without methionine because of reduced SAM availability. Thus, the impact of methionine deficiency on mitochondrial GSH depletion is mediated by increasing ceramide levels and subsequent impaired PC synthesis (from either the CDP-choline pathway and PE methylation) resulting in lower PC/PE ratio, which determines reduced mitochondrial membrane fluidity and impaired transport of cytosolic GSH into mitochondria.
In addition to these changes, we observed a disproportionate depletion of mitochondrial SAM in relation to that of hepatic SAM content. This outcome was accompanied by increased levels of SAH and homocysteine resulting in a subsequent lower SAM/SAH ratio, which has been shown to control key cellular functions such as methylation reactions of different targets, including DNA, proteins, and lipids (14). Consistent with these findings, increased SAH has been shown to compete for SAM for transport into mitochondria, accounting for the mitochondrial SAM depletion induced by alcohol intake (22). Moreover, increased SAH and subsequent hyperhomocysteinemia may also participate in the ER stress and UPR response, which it is considered a critical mechanism leading to NASH. However, recent observations in mice fed the MCD diet supplemented with homocysteine have disputed a role for homocysteine in the UPR caused by MCD diet (20). Although we did not examine the onset of ER stress and UPR, the lack of methionine in both the MCD and MD diets could account for the hepatic steatosis observed in both cases, as this response is expected to result in the activation of ER-based transcription factors SREBPs, which control lipogenesis. Of note, although recent investigations reported that MCD diet feeding induced UPR and stimulated cholesterol synthesis due to SREBP-2 activation (20), in agreement with previous observations (28, 29) we did not observed this outcome either in mice fed the MCD or MD diet. The explanation for the disparate findings regarding the effect of MCD (or MD) feeding on cholesterol up-regulation reported by Henkel et al. (20) and the present study may be due to the different time of feeding, the gender (female versus male), or the genetic background of mice used (FVB/NJ versus C57BL/6). In this vein, different mouse strains have been shown to exhibit selective susceptibility to MCD-induced NASH, with the C57BL/6 strain being less susceptible than the DBA/2J (38). Thus, the lack of methionine leads to a low SAM/SAH ratio, resulting in mitochondrial SAM depletion in addition to ER stress and UPR. Although the latter may be responsible for certain aspects of the pathology, the former may account for the mitochondrial dysfunction and mitochondrial GSH depletion, which in turn determine the hepatocellular susceptibility to oxidative stress and inflammatory cytokines (6), characteristic of NASH. In addition to the potential contribution of decreased mitochondrial SAM and GSH to NASH by methionine deprivation, it has to be recognized that the limited hepatic SAM would negatively impact in downstream targets including polyamine synthesis and methylation reactions.
Having observed the depletion of mitochondrial GSH in the MCD model (which is reproduced by MD diet feeding), we next addressed the effect of GSH precursors in the course of disease and replenishment of mitochondrial GSH. Our findings indicate that not all GSH prodrugs are equal. Although CysNAc, a GSH precursor, reverses the moderate depletion of hepatic GSH, it fails to restore the mitochondrial pool of GSH following MCD or MD feeding. The newly synthesized GSH from CysNAc in the cytosol is not effectively transported to mitochondria because of the block imposed by the loss of membrane fluidity associated with a decreased PC/PE ratio, consistent with previous observations in alcohol-fed rats (36). In a total enteral nutrition, the NASH model induced by overfeeding a diet enriched in polyunsaturated fat, CysNAc attenuated the progression of the liver pathology, which was associated with increased total hepatic GSH (39). However, the effect of CysNAc on the specific pool of mitochondrial GSH was not examined, nor was the impact of overfeeding on mitochondrial membrane composition and dynamics. In contrast to CysNAc, we report for the first time that GSH-EE attenuates the deleterious effects of feeding the MCD diet in terms of hepatocellular damage, fibrosis, and inflammation, and these effects are due to its ability to replenish mitochondrial GSH. Unlike CysNAc, GSH-EE is permeable to mitochondria and has been shown to boost GSH stores directly in conditions of impaired transport imposed by perturbed membrane fluidity (36). As expected and consistent with the effects observed with GSH-EE, SAM therapy exerted a protective effect against MCD-induced NASH similar to that observed with GSH-EE and in agreement with previous findings (40). In addition to serving as a GSH precursor in the transsulfuration pathway, SAM has been shown to regulate membrane dynamics by modulating the cholesterol/phospholipids and PC/PE ratios, thus overcoming the impaired transport of GSH into mitochondria in rats fed alcohol (41).
In summary, our data suggest that the targeting of mitochondrial GSH with appropriate strategies to boost this specific pool may be a novel therapy for NASH. Although this specific aspect merits further investigation in human disease, the depletion of mitochondrial GSH in patients with NASH has been reported recently (42), lending further support for the potential critical role of mitochondrial GSH in human NASH.
Supplementary Material
This work was supported by National Institute on Alcohol Abuse and Alcoholism Center Grant P50-AA-11999 from the Research Center for Liver and Pancreatic Diseases. This work was also supported by Plan Nacional de I+D Grants SAF2006-06780, SAF2008-02199, SAF2008-04974, and SAF2009-11417, Instituto de Salud Carlos III Grants PI070193 and PI09/00056, by Centro de Investigación Biomédica en Red de Enfermedades Hepáticas y Digestivas from the Intituto Carlos III, the Mutua Madrileña.

The on-line version of this article (available at http://www.jbc.org) contains supplemental Methods, Discussion, additional references, and Figs. 1–3.
L. Martínez, C. García-Ruiz, and J. C. Fernández-Checa, unpublished observations.
- NASH
- nonalcoholic steatohepatitis
- ER
- endoplasmic reticulum
- CD
- choline-deficient
- MD
- methionine-deficient
- MCD
- methionine- and choline-deficient diet
- PC
- phosphatidylcholine
- PE
- phosphatidylethanolamine
- TG
- triglyceride
- SAM
- S-adenosyl-l-methionine
- SAH
- S-adenosylhomocysteine
- GSH-EE
- glutathione ethyl ester
- CysNAc
- N-acetylcysteine
- AST
- aspartate aminotransferase
- ALT
- alanine aminotransferase
- MPO
- myeloperoxidase
- HPLC
- high performance liquid chromatography
- ASMase
- acid sphingomyelinase
- NSMase
- neutral sphingomyelinase
- TMA-DPH
- trimethylammonium-diphenyl-hexatriene
- UPR
- unfolded protein response.
REFERENCES
- 1.Angulo P. (2002) N. Engl. J. Med. 346, 1221–1231 [DOI] [PubMed] [Google Scholar]
- 2.Tilg H., Diehl A. M. (2000) N. Engl. J. Med. 343, 1467–1476 [DOI] [PubMed] [Google Scholar]
- 3.Brunt E. M. (2004) Semin. Liver Dis. 24, 3–20 [DOI] [PubMed] [Google Scholar]
- 4.Crespo J., Cayón A., Fernández-Gil P., Hernández-Guerra M., Mayorga M., Domínguez-Díez A., Fernández-Escalante J. C., Pons-Romero F. (2001) Hepatology 34, 1158–1163 [DOI] [PubMed] [Google Scholar]
- 5.Uysal K. T., Wiesbrock S. M., Marino M. W., Hotamisligil G. S. (1997) Nature 389, 610–614 [DOI] [PubMed] [Google Scholar]
- 6.Marí M., Caballero F., Colell A., Morales A., Caballeria J., Fernández A., Enrich C., Fernández-Checa J. C., García-Ruiz C. (2006) Cell Metab. 4, 185–198 [DOI] [PubMed] [Google Scholar]
- 7.Ji C., Kaplowitz N. (2004) World J. Gastroenterol. 10, 1699–1708 [DOI] [PMC free article] [PubMed] [Google Scholar]
- 8.Malaguarnera M., Di Rosa M., Nicoletti F., Malaguarnera L. (2009) J. Mol. Med. 87, 679–695 [DOI] [PubMed] [Google Scholar]
- 9.Sanyal A. J., Campbell-Sargent C., Mirshahi F., Rizzo W. B., Contos M. J., Sterling R. K., Luketic V. A., Shiffman M. L., Clore J. N. (2001) Gastroenterology 120, 1183–1192 [DOI] [PubMed] [Google Scholar]
- 10.Day C. P., James O. F. (1998) Gastroenterology 114, 842–845 [DOI] [PubMed] [Google Scholar]
- 11.Li Z., Vance D. E. (2008) J. Lipid Res. 49, 1187–1194 [DOI] [PubMed] [Google Scholar]
- 12.Varela-Rey M., Embade N., Ariz U., Lu S. C., Mato J. M., Martínez-Chantar M. L. (2009) Int. J. Biochem. Cell Biol. 41, 969–976 [DOI] [PubMed] [Google Scholar]
- 13.Marí M., Colell A., Morales A., Von Montfort C., Garcia-Ruiz C., Fernández-Checa J. C. (2010) Antioxid. Redox Signal. 12, 1295–1331 [DOI] [PMC free article] [PubMed] [Google Scholar]
- 14.Mato J. M., Lu S. C. (2007) Hepatology 45, 1306–1312 [DOI] [PubMed] [Google Scholar]
- 15.Chowdhry S., Nazmy M. H., Meakin P. J., Dinkova-Kostova A. T., Walsh S. V., Tsujita T., Dillon J. F., Ashford M. L., Hayes J. D. (2010) Free Rad. Biol. Med. 48, 357–371 [DOI] [PubMed] [Google Scholar]
- 16.Ahsan M. K., Okuyama H., Hoshino Y., Oka S., Masutani H., Yodoi J., Nakamura H. (2009) Antioxid. Redox Signal. 11, 2573–2584 [DOI] [PubMed] [Google Scholar]
- 17.Tomita K., Oike Y., Teratani T., Taguchi T., Noguchi M., Suzuki T., Mizutani A., Yokoyama H., Irie R., Sumimoto H., Takayanagi A., Miyashita K., Akao M., Tabata M., Tamiya G., Ohkura T., Hibi T. (2008) Hepatology 48, 458–473 [DOI] [PubMed] [Google Scholar]
- 18.Veteläinen R., van Vliet A., van Gulik T. M. (2007) J. Gastroenterol. Hepatol. 22, 1526–1533 [DOI] [PubMed] [Google Scholar]
- 19.Oz H. S., Chen T. S., Neuman M. (2008) Dig. Dis. Sci. 53, 767–776 [DOI] [PMC free article] [PubMed] [Google Scholar]
- 20.Henkel A. S., Elias M. S., Green R. M. (2009) J. Biol. Chem. 284, 31807–31816 [DOI] [PMC free article] [PubMed] [Google Scholar]
- 21.Marí M., Morales A., Colell A., García-Ruiz C., Fernández-Checa J. C. (2009) Antioxid. Redox Signal. 11, 2685–2700 [DOI] [PMC free article] [PubMed] [Google Scholar]
- 22.Fernández A., Colell A., Caballero F., Matías N., García-Ruiz C., Fernández-Checa J. C. (2009) Alcohol Clin. Exp. Res. 33, 1169–1180 [DOI] [PubMed] [Google Scholar]
- 23.Colell A., García-Ruiz C., Lluis J. M., Coll O., Mari M., Fernández-Checa J. C. (2003) J. Biol. Chem. 278, 33928–33935 [DOI] [PubMed] [Google Scholar]
- 24.Caballero F., Fernández A., De Lacy A. M., Fernández-Checa J. C., Caballería J., García-Ruiz C. (2009) J. Hepatol. 50, 789–796 [DOI] [PubMed] [Google Scholar]
- 25.García-Ruiz C., Marí M., Morales A., Colell A., Ardite E., Fernández-Checa J. C. (2000) Hepatology 32, 56–65 [DOI] [PubMed] [Google Scholar]
- 26.Llacuna L., Marí M., Garcia-Ruiz C., Fernández-Checa J. C., Morales A. (2006) Hepatology 44, 561–572 [DOI] [PubMed] [Google Scholar]
- 27.Merrill A. H., Jr., Wang E., Mullins R. E., Jamison W. C., Nimkav S., Liotta D. C. (1988) Anal. Biochem. 171, 373–381 [DOI] [PubMed] [Google Scholar]
- 28.Behari J., Yeh T. H., Krauland L., Otruba W., Cieply B., Hauth B., Apte U., Wu T., Evans R., Monga S. P. (2010) Am. J. Pathol. 176, 744–753 [DOI] [PMC free article] [PubMed] [Google Scholar]
- 29.Witek R. P., Stone W. C., Karaca F. G., Syn W. K., Pereira T. A., Agboola K. M., Omenetti A., Jung Y., Teaberry V., Choi S. S., Guy C. D., Pollard J., Charlton P., Diehl A. M. (2009) Hepatology 50, 1421–1430 [DOI] [PubMed] [Google Scholar]
- 30.Tang B., Mustafa A., Gupta S., Melnyk S., James S. J., Kruger W. D. (2010) Nutrition, in press [DOI] [PMC free article] [PubMed] [Google Scholar]
- 31.Li Z., Agellon L. B., Allen T. M., Umeda M., Jewell L., Mason A., Vance D. E. (2006) Cell Metab. 3, 321–331 [DOI] [PubMed] [Google Scholar]
- 32.Kennedy E. P. (1956) J. Biol. Chem. 222, 185–191 [PubMed] [Google Scholar]
- 33.Kulinski A., Vance D. E., Vance J. E. (2004) J. Biol. Chem. 279, 23916–23924 [DOI] [PubMed] [Google Scholar]
- 34.Ramos B., Lahti J. M., Claro E., Jackowski S. (2003) Mol. Pharmacol. 64, 502–511 [DOI] [PubMed] [Google Scholar]
- 35.Yen C. L., Mar M. H., Craciunescu C. N., Edwards L. J., Zeisel S. H. (2002) J. Nutr. 132, 1840–1847 [DOI] [PubMed] [Google Scholar]
- 36.Fernández A., Llacuna L., Fernández-Checa J. C., Colell A. (2009) J. Neurosci. 29, 6394–6405 [DOI] [PMC free article] [PubMed] [Google Scholar]
- 37.Mas E., Danjoux M., Garcia V., Carpentier S., Ségui B., Levade T. (2009) PLoS ONE 4, e7929. [DOI] [PMC free article] [PubMed] [Google Scholar]
- 38.Pogribny I. P., Tryndyak V. P., Bagnyukova T. V., Melnyk S., Montgomery B., Ross S. A., Latendresse J. R., Rusyn I., Beland F. A. (2009) J. Hepatol. 51, 176–186 [DOI] [PMC free article] [PubMed] [Google Scholar]
- 39.Baumgardner J. N., Shankar K., Hennings L., Albano E., Badger T. M., Ronis M. J. J. (2008) J. Nutr. 138, 1872–1879 [DOI] [PMC free article] [PubMed] [Google Scholar]
- 40.Oz H. S., Im H. J., Chen T. S., de Villiers W. J., McClain C. J. (2006) J. Biochem. Mol. Toxicol. 20, 39–47 [DOI] [PMC free article] [PubMed] [Google Scholar]
- 41.García-Ruiz C., Morales A., Colell A., Ballesta A., Rodés J., Kaplowitz N., Fernández-Checa J. C. (1995) Hepatology 21, 207–214 [DOI] [PubMed] [Google Scholar]
- 42.Serviddio G., Bellanti F., Tamborra R., Rollo T., Capitanio N., Romano A. D., Sastre J., Vendemiale G., Altomare E. (2008) Gut 57, 957–965 [DOI] [PubMed] [Google Scholar]
Associated Data
This section collects any data citations, data availability statements, or supplementary materials included in this article.


