

Abstract
A2780 human ovarian carcinoma cells respond to treatment with the synthetic retinoid N-(4-hydroxyphenyl)retinamide (HPR) with the production of dihydroceramide and with a concomitant reduction of cell proliferation and induction of apoptosis. The derived HPR-resistant clonal cell line, A2780/HPR, is less responsive to HPR in terms of dihydroceramide generation. In this report, we show that the production of sphingosine 1-phosphate (S1P) is significantly higher in A2780/HPR versus A2780 cells due to an increased sphingosine kinase (SK) activity and SK-1 mRNA and protein levels. Treatment of A2780 and A2780/HPR cells with a potent and highly selective pharmacological SK inhibitor effectively reduced S1P production and resulted in a marked reduction of cell proliferation. Moreover, A2780/HPR cells treated with a SK inhibitor were sensitized to the cytotoxic effect of HPR, due to an increased dihydroceramide production. On the other hand, the ectopic expression of SK-1 in A2780 cells was sufficient to induce HPR resistance in these cells. Challenge of A2780 and A2780/HPR cells with agonists and antagonists of S1P receptors had no effects on their sensitivity to the drug, suggesting that the role of SK in HPR resistance in these cells is not mediated by the S1P receptors.
These data clearly demonstrate a role for SK in determining resistance to HPR in ovarian carcinoma cells, due to its effect in the regulation of intracellular ceramide/S1P ratio, which is critical in the control of cell death and proliferation.
Keywords: Cancer, Drug Resistance/Cancer Therapy/Chemotherapy, Enzymes/Lipid, Lipid/Sphingolipids, Signal Transduction/Sphingolipidsy, Fenretinide, Sphingosine Kinase
Introduction
Ovarian cancer is the fifth most common cancer, and it is the leading cause of death from all types of gynecological cancer. This carcinoma has a high rate of recurrence and subsequent mortality after chemotherapy; many patients relapse after first line treatment, and only the 15% are long survivors. The failure of this kind of treatment is generally caused by the acquisition of drug resistance. Cancer cells develop multiple mechanisms to evade drug toxicity. Several commonly used anticancer drugs, including daunorubicin, vincristine, and retinoids, exert their cytotoxic action at least in part by triggering the production of the sphingolipid ceramide, a mediator of apoptosis and an inhibitor of cell proliferation in a variety of tumor cell lines (1). It has been demonstrated that chemoresistant tumor and tumor cell lines are frequently characterized by the increased glycosylation of ceramide with formation of glucosylceramide, due to an increased expression or activation of glucosylceramide synthase (2). Scavenging ceramide via its increased glycosylation would allow tumor cells to escape ceramide-induced apoptosis, thus contributing to the drug-resistant phenotype (3–5). However, it has been shown that GlcCer accumulation is not the only consequence of an altered sphingolipid metabolism in drug-resistant cancer cells. In multidrug-resistant human ovarian carcinoma cells, sphingomyelin and galactosylceramide levels were also higher respect to parental sensitive cells, whereas lactosylceramide and all more complex glycosphingolipids were present in lower amounts (6). On the other hand, retinoid-resistant ovarian cancer cells had similar levels of glucosylceramide synthase with respect to their drug-sensitive counterpart, but higher levels of GM32 synthase leading to higher ganglioside content (7). In addition to its use as a precursor of complex sphingolipids, ceramide can be converted into sphingosine, which is then phosphorylated from sphingosine kinases (1 and 2) to generate S1P. The formation of S1P is the requisite for the complete degradation of ceramide and other sphingolipids. On the other hand, S1P is another important sphingolipid-derived mediator actively participating in signal transduction pathways and regulating many different cell functions. It is well recognized that a dual mode of S1P action exists: being the bioactive sphingolipid capable of acting intracellularly but also via the activation of a family of five G-protein-coupled receptors (S1P1–5) (7). In this regard in some instances S1P exerts its pro-mitogenic and anti-apoptotic action as intracellular mediator (8), whereas in other instances ligation to S1P1 and S1P3 is required to convey these two biological effects (9–11). Independently from its action mode, it is clear that ceramide and S1P exert opposite effects on cell fate, and enzymes contributing to the regulation of the relative concentrations of these lipids, such as SK, represent an essential checkpoint in determining whether a cell proliferates or undergoes apoptosis (12–14). Recently, a role of SK in the resistance of cancer cells to chemotherapy has been suggested (15–18).
The synthetic retinoid HPR is cytotoxic in vitro to a variety of cancer cell types, including neuroblastoma, breast, lung, prostate, and ovarian cancer, and might represent a promising chemopreventive and antitumor agent (18). Currently HPR is under clinical trials for the cure of prostatic and ovarian cancers, neuroblastoma, lymphoma, and leukemia. Ceramide-mediated apoptosis seems to be the major (even if not the sole) cytotoxic mechanism for HPR (reviewed in Ref. 19). HPR-induced production of ceramide mainly occurs via de novo synthesis, because HPR activates both serine palmitoyltransferase and dihydroceramide synthase (20, 21) that catalyze the first steps in sphingolipid biosynthesis (22). Moreover, it has been recently shown that HPR concomitantly inhibits dihydroceramide desaturase (22, 23), suggesting that dihydroceramide rather than (or in addition to) ceramide might mediate HPR-induced toxicity (24) possibly involving other mechanisms of death in addition to apoptosis. In this work, we investigate whether the resistance to HPR of human ovarian cancer cells could be associated with the activation of the SK/S1P leading to an altered dihydroceramide/S1P ratio that could prevent or overcome ceramide-mediated HPR-induced cell death.
EXPERIMENTAL PROCEDURES
Chemicals
HPR was from Sigma. VPC23019, JTE013, CAY10444, W146, SW2871, VPC24191, S1P, and SK inhibitor 2-(p-hydroxyanilino)-4-(p-chlorophenyl)thiazole were obtained from Calbiochem. [1-3H]Sphingosine (radiochemical purity over 98%; specific radioactivity of 2.2 Ci/mmol) and 3H-lipids used as chromatographic standards were prepared as described in a previous study (7).
Cell Culture and Transfection
A2780 and A2780/HPR cells, were cultured in RPMI 1640 (Sigma) supplemented with 10% of heat-inactivated fetal bovine serum (Amersham Biosciences), 2 mm glutamine, 100 units/ml penicillin, and 100 μg/ml streptomycin. A2780 and HPR were cultured in the presence of 5 μm HPR (25). A2780 cells were transfected by FuGENE® (Roche Applied Science) with the pcDNA3-hSK1WTFlag (26) (a gift of Dr. Stuart M. Pitson, Hanson Institute human Immunology, Institute for Medical and Veterinary Science, Adelaide, Australia) or with the empty vector, following the manufacturer's protocol. Stable transfectants were isolated after selection with 500 μg/ml Geneticin (G418, Sigma).
Lipid Analysis
For the analysis of S1P production, cells were pulsed with [1-3H]sphingosine for 45 min as previously described (27). Cell lipids were extracted with chloroform/methanol, and the total lipid extracts were partitioned with 0.15 volume of 0.1 m NH4OH. S1P in the upper alkaline phase was separated by high-performance TLC using the solvent system n-butanol/acetic acid/water (3:1:1). The radioactivity was determined by liquid scintillation counting. Radioactive lipids on high-performance TLC plates were detected and quantified by radioactivity imaging performed with a Beta-Imager 2000 instrument (Biospace) using an acquisition time of ∼48 h. The radioactivity associated with individual lipids was determined with the specific β-Vision software provided by Biospace.
Mass Spectrometry
The total lipid extract derived from 4 × 10⁷ A2780/HPR and SK1-overexpressing A2780 cells under basal conditions or treated with HPR, SK inhibitor, or both were subjected to a two-phase partitioning with 0.15 volume of 0.1 m NH4OH, the organic phases were treated with alkali as described previously (28) and were subjected to mass spectrometry (MS) analyses, carried out using a Thermo Quest Finnigan LCQDeca ion trap mass spectrometer (FINNIGAN MAT, San Jose, CA) equipped with an electrospray ionization ion source, an Xcalibur data system, and a TSP P4000 quaternary pump high-performance liquid chromatography. Separations of long-chain bases and Cer molecular species were obtained on a 5-μm, 250 × 4 mm LiChrospher 100 RP8 column (Merck).
Elution of long-chain bases and Cer molecular species was carried out, at a flow rate of 0.5 ml/min, with a gradient formed by the solvent system A, consisting of methanol/water (90:10, v/v), and solvent system B, consisting of methanol, both containing 5 mm ammonium acetate. The gradient elution program was as follows: 5 min with solvent A; 5 min with a linear gradient from 100% solvent A to 100% solvent B; 15 min with 100% solvent B; 5 min with a linear gradient from 100% solvent B to 100% methanol. Methanol was also used to wash the column for 10 min, followed by equilibration procedure with solvent A for 15 min.
Optimum conditions for Cer molecular species MS analyses included sheath gas flow of 50 arbitrary units, spray voltage of 4 kV, capillary voltage of −47 V, capillary temperature of 260 °C, fragmentation voltage (used for collision induced dissociation) of 40–60%. Mass spectra were acquired over an m/z range of 200–1000 in negative mode.
Optimum conditions for long-chain bases MS analyses included sheath gas flow of 50 arbitrary units, auxiliary gas flow of 5 arbitrary units, spray voltage of 4 kV, capillary voltage of 34 V, capillary temperature of 250 °C, and fragmentation voltage (used for collision-induced dissociation) of 60%. Mass spectra were acquired over a range m/z 200–1000 in positive mode.
For all experiments, source ion optics were adjusted to accomplish desolvation of ions while minimizing fragmentation.
As internal standards were used uncommon d18:1/17:0 ceramide, d18:0/17:0 ceramide, and d20:0 sphinganine. A stock solution of internal standards in ammonium acetate (5 mm) in methanol was quantitatively prepared (50 μm) and stored at −20 °C. Serial dilutions were prepared from this stock solution and utilized for calibration curves.
SK Activity Assay
To measure SK activity, cell lysates (60 μg) were incubated (29) in the presence of 50 μm d-erythro-sphingosine dissolved in 4 mg/ml bovine serum albumin and 1 mm ATP. Reaction was initiated by addition of [γ-32P]ATP (0.5 μCi, 1 mm) and 10 mm MgCl2 and terminated after 30-min incubation at 37 °C by addition of 20 μl of 1 n HCl and 900 μl of chloroform/methanol/HCl (100:200:1, v/v). 240 μl of chloroform and 240 μl of 1 m KCl were added, and phases were separated by centrifugation. 500 μl of the lower phase were dried under a stream of nitrogen and dissolved in 100 μl of chloroform/methanol (2:1). [32P]S1P was separated by TLC with 1-butanol/methanol/acetic acid/water (80:20:10:20, v/v) and visualized by autoradiography. The radioactive spots corresponding to [32P]S1P were scraped and counted in a scintillation counter. SK specific activity was expressed in picomoles/min*mg of protein in experiments performed at least in duplicate.
Western Blot
Cell homogenates were analyzed by SDS-PAGE. After separation, proteins were transferred to polyvinylidene difluoride membranes. The presence of transfected SK was assessed by immunoblotting using an anti-flagM2 mouse polyclonal antibody (Sigma), SK1 was detected with polyclonal anti-SK1 antibodies (30) (kindly provided by Dr. Y. Banno, Gifu University School of Medicine, Japan), SK-2 was immunorevealed employing rabbit polyclonal anti-SK2 antibodies (31), a kind gift of Dr. S. Nakamura (Dept. of Molecular and Cellular Biology, Kobe University Graduate School of Medicine, Kobe, Japan), S1P1 and S1P3 receptors were detected using subtype-specific polyclonal antibodies (Abcam). Primary antibodies were visualized by reaction with secondary horseradish peroxidase-conjugated antibodies and enhanced chemiluminescence detection (Pierce Supersignal). β-Actin was used as loading control (anti-β-actin goat polyclonal from Santa Cruz Biotechnology, Santa Cruz, CA). The data acquisition was performed using a GS-700 Imaging Densitometer (Bio-Rad). Acquired blots were elaborated using the Quantity One software (Bio-Rad).
Quantitative Real-time and Reverse Transcription-PCR
Total RNA (2 μg), extracted with TriReagent, was reverse-transcribed using Superscript II reverse transcriptase (Invitrogen) as described in the manufacturer's protocols. To detect the expression of SK1 and SK2, cDNA from A2780 and A2780/HPR cells were subjected to PCR using specific primers listed in supplemental Table 1. Data were normalized on the housekeeping genes glyceraldehyde-3-phosphate dehydrogenase and β-actin. PCR amplification products were separated by electrophoresis on a 1.2% agarose gel and the exact size evaluated by comparison with PCR 100 bp Low Ladder (Sigma).
The quantification of S1PR mRNA was performed by Real-time PCR employing TaqMan gene expression assays, using the automated ABI Prism 7700 sequence detector system (Applied Biosystems, Foster City, CA) essentially as previously described (32). Each measurement was carried out in triplicate in Micro-Amp optical 96-well plates (Applied Biosystems) with a TaqMan Universal PCR Master Mix (Applied Biosystems). Primers and probe for S1P1, S1P2, S1P3, S1P4, and S1P5 were Assay-On-Demand gene expression products (Applied Biosystems). Simultaneous amplification of the target sequence together with the housekeeping gene, 18 S rRNA, was carried out with the following universal profile: initial denaturation for 10 min at 95 °C was followed by denaturation for 15 s at 95 °C, primer annealing, and elongation at 60 °C for 1 min for 40–50 cycles. Results were analyzed by using the ABI Prism Sequence Detection System (version 1.7) (Applied Biosystems). The 2−ΔΔCt method was applied as a comparative method of quantification (33), and data were normalized to ribosomal 18 S RNA expression.
Cell Proliferation and Viability: MTT Reduction and Trypan Blue Dye Exclusion Assay
For the MTT assay, A2780, A2780/HPR, and A2780 transfectants were plated into 96-well tissue culture plates and kept in culture for up to 96 h in normal cell culture medium or under different experimental conditions as described below. For the basal proliferation, the same amount of cells were plated (2000 cells for well). After treatments, the cells were incubated at 37 °C for 1 h with 100 μl of cell culture medium containing 120 μm MTT and then lysed with 100 μl of lysis solution (10% SDS in 10 mm HCl aqueous solution) and maintained for 12 h at 37 °C. The absorbance was measured at 570 nm with a Victor plate reader instrument (PerkinElmer Life Sciences).
The number of living and dead cells has been determined by counting after Trypan blue staining, as previously described (34). Three thousand A2780, A2780/HPR, and A2780 transfectants cells were plated in 60-mm tissue culture plates. Briefly, cells were detached with phosphate-buffered saline containing 0.02% EDTA, incubated in 0.25% Trypan blue solution for 2 min and counted using a Bürker chamber. The extent of cell death was calculated as the percent of trypan blue-positive cells in each cell population.
Pharmacological Inhibition of SK
Twelve hours after seeding, A2780/HPR cells were treated or not with 10 μm SK inhibitor solubilized in cell culture medium containing 0, 5, and 10 μm of HPR. Cell proliferation and viability were estimated at different times of treatment by the MTT reduction assay and the Trypan blue dye exclusion assay, respectively, as described above.
Treatment of A2780 and A2780/HPR Cells with Agonists and Antagonists of S1P Receptors
1000–2000 A2780 or A2780/HPR cells were plated in 96-well culture plates. After 12 h, A2780 cells were treated with 1 μm SEW2871 (S1P1 agonist), or VPC24191 (S1P1/3 agonist), or S1P in culture medium containing or not 1 μm HPR; A2780/HPR cells were treated with 1 μm VPC23019 (S1P1/3 antagonist), or JTE013 (S1P2 antagonist), or CAY10444 (S1P3 antagonist), or 10 μm W146 (S1P1 antagonist) in medium containing or not 10 μm HPR; each treatment were renewed every 48 h. After 96 h, cell proliferation was assessed by MTT reduction assay as described above.
DNA Fragmentation Analysis
Analysis of genomic DNA: the analysis of genomic DNA, from A2780/HPR cells, treated or not with SK inhibitor in the presence of different HPR concentrations, was carried out using Mammalian Genomic DNA Kit (Invitrogen) according to the manufacturer's instructions. The DNA extract was quantified by absorbance at 260 nm. Equal amounts of total DNA were analyzed by agarose gel electrophoresis and detected by ethidium bromide staining. Analysis of fragmented DNA: 1-ml aliquots of phosphate-buffered saline suspension containing 3 × 10⁶ A2780/HPR cells treated as described above were centrifuged at 200 × g for 10 min at 4 °C. Cells were lysed by adding to the pellet 0.5 ml of 0.2% Triton X-100 in TE buffer, pH 7.4. To separate fragmented DNA from intact chromatin, the cell lysates were centrifuged at 20,000 × g for 10 min at 4 °C. The supernatant was removed, and the pellet was resuspended in 0.5 ml of 0.2% Triton X-100 in TE buffer, pH 7.4, and 0.1 ml of ice-cold 5 m NaCl and vigorously vortexed. Then 0.7 ml of ice-cold iso-propanol was added, vortexed vigorously, and DNA was allowed to precipitate overnight at −20 °C. DNA was recovered by centrifugation for 10 min at 20,000 × g at 4 °C. The supernatants were carefully removed, and the samples were dried. DNA was dissolved by adding to each tube 20 μl of TE solution and left at 37 °C for 12 h. Then DNA were mixed with loading buffer and heated at 65 °C for 10 min. Samples were loaded in 1% agarose gel containing ethidium bromide.
Other Procedures
Protein content was determined according to Lowry et al. (35), using bovine serum albumin as the reference standard.
Statistical Analysis
Experiments were run in triplicate, unless otherwise stated. Data are expressed as mean value ± S.D. and were analyzed by one-way analysis of variance followed by the Student-Newman-Keuls' test. p values are indicated in the legend of each figure.
RESULTS
A2780 human ovarian carcinoma cells are very sensitive to a wide array of antitumor drugs, including the synthetic retinoic acid analogue HPR. When these cells were continuously exposed to this drug, they developed resistance to it. A2780/HPR cells are a HPR-resistant clonal line obtained by culturing A2780 human ovarian carcinoma cells in the presence of increasing concentrations of HPR. A2780/HPR are not only characterized by a 10-fold increase in resistance respect to parental sensible A2780 cells but show also several phenotypic differences, including altered morphology, reduced colony-forming ability, and differential expression of adhesion, differentiation, and tumor progression markers (25) and altered sphingolipid metabolism (7).
In addition, we observed that proliferation of A2780/HPR cells was significantly higher than that of parental cells (Fig. 1). Our previous data indicated that in A2780/HPR cells the degradative pathway of sphingosine is more active than in A2780 cells (7). Sphingosine degradation requires its conversion to S1P by SK, a key enzyme in the maintaining of intracellular ceramide/S1P ratio, which is critical in the control of cell death and proliferation.
FIGURE 1.
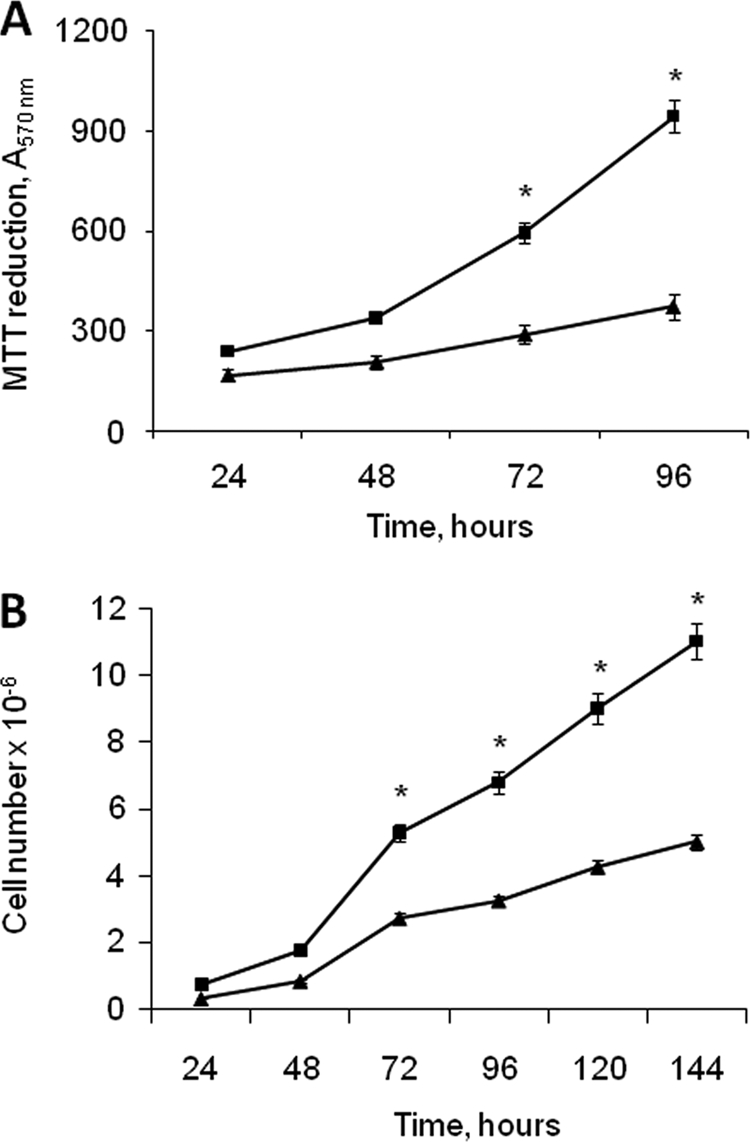
Growth of A2780 and A2780/HPR cells. At different times after seeding, the mitochondrial metabolic activity of A2780 (triangle) and A2780/HPR (square) cells was measured by the MTT reduction assay (A), and the cell number was determined by counting trypsinized cells using a Bürker counting chamber (B). Data are the means ± S.D. of three different experiments. *, p < 0.001 versus A2780 cells.
To quantitatively evaluate S1P production in the two cell lines, cells were pulsed for 45 min with [1-3H]sphingosine, cell lipids were extracted, and S1P was recovered by phase separation under alkaline conditions as previously described and analyzed by high-performance TLC followed by digital autoradiography. With a similar incorporation of the radioactive label in the two cell types, we calculated that 0.71% (0.17 ± 0.01 nCi/mg of protein) and 1.33% (0.28 ± 0.02 nCi/mg of protein) of the lipid radioactivity was associated with S1P in A2780 and A2780/HPR cells, respectively. Thus, short pulse labeling experiments with radioactive sphingosine revealed that the production of S1P is significantly higher in A2780/HPR cells versus A2780 cells (p < 0.01). Next SK activity in HPR-sensitive and -resistant A2780 cells was examined. In vitro enzyme assay performed in whole cell lysates revealed that activity of SK was increased ∼5-fold in A2780/HPR versus A2780 cells (Fig. 2A). In A2780/HPR cells, the increase in the SK activity was essentially due to the up-regulation of SK1. As shown in Fig. 2, B and C, the A2780/HPR cells displayed increased mRNA expression and protein content of SK1, whereas SK2 expression was unchanged.
FIGURE 2.

SK activity and SK isoform expression in A2780 and A2780/HPR cells. A, A2780 and A2780/HPR cells were lysed, and cell extracts were employed for SK activity determination as described under “Experimental Procedures.” Data represent the mean ± S.D. of three independent experiments performed in duplicate. The difference between A2780 and A2780/HPR cells was statistically different by the Student's t test (*, p < 0.01). B, semi-quantitative PCR analysis of SK1 and SK2 mRNA expression levels was performed in A2780 and A2780/HPR cells by simultaneous amplification of the housekeeping gene β-actin. Data are normalized versus β-actin expression and utilizing individual SK isoforms of the A2780 specimen set as 1. Data are means ± S.D. of three independent experiments performed in triplicate. C, cell extracts from A2780 and A2780/HPR cells were employed for Western analysis using anti-SK1 and anti-SK2 antibodies. Left panel: a blot representative of three independent experiments is shown. Right panel: the histogram represents mean densitometric quantification (n = 3) of SK1 and SK2 versus β-actin, reported as a percentage relative to the intensity of the band corresponding to A2780 specimen set as 100. Statistical significance was determined by the Student's t test (*, p < 0.01).
To ascertain whether proliferation of sensitive and resistant A2780 cells was dependent on the production of S1P, A2780, and A2780/HPR cell proliferation was evaluated under basal conditions or in the presence of 2-(p-hydroxyanilino)-4-(p-chlorophenyl)thiazole, a potent and highly selective pharmacological SK inhibitor. The treatment with this inhibitor effectively reduced S1P production: in A2780/HPR cells, conversion of radioactive sphingosine to S1P dropped from 0.28 ± 0.02 nCi/mg of protein in control cells to 0.06 ± 0.01 nCi/mg of protein in treated cells (p < 0.01 in inhibitor-treated versus untreated A2780/HPR cells). Treatment of A2780 and A2780/HPR cells with SK inhibitor resulted in a 3-fold reduction of cell mitochondrial metabolic activity measured by the MTT reduction assay (Fig. 3A), indicating that SK activity is essential for proliferation of both HPR-sensitive and -resistant cells. Next we checked the effect of SK inhibition on the sensitivity of A2780/HPR cells to HPR. A2780/HPR cells were treated with SK inhibitor in the presence of different HPR concentrations, and, after 96 h, the mitochondrial metabolic activity was measured by the MTT reduction assay (Fig. 3B, left), and the cell number was determined by counting trypsinized cells (Fig. 3B, right). The proliferation of A2780/HPR cells was reduced by the treatment with SK inhibitor both under basal conditions or in the presence of 5 and 10 μm HPR. However, in the presence of 10 μm HPR, a significant increase in the number of death cells (Fig. 4A) was observed in cells treated with SK inhibitor. A2780/HPR cell death upon simultaneous treatment with 10 μm HPR and SK inhibitor was hallmarked by a significant reduction of the genomic DNA content and by the appearance of DNA fragmentation (Fig. 4B). All together these data suggest that SK inhibition sensitized A2780/HPR cells to HPR-induced apoptosis. Because the antiproliferative and cytotoxic effect of HPR on A2780 cells is mediated by a HPR-induced elevation in cellular dihydroceramide levels (7, 36), a higher SK activity in resistant cells might be responsible for a reduced capability to form dihydroceramide or ceramide (i.e. to a lower dihydroceramide/S1P ratio with respect to sensitive cells upon challenge with the drug). Thus, we tested the effect of SK inhibition on the production of ceramide and dihydroceramide in A2780/HPR cells upon treatment with 10 μm HPR. The dihydroceramide and ceramide molecular species of A2780/HPR cells under basal conditions or upon treatment with HPR, SK inhibitor, or both were characterized by electron spray ionization-MS (Fig. 4C and supplemental Fig. 1). As shown in Fig. 4C, treatment with HPR alone was able to induce a sensitive increase in dihydroceramide, without affecting ceramide. Treatment with SK inhibitor as well significantly elevated cellular dihydroceramide but not ceramide levels. On the other hand, simultaneous treatment with both HPR and SK inhibitor led to a dramatic increase in dihydroceramide (significantly higher that the increased observed in the presence of HPR or SK inhibitor alone), again with no effect on ceramide. Sphingosine and sphinganine levels were also measured in A2780/HPR cells under the same experimental conditions. Under basal condition, sphingoid base levels in A2780/HPR cells were 65 ± 8 pmol/mg of protein, with sphingosine representing 85% of total sphingoid bases. HPR treatment alone or in combination with the SK inhibitor induced a marked increase in the sphinganine/sphingosine ratio. In treated samples, sphinganine represented ∼95% of total sphingoid bases, and its mass levels were increased in parallel of those of dihydroceramide. In samples treated with HPR and SK inhibitor, this corresponded to an ∼100-fold increase in sphinganine levels. These data suggest that SK inhibition sensitized A2780/HPR cells to HPR-induced dihydroceramide and sphinganine production, resulting in increased cell death.
FIGURE 3.

Effect of SK inhibitor on the proliferation of A2780 and A2780/HPR cells and on HPR sensitivity in A2780/HPR cells. A, 12 h after seeding, A2780 and A2780/HPR cells were treated with SK inhibitor (gray), and cell viability was evaluated after 96 h as mitochondrial metabolic activity measured by the MTT reduction assay. Data are expressed as percentage of the control treated with vehicle (white). B, 12 h after seeding, A2780/HPR cells were treated with SK inhibitor in the presence of different HPR concentrations and, after 96 h, the mitochondrial metabolic activity was measured by the MTT reduction assay (B, left), and cell number was determined by counting trypsinized cells using a Bürker counting chamber (B, right). Data are the means ± S.D. of three different experiments. *, p < 0.001 versus controls, cells treated with vehicle only.
FIGURE 4.

Effect of SK inhibition on HPR sensitivity and on ceramide and dihydroceramide production in A2780/HPR cells. 12 h after seeding, A2780/HPR cells were treated with SK inhibitor in the presence of different HPR concentrations and, after 96 h, the number of dead cells was evaluated by the Trypan blue exclusion assay (A, left). Data are the means ± S.D. of three different experiments. *, p < 0.01 versus controls. Non-fragmented (B, left) and fragmented DNA (B, right) was extracted as described under “Experimental Procedures.” The samples were analyzed by agarose gel electrophoresis and visualized by ethidium bromide staining (in B, right, genomic DNA was loaded on the same gel as control). C, MS analysis of ceramide and dihydroceramide content in A2780 cells resistant to HPR. Ceramide (light gray) and dihydroceramide (dark gray) content expressed as nanomoles/106 cells in 1, A2780/HPR control; 2, A2780/HPR plus HPR; 3, A2780/HPR plus SK inhibitor; 4, A2780/HPR plus HPR plus SK inhibitor; 5, SK1-overexpressing A2780; and 6, SK1-overexpressing A2780 plus HPR. Data are the means ± S.D. of three different experiments. *, p < 0.01 versus control cells. #, p < 0.025 versus SK1-overexpressing A2780.
Although S1P can act as an intracellular mediator, S1P receptors largely account for its multiple biological activities. For this reason, to obtain more information on the mechanism by which altered S1P formation mediates the onset of resistance to HPR in A2780 cells, the S1P receptor (S1PR) expression pattern was examined in parallel in HPR-sensitive and -resistant cells, by quantitative real-time PCR analysis. Data presented in Fig. 5 show strikingly different S1PR expressions between the two cell types. Interestingly, by normalizing individual S1PR mRNA content of resistant cells onto that of sensitive ones, it was clearly appreciable that a tremendous increase of S1P1 mRNA occurred in HPR-resistant cells, which was accompanied by a robust rise of S1P3 mRNA content, whereas the other S1PR subtypes were slightly reduced. These data were corroborated by Western blot analysis of S1P1 and S1P3. Indeed, the protein band corresponding to S1P1 was clearly detectable in chemoresistant cells, whereas it could not be detected in chemosensitive cells; moreover, the S1P3 protein content was sensibly augmented in HPR-resistant cells (Fig. 5A, inset). However, proliferation of A2780 and A2780/HPR cells was not affected by the treatment with different antagonists of S1PR (Fig. 5B), including antagonists selective for S1P1 (VPC23019 and W146), S1P2 (JTE013), and S1P3 (VPC23019 and CAY10444).
FIGURE 5.

Expression and effect of agonists or antagonists of S1PRs on proliferation and HPR resistance in A2780 and A2780/HPR cells. A, quantitative real-time PCR analysis was performed in A2780 and A2780/HPR by simultaneous amplification of the target S1P1, S1P2, S1P3, S1P4, and S1P5 genes together with the housekeeping gene 18 S rRNA. The mRNA quantization was based on the comparative 2−ΔΔCt method, utilizing for each receptor its expression in A2780 cells as calibrator. Data are means ± S.D. of three independent experiments performed in triplicate. Inset: cell extracts from A2780 and A2780/HPR were employed for Western analysis using anti-S1P1 or anti-S1P3 antibodies. Equally loaded protein was checked by expression of β-actin. B, 12 h after seeding, A2780 and A2780/HPR cells were treated with different antagonists of S1PRs, and cell proliferation was evaluated after 96 h as mitochondrial metabolic activity measured by the MTT reduction assay. Data are the means ± S.D. of three different experiments. C, 12 h after seeding, A2780 cells were treated with different agonists of S1PRs alone or in the presence of 1 μm HPR (left panel), and A2780/HPR cells were treated with different antagonists of S1PRs alone or in the presence of 10 μm HPR (right panel); after 96 h, the mitochondrial metabolic activity was measured by the MTT reduction assay. Data are the means ± S.D. of three different experiments.
To determine whether the role of SK in provoking resistance to HPR could be due to an increased activation of S1PR, we checked the effect of S1PR antagonists on HPR-resistant cells treated with 10 μm HPR (Fig. 5C, right), and the effect of exogenous S1P and S1PR agonists (SEW2871 for S1P1 and VPC24191 for S1P1 and S1P3) on HPR-sensitive cells treated with 1 μm HPR (Fig. 5C, left). The effect of HPR on A2780 and A2780/HPR cells was not affected by the treatment with S1PR agonists or antagonists, respectively, suggesting that the role of SK in HPR resistance in these cells is not mediated by the S1PR. Because the inefficacy of S1PR antagonist treatment on the proliferation rate could be due to inactivation of the pharmacological compounds during prolonged incubation, the ability of the antagonists to prevent S1P-dependent Akt phosphorylation after 95-h incubation was examined. Akt phosphorylation by S1P was mimicked by specific S1PR agonists such as VPC24191 or SEW2871, supporting the view that this signaling is coupled to multiple S1PRs (supplemental Fig. 2). In the same figure is shown that Akt phosphorylation at 10 min of 1 μm S1P treatment was abolished by VPC23019, strongly reduced by W146, and attenuated by JTE013, indicating that all the compounds were active.
To further substantiate the hypothesis of a role for SK1 in determining resistance to HPR in ovarian carcinoma cells, we stably overexpressed a tagged form of SK1 in A2780 cells (Fig. 6A). SK1 overexpression was accompanied by a significant increase of S1P levels, as evaluated by short pulse with [1-3H]sphingosine (radioactivity incorporation in mock transfected cells was 0.18 ± 0.01 nCi/mg of protein and 0.24 ± 0.02 nCi/mg of protein in SK1-overexpressing clones; p < 0.01 in SK1-transfected versus mock transfected A2780 cells). Wild-type, mock transfected, and SK1-overexpressing A2780 cells were treated with 1 μm HPR, and, after 96 h, HPR cytotoxicity was assessed by determining the number of dead cells (Fig. 6B). As expected, HPR treatment under these conditions caused a significant increase in cell death in wild-type and mock transfected cells. On the other hand, cell viability was not affected by HPR treatment in SK1-overexpressing A2780 cells, suggesting that SK1 is sufficient to induce HPR resistance in these cells. HPR treatment of SK1-overexpressing A2780 cells resulted in a significant rise in dihydroceramide levels, even if at a lesser extent than in A2780/HPR cells (Fig. 4C). On the other hand, treatment with HPR in SK1-overexpressing A2780 cells also induced a significant increase in the levels of ceramide, which were unaffected in A2780 and A2780/HPR cells under the same treatment. This could be due to the higher expression levels of dihydroceramide desaturase 1 observed in the SK1-overexpressing clone (supplemental Figs. 3 and 4).
FIGURE 6.

Effect of SK-1 overexpression on HPR sensitivity in A2780 cells. A2780 cells were transfected with the empty expression vector (mock transfected) or with pcDNA3-hSK1WT plasmid (SK1-overexpressing cells). A, Western blot analysis of FLAG expression in A2780 transfectants. Equal amount of proteins of A2780, mock, and SK1-overexpressing cells were loaded onto SDS-PAGE and then blotted onto a polyvinylidene difluoride membrane, and the overexpressed SK1 tagged with FLAG M2 epitope was detected by anti-FLAG M2 antibody. B, 12 h after seeding, A2780 and A2780 transfectants (one mock and 3 SK1-overexpressing clones, 1, 2, and 3) were treated with 1 μm HPR. After 48 h, the total cell number was determined by counting trypsinized cells using a Bürker counting chamber, and the number of dead cells was evaluated by the Trypan blue exclusion test. Data are presented as the percentage of the total counted cells and are the means ± S.D. of three different experiments. *, p < 0.01 versus A2780 cells.
Finally, to obtain a more complete picture of the sphingolipid metabolism in all the cell lines studied, the gene expression of the major enzymes involved in the sphingolipid metabolic pathway were examined by reverse transcription-PCR (supplemental Fig. 3) and quantitative real-time reverse transcription-PCR (supplemental Fig. 4). Significant changes in the mRNA expression were detected only for SMS2, that was more expressed in A2780/HPR cells, and dihydroceramide desaturase 1, whose expression was significantly higher in SK1-overexpressing A2780 cells. Signals for neutral ceramidase, alkaline ceramidase 1, and ceramide synthase 3 were hardly detectable in our samples.
DISCUSSION
The cytotoxic and/or antiproliferative effect of many antitumor drugs is at least in part a consequence of the drug-elicited increase in the cellular levels of the sphingolipid ceramide, a potent mediator of apoptosis and an inhibitor of cell proliferation in a variety of tumor cell lines. This is the case also for HPR, whose antiproliferative effect in neuroblastoma, leukemia, breast, ovarian (including A2780 human ovarian carcinoma cells, the experimental model used in this paper), prostate, and colon carcinoma cell lines has been associated with induction of apoptosis, which is accompanied by increases in ceramide. Ceramide production in HPR-treated tumor cells is somehow peculiar, because it has been suggested that the most relevant mechanism for HPR-induced ceramide generation might be the de novo biosynthesis (HPR is indeed a potent activator of serine palmitoyltransferase and dihydroceramide synthases, the key enzymes in the early steps of ceramide biosynthesis), whereas for many other antitumor drugs sphingomyelin hydrolysis due to the activation of sphingomyelinases is the main source of pro-apoptotic ceramide. Moreover, it has been demonstrated that dihydroceramide, rather than ceramide, accumulates in HPR-treated tumor cells, due to the inhibitory effect of this retinoid on dihydroceramide desaturase (22, 24, 37). Indeed we recently showed by electrospray ionization-MS analysis that dihydroceramide and not ceramide is increased upon treatment of A2780 cells with HPR (36). In addition, recent observations suggest that HPR cytotoxicity might at least in part due to the elevation of cellular sphinganine levels (24). Independently from the mechanism underlying the production of cytotoxic (dihydro)ceramide upon chemotherapeutic treatments, it has been suggested that the acquired resistance to chemotherapeutic drugs in tumors and tumor cell lines can be ascribed to alterations in sphingolipid metabolism leading to a reduced potential for dihydroceramide formation or an increased clearance of dihydroceramide. In particular, multidrug-resistant tumors and tumor cell lines are characterized by high levels of glucosylceramide, because of the consequence of the increased expression or activation of glucosylceramide synthase, and ceramide glycosylation by this enzyme as a way to thwart drug-induced dihydroceramide accumulation and to prevent dihydroceramide-induced cell death has been convincingly documented by many previous studies. On the other hand, dihydroceramide is the pivot of a very complex metabolic network, and many different pathways can potentially contribute to the regulation of cellular ceramide levels and could be involved in the increased ability of drug-resistant cells to scavenge ceramide. Clues supporting this hypothesis come from the observation that it is clearly emerging that increased conversion of ceramide into glucosylceramide is not the only alteration in sphingolipid metabolism occurring in tumor cells upon acquisition of drug resistant phenotypes (2).
Short-chain ceramide is cytotoxic for A2780 human ovarian carcinoma cells (7), and these cells respond to HPR treatment with a robust production of dihydroceramide (36), likely due to its increased biosynthesis, with a concomitant reduction of cell proliferation and induction of apoptosis. On the other hand, HPR induced a much lesser response in terms of dihydroceramide production in the derived HPR-resistant clonal cell line, A2780/HPR. In these cells, glucosylceramide synthase expression and glucosylceramide levels are not changed with respect to those in sensitive parental cells. However, overall alterations in sphingolipid metabolism were observed in the resistant cell line, including an increased catabolic turnover of ceramide (7).
It is well established that S1P is endowed with properties opposite to those displayed by ceramide and possibly by dihydroceramide, being able to stimulate cell survival and proliferation. The opposing directions of ceramide- and S1P-mediated signaling generated the concept of a ceramide/S1P rheostat in which the ratio between these two lipids could play a relevant role in determining the cell fate. Compelling evidence is in favor of a key role of SK, which catalyzes S1P formation, in the regulation of cellular ceramide/S1P balance. Notably, in agreement with this notion, this study shows that altered sphingolipid metabolism displayed by A2780/HPR cells, whose proliferation is higher respect to A2780 cells, was characterized by enhanced formation of S1P (Fig. 2). Moreover, the activity of SK was remarkably augmented in these cells as result of SK1 up-regulation (Fig. 2). Together with our previous observation, that in A2780/HPR cells the degradation of sphingosine occurs at a higher rate than in A2780 cells (7), these data support the view that the augmented catabolism of dihydroceramide due to SK1 higher activity in A2780/HPR cells impedes the accumulation of the toxic lipid in response to drug treatment. More importantly, pharmacological inhibition of SK strongly reduced S1P formation in HPR-resistant cells and concurrently was found capable of rescuing their sensitivity to HPR treatment due to increased HPR-mediated dihydroceramide production (Fig. 4), indicating that the shift toward S1P formation, which takes place in HPR cells, is a critical event for the appearance of chemoresistance in A2780 ovarian cancer cells. This notion was further strengthened by the finding that enhanced S1P formation subsequent to ectopic expression of SK1 rendered A2780 cells less sensitive to HPR (Fig. 6).
Sphinganine production was also enhanced by HPR treatment, and a possible contribution of sphinganine to HPR-induced toxicity has been recently suggested (24). Obviously, increased SK activity associated with HPR resistance would be effective in scavenging sphinganine as well. Thus, even if the role of different sphingolipid mediators in HPR-induced cell death deserves further investigation, our data support the importance of SK in resistance to HPR. The here highlighted critical reliance on enhanced SK activity of ovarian cancer cell resistance to the chemotherapeutic HPR drug is in full agreement with previous reports in camptothecin- and docetaxel-resistant prostate cancer cells (14, 38), oxaliplatin-resistant colon cancer cells (15), and gemcitabine-resistant pancreatic cancer cells (17), corroborating the notion that up-regulation of SK and a concomitant decrease of the levels of sphingolipid mediators upstream of SK represent common features of resistant tumor cells.
In keeping with the pro-growth signal borne by SK (39), its inhibition reduced the proliferation rate of A2780 cells, independently of their sensitivity to HPR (Fig. 3). Thus, a pharmacological intervention that addresses SK in these cells appears to be especially efficacious, being capable of reducing cell proliferation and simultaneously counteracting drug resistance.
Inhibition of individual S1PR subtypes by specific antagonists did not affect cell sensitivity to HPR, ruling out their involvement in this cell behavior (Fig. 5). Moreover, S1PR were found to be disengaged also from the regulation of cell proliferation, which was modulated by SK activity (Fig. 5). Hence, these findings strongly support a primary role of reduced dihydroceramide production in mediating the resistance of A2780 cells to HPR, although the participation of S1P as intracellular mediator capable of addressing directly or indirectly elements of the anti-apoptotic machinery cannot be excluded. Despite the function of S1PR lacking in A2780 chemoresistance, the pattern of S1PR in A2780/HPR cells was found to be profoundly modified in comparison to parental cells. In particular, S1P1 mRNA was extraordinarily augmented, whereas S1P3 was significantly up-regulated (Fig. 5). Intriguingly, the same receptor subtypes were highly increased in chemotherapy-resistant prostate cancer cells, but, at variance, they were implicated in mediating cell proliferation (38). Because these receptors have been found to be coupled to key biological functions, such as cell motility and cell adhesion, their differential expression could account for specific behavior of these cancer cell lines, and it will be important to address this possibility in future studies.
Supplementary Material
Acknowledgment
We are indebted to Dr. Stuart M. Pitson (Molecular Signaling Laboratory, Hanson Institute and Division of Human Immunology, Institute of Medical and Veterinary Science, Adelaide, Australia) for providing the pcDNA3-hSphK1-FLAG plasmid.
This work was supported by the Mizutani Foundation for Glycoscience Grant 070002 (to A. P.) and Associazione Italiana per la Ricerca sul Cancro Grant 2007 (to S. S.).

The on-line version of this article (available at http://www.jbc.org) contains supplemental Figs. 1–4, Table 1, text, and additional references.
- GM3
- NeuAcα2,3Galβ1,4Glcceramide (ganglioside and glycosphingolipid nomenclature is in accordance with the IUPAC-IUBMB recommendations (40))
- HPR
- 4-[3,7-dimethyl-9-(2,6,6-trimethyl-1-cyclohexen-1-yl)-2,4,6,8-nonatetraenamido]-1-hydroxybenzene
- MTT
- 3-(4,5-dimethylthiazol-2-yl)-2,5-diphenyltetrazolium bromide
- S1P
- sphingosine 1-phosphate
- S1PR
- S1P receptor
- SK
- sphingosine kinase.
REFERENCES
- 1.Kolesnick R., Golde D. W. (1994) Cell 77, 325–328 [DOI] [PubMed] [Google Scholar]
- 2.Liu Y. Y., Han T. Y., Giuliano A. E., Cabot M. C. (2001) FASEB J. 15, 719–730 [DOI] [PubMed] [Google Scholar]
- 3.Liu Y. Y., Han T. Y., Giuliano A. E., Cabot M. C. (1999) J. Biol. Chem. 274, 1140–1146 [DOI] [PubMed] [Google Scholar]
- 4.Gouazé V., Yu J. Y., Bleicher R. J., Han T. Y., Liu Y. Y., Wang H., Gottesman M. M., Bitterman A., Giuliano A. E., Cabot M. C. (2004) Mol. Cancer Ther. 3, 633–639 [PubMed] [Google Scholar]
- 5.Liu Y. Y., Han T. Y., Yu J. Y., Bitterman A., Le A., Giuliano A. E., Cabot M. C. (2004) J. Lipid Res. 45, 933–940 [DOI] [PubMed] [Google Scholar]
- 6.Gouaze-Andersson V., Cabot M. C. (2006) Biochim. Biophys. Acta 1758, 2096–2103 [DOI] [PubMed] [Google Scholar]
- 7.Prinetti A., Basso L., Appierto V., Villani M. G., Valsecchi M., Loberto N., Prioni S., Chigorno V., Cavadini E., Formelli F., Sonnino S. (2003) J. Biol. Chem. 278, 5574–5583 [DOI] [PubMed] [Google Scholar]
- 8.Olivera A., Rosenfeldt H. M., Bektas M., Wang F., Ishii I., Chun J., Milstien S., Spiegel S. (2003) J. Biol. Chem. 278, 46452–46460 [DOI] [PubMed] [Google Scholar]
- 9.Bassi R., Anelli V., Giussani P., Tettamanti G., Viani P., Riboni L. (2006) Glia 53, 621–630 [DOI] [PubMed] [Google Scholar]
- 10.Wamhoff B. R., Lynch K. R., Macdonald T. L., Owens G. K. (2008) Arterioscler. Thromb. Vasc. Biol. 28, 1454–1461 [DOI] [PMC free article] [PubMed] [Google Scholar]
- 11.Fieber C. B., Eldridge J., Taha T. A., Obeid L. M., Muise-Helmericks R. C. (2006) Exp. Cell Res. 312, 1164–1173 [DOI] [PubMed] [Google Scholar]
- 12.Hannun Y. A. (1996) Science 274, 1855–1859 [DOI] [PubMed] [Google Scholar]
- 13.Spiegl-Kreinecker S., Buchroithner J., Elbling L., Steiner E., Wurm G., Bodenteich A., Fischer J., Micksche M., Berger W. (2002) J. Neurooncol. 57, 27–36 [DOI] [PubMed] [Google Scholar]
- 14.Pchejetski D., Doumerc N., Golzio M., Naymark M., Teissié J., Kohama T., Waxman J., Malavaud B., Cuvillier O. (2008) Mol. Cancer Ther. 7, 1836–1845 [DOI] [PubMed] [Google Scholar]
- 15.Nemoto S., Nakamura M., Osawa Y., Kono S., Itoh Y., Okano Y., Murate T., Hara A., Ueda H., Nozawa Y., Banno Y. (2009) J. Biol. Chem. 284, 10422–10432 [DOI] [PMC free article] [PubMed] [Google Scholar]
- 16.Schnitzer S. E., Weigert A., Zhou J., Brüne B. (2009) Mol. Cancer Res. 7, 393–401 [DOI] [PubMed] [Google Scholar]
- 17.Guillermet-Guibert J., Davenne L., Pchejetski D., Saint-Laurent N., Brizuela L., Guilbeau-Frugier C., Delisle M. B., Cuvillier O., Susini C., Bousquet C. (2009) Mol. Cancer Ther. 8, 809–820 [DOI] [PubMed] [Google Scholar]
- 18.Bonanni B., Lazzeroni M., Veronesi U. (2007) Expert Rev. Anticancer. Ther. 7, 423–432 [DOI] [PubMed] [Google Scholar]
- 19.Hail N., Jr., Kim H. J., Lotan R. (2006) Apoptosis 11, 1677–1694 [DOI] [PubMed] [Google Scholar]
- 20.Wang H., Maurer B. J., Reynolds C. P., Cabot M. C. (2001) Cancer Res. 61, 5102–5105 [PubMed] [Google Scholar]
- 21.Wang H., Charles A. G., Frankel A. J., Cabot M. C. (2003) Urology 61, 1047–1052 [DOI] [PubMed] [Google Scholar]
- 22.Zheng W., Kollmeyer J., Symolon H., Momin A., Munter E., Wang E., Kelly S., Allegood J. C., Liu Y., Peng Q., Ramaraju H., Sullards M. C., Cabot M., Merrill A. H., Jr. (2006) Biochim. Biophys. Acta 1758, 1864–1884 [DOI] [PubMed] [Google Scholar]
- 23.Kraveka J. M., Li L., Szulc Z. M., Bielawski J., Ogretmen B., Hannun Y. A., Obeid L. M., Bielawska A. (2007) J. Biol. Chem. 282, 16718–16728 [DOI] [PMC free article] [PubMed] [Google Scholar]
- 24.Wang H., Maurer B. J., Liu Y. Y., Wang E., Allegood J. C., Kelly S., Symolon H., Liu Y., Merrill A. H., Jr., Gouazé-Andersson V., Yu J. Y., Giuliano A. E., Cabot M. C. (2008) Mol. Cancer Ther. 7, 2967–2976 [DOI] [PubMed] [Google Scholar]
- 25.Appierto V., Cavadini E., Pergolizzi R., Cleris L., Lotan R., Canevari S., Formelli F. (2001) Br. J. Cancer 84, 1528–1534 [DOI] [PMC free article] [PubMed] [Google Scholar]
- 26.Pitson S. M., Moretti P. A., Zebol J. R., Xia P., Gamble J. R., Vadas M. A., D'Andrea R. J., Wattenberg B. W. (2000) J. Biol. Chem. 275, 33945–33950 [DOI] [PubMed] [Google Scholar]
- 27.Riboni L., Viani P., Tettamanti G. (2000) Methods Enzymol. 311, 656–682 [DOI] [PubMed] [Google Scholar]
- 28.Valsecchi M., Mauri L., Casellato R., Prioni S., Loberto N., Prinetti A., Chigorno V., Sonnino S. (2007) J. Lipid Res. 48, 417–424 [DOI] [PubMed] [Google Scholar]
- 29.Olivera A., Rosenthal J., Spiegel S. (1994) Anal. Biochem. 223, 306–312 [DOI] [PubMed] [Google Scholar]
- 30.Murate T., Banno Y. K., T.-Koisumi K., Watanabe K., Mori N., Wada A., Igarashi Y., Takagi A., Kojima T., Asano H., Akao Y., Yoshida S., Saito H., Nozawa Y. (2001) J. Histochem. Cytochem. 49, 845–855 [DOI] [PubMed] [Google Scholar]
- 31.Igarashi N., Okada T., Hayashi S., Fujita T., Jahangeer S., Nakamura S. (2003) J. Biol. Chem. 278, 46832–46839 [DOI] [PubMed] [Google Scholar]
- 32.Donati C., Nincheri P., Cencetti F., Rapizzi E., Farnararo M., Bruni P. (2007) FEBS Lett. 581, 4384–4388 [DOI] [PubMed] [Google Scholar]
- 33.Livak K. J., Schmittgen T. D. (2001) Methods 25, 402–408 [DOI] [PubMed] [Google Scholar]
- 34.Mehlen P., Rabizadeh S., Snipas S. J., Assa-Munt N., Salvesen G. S., Bredesen D. E. (1998) Nature 395, 801–804 [DOI] [PubMed] [Google Scholar]
- 35.Lowry O. H., Rosebrough N. J., Farr A. L., Randall R. J. (1951) J. Biol. Chem. 193, 265–275 [PubMed] [Google Scholar]
- 36.Valsecchi M., Aureli M., Mauri L., Illuzzi G., Chigorno V., Prinetti A., Sonnino S. (2010) Journal of Lipid Research., in press [DOI] [PMC free article] [PubMed] [Google Scholar]
- 37.Merrill A. H., Jr., Stokes T. H., Momin A., Park H., Portz B. J., Kelly S., Wang E., Sullards M. C., Wang M. D. (2009) J. Lipid Res. 50, (suppl.) S97–S102 [DOI] [PMC free article] [PubMed] [Google Scholar]
- 38.Akao Y., Banno Y., Nakagawa Y., Hasegawa N., Kim T. J., Murate T., Igarashi Y., Nozawa Y. (2006) Biochem. Biophys. Res. Commun. 342, 1284–1290 [DOI] [PubMed] [Google Scholar]
- 39.Vadas M., Xia P., McCaughan G., Gamble J. (2008) Biochim. Biophys. Acta 1781, 442–447 [DOI] [PubMed] [Google Scholar]
- 40.IUPAC-IUBMB, JCo. B. N. (1998) Carbohydr. Res. 312, 167–175 [Google Scholar]
Associated Data
This section collects any data citations, data availability statements, or supplementary materials included in this article.