

Abstract
Despite the considerable beneficial effects of n-3 and n-6 very long chain polyunsaturated fatty acids (VLC-PUFAs), very little is known about the factors that regulate their uptake and intracellular distribution in living cells. This issue was addressed in cells expressing liver-type fatty acid-binding protein (L-FABP) by real time multiphoton laser scanning microscopy of novel fluorescent VLC-PUFAs containing a conjugated tetraene fluorophore near the carboxyl group and natural methylene-interrupted n-3 or n-6 grouping. The fluorescent VLC-PUFAs mimicked many properties of their native nonfluorescent counterparts, including uptake, distribution, and metabolism in living cells. The unesterified fluorescent VLC-PUFAs distributed either equally in nuclei versus cytoplasm (22-carbon n-3 VLC-PUFA) or preferentially to cytoplasm (20-carbon n-3 and n-6 VLC-PUFAs). L-FABP bound fluorescent VLC-PUFA with affinity and specificity similar to their nonfluorescent natural counterparts. Regarding n-3 and n-6 VLC-PUFA, L-FABP expression enhanced uptake into the cell and cytoplasm, selectively altered the pattern of fluorescent n-6 and n-3 VLC-PUFA distribution in cytoplasm versus nuclei, and preferentially distributed fluorescent VLC-PUFA into nucleoplasm versus nuclear envelope, especially for the 22-carbon n-3 VLC-PUFA, correlating with its high binding by L-FABP. Multiphoton laser scanning microscopy data showed for the first time VLC-PUFA in nuclei of living cells and suggested a model, whereby L-FABP facilitated VLC-PUFA targeting to nuclei by enhancing VLC-PUFA uptake and distribution into the cytoplasm and nucleoplasm.
Keywords: Eicosanoids/Arachidonic Acid; Lipid/Docosahexaenoic Acid, DHA; Lipid/Eicosapentaenoic Acid; Lipid/Transport; Methods/Microscopic Imaging; Nucleus/Nuclear Transport; Protein/Binding/Fatty Acid; Receptors/Nuclear
Introduction
Humans cannot synthesize n-3 and n-6 VLC-PUFAs2 and must therefore obtain these essential fatty acids from the diet (1–5). The n-3 and n-6 VLC-PUFAs impact key physiological processes that regulate the levels of blood lipids, cardiovascular and immune function, insulin action, brain development, and neuronal as well as retinal function (2). Dietary VLC-PUFA supplementation, especially fish oil (rich in 20:5n-3 and 22:6n-3) significantly increases the 20:5n-3 and 22:6n-3 pool size and elicits beneficial effects in chronic diseases such as insulin resistance, cardiovascular disease, and cancer (2). VLC-PUFAs influence membrane structure and function, serve as substrates for eicosanoids involved in signaling, and regulate nuclear gene expression (2, 6, 7).
In contrast to our knowledge of saturated fatty acid uptake, cytoplasmic transport, intracellular distribution, and targeting (6, 8–17), there is a significant gap in our understanding of the factors that regulate uptake, transport, and intracellular distribution of very long chain fatty acids, especially n-3 and n-6 VLC-PUFA, in living cells and of the role of liver fatty-acid binding protein (L-FABP). Based on a common role established for the cytoplasmic L-FABP in facilitating the uptake, intracellular transport, and nuclear targeting of saturated fatty acids (6, 8, 13–17), it is postulated that L-FABP may have a similar function for n-3 and n-6 VLC-PUFAs. This possibility is supported by the fact that L-FABP binds n-3 and n-6 VLC-PUFAs with high affinity (Kd ∼10−8 to 10−7 m) and protects VLC-PUFAs (e.g. 20:4n-6) from intracellular peroxidation (1, 18, 19).
To examine these questions in living cells, several families of fluorescent PUFAs have been synthesized (e.g. C18 parinaric acids; C16, C18, and C22 pentaenoic acids). However, the conjugated tetraene or pentaene fluorophores in these probes are localized in the methyl-terminal half of the fatty acid, a position not consistent with the methylene-interrupted n-3 or n-6 grouping present in naturally occurring n-3 and n-6 VLC-PUFAs (20–22). Consequently, fluorescent PUFA analogues such as the parinaric acids imperfectly monitor uptake of fatty acids, L-FABP-mediated fatty acid uptake, esterification, and intracellular distribution in living cells (16, 23, 24). Likewise, the pattern of L-FABP affinities for n-3 and n-6 VLC-PUFA (20:4n-6 and 22:6n-3) established by displacement of parinaric acids does not reflect that established by other assays (1, 18, 19, 25).
The purpose of this study was to overcome these issues by use a different family of fluorescent n-3 and n-6 VLC-PUFAs recently developed by Smith and co-workers (26, 27) where the conjugated tetraene fluorophore was positioned near the carboxylate and natural methylene-interrupted n-3 or n-6 grouping. As shown here, these fluorescent VLC-PUFAs were taken up and metabolized to esterified lipids similarly as their nonfluorescent counterparts. MPLSM real time imaging and quantitative analysis of n-3 and n-6 VLC-PUFA uptake and intracellular distribution revealed that the VLC-PUFAs were rapidly taken up and quickly targeted to nuclei, nuclear envelope membranes, and nucleoplasm of living cells. These studies are important because they provide for the first time a dynamic visual yet quantitative approach not available for native VLC-PUFAs for the purpose of examining not only 20:4n-6, 20:5n-3, and 22:6n-3 whole cell uptake kinetics but also kinetics involving the cytoplasm, nucleoplasm, nuclear envelope, and total nucleus in real time. Finally, it was shown that L-FABP regulated the uptake, intracellular distribution, and metabolism of the fluorescent VLC-PUFAs in living cells.
EXPERIMENTAL PROCEDURES
Materials
Newly synthesized polyunsaturated fatty acids, which included the 20:5n-6 fatty acid probe 5E,7E,9E,11Z,14Z-eicosapentaenoic acid (A5c), the 20:6n-3 fatty acid probe 5E,7E,9E,11Z,14Z,17Z-eicosahexanoic acid (E6c), and the 22:7n-3 fatty acid probe 4E,6E,8E,10Z,13Z,16Z,19Z-docosaheptaenoic acid (D7c), were prepared as described previously (26). The naturally occurring polyunsaturated fatty acid, cis-parinaric acid, was purchased from Invitrogen as a 3 mm solution in deoxygenated ethanol with butylated hydroxytoluene. Stock solutions of the probes dissolved in anhydrous ethanol with 1–2% butylated hydroxytoluene were stored at −80 °C under N2. Concentrations of every solution were determined by absorbance measurements at 303 nm with a Cary 100 UV-visible dual beam spectrophotometer (Varian Instruments, Walnut Creek, CA) and utilization of extinction coefficients (20, 26). The fluorescent organelle markers, Nile Red, ER Tracker Green; NBD-C6-ceramide, MitoTracker Green, and LysoTracker Green were purchased from Invitrogen. The n-3 and n-6 nonfluorescent PUFAs, arachidonic acid (20:4n-6), 5,8,11,14,17-eicosapentaenoic acid (20:5n-3), and 4,7,10,13,16,19-docosahexaenoic acid (22:6n-3), were purchased from Sigma. The radiolabeled n-3 and n-6 nonfluorescent PUFAs, [1-14C]arachidonic acid (54.3 mCi/mmol), 5,8,11,14,17-[1-14C]eicosapentaenoic acid (56.2 mCi/mmol), and 4,7,10,13,16,19-[1-14C]docosahexaenoic acid (56.7 mCi/mmol) were purchased from Moravek Biochemicals, Inc. (Brea, CA).
Recombinant L-FABP
The bacterial expression clone for recombinant rat liver L-FABP was generously provided by Dr. David Wilton (University of Southampton, UK) and Dr. John Kennedy (British Technology Group Ltd., London, UK). Production and purification of delipidized rat liver recombinant L-FABP were completed as described previously (28). The protein concentrations were determined by Bradford assay and corrected based on quantitative amino acid analysis (29).
Cell Culture
Control (mock-transfected) murine arpt−tk− L-cell fibroblasts and L-cells transfected with cDNA encoding for L-FABP were prepared and grown in Higuchi medium supplemented with 10% bovine serum albumin (30). As shown by Western blotting and comparison with purified L-FABP standards, L-FABP represented 0.4% of protein in L-FABP-expressing cells well within the physiological range.
Direct Fluorescence Binding Assay
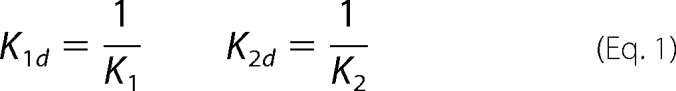
The direct binding of the fluorescent PUFA analogues to L-FABP was observed as enhancement of fluorescence with increasing concentration of ligand. Briefly, L-FABP (0.18 μm in 2 ml of phosphate-buffered saline, pH 7.4) was titrated with increasing ligand over the concentration range of 0–2.6 μm. The binding assays were performed using a PC1 photon counting spectrofluorometer with Vinci 1.5 software (ISS Inc., Champaign, IL). The excitation monochromator was set at 303 nm with a 4-nm bandwidth, and the emission from the solution at 24 °C was detected in L format using a KV389 long pass filter. The protein ± ligand intensity values were corrected for background (buffer and protein) as well as for ligand only in buffer. Because of the tendency of these probes to photobleach and degrade with time in buffers, only two concentration points (equilibration for 2 min) were collected per solution, a low and high titration (e.g. 0.01 μm and then 1.0 μm of ligand). The concentration was incrementally stepped (e.g. 0.02 μm and then 1.2 μm). The dissociation constants (Kd) were calculated in SigmaPlot 8.02 (SPSS, Chicago) utilizing a two-site sequential binding model because L-FABP has a cylindrical type binding pocket with a high affinity binding site in the innermost part of the cavity and a secondary site of lower affinity wherein another ligand can bind sequentially (1, 28, 31, 32). The two equilibria binding constants, K1 (high affinity) and K2 (low affinity), were converted to the dissociation constants by Equation 1 as described previously (1, 33).
 |
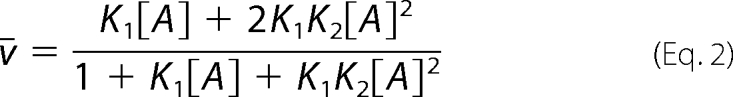
In Equations 2 and 3, the relationship between the free fatty acid concentration [A] and the average number of fatty acid molecules bound per protein molecule, ν̄ is shown,
 |
where
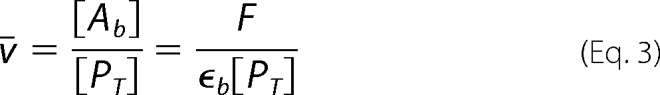 |
F is the approximate fluorescence due to the bound fatty acid; [PT] is the L-fabp concentration of 0.18 μm, and ϵb is a pseudo-molar fluorescence coefficient. The parameter, ϵb, was measured by reverse titration of L-FABP (0–2.0 μm) into a buffer containing 0.18 μm of the fluorescent PUFA. F is the approximate fluorescence due to the bound fatty acid that is calculated by subtracting the corrected fluorescence of the fatty acid in buffer alone from the corrected fluorescence of the fatty acid with protein. By fitting the resultant curve to a one-site saturation ligand binding model, the saturation limit, FPMAX, was determined. Thus, the parameter, ϵb = FPMAX/0.18 (units of photon counts/μm), was inserted into Equation 3 to obtain [Ab] and ν̄. The concentration of unbound PUFA, [A], was simply the result of subtracting the concentration of bound PUFA from the total PUFA concentration.
Metabolism of Fluorescent VLC-PUFAs to Esterified Lipids in Control and L-FABP-expressing L-cells
To examine fluorescent n-3 and n-6 VLC-PUFA metabolism, control L-cells and L-FABP-expressing L-cells were incubated with 2.5 μm A5c, E6c, or D7c (in Puck's buffer with 2.5 μm bovine serum albumin) at 37 °C in a CO2 (5%) incubator for 5, 15, 30 min, or overnight. Buffer was removed, and the cells were washed twice with 2 ml of Puck's buffer (with 2.5 μm bovine serum albumin). The cells were frozen by floating the cell culture dish on a dry ice/i-PrOH bath; cells were scraped with i-PrOH, and lipids were extracted twice with 2.5 ml of HIP (hexane/i-PrOH = 3:2) as described previously (34). Lipid extracts were resolved into individual lipid classes utilizing an Agilent 1100 HPLC system (Agilent, Santa Clara, CA) coupled with a Luna silica normal phase column (150 × 2.0 mm, 3 μm particle size) from Phenomenex (Torrance, CA). PUFAs and the metabolites were detected using the Agilent 1100 fluorescence detector (excitation 303 nm and emission 420 nm). The solvent systems, A–D, consisted of the following: solvent A, hexane/i-PrOH:HOAc = 98.7:1.2:0.1; solvent B, hexane; solvent C, hexane/i-PrOH = 1:1; solvent D, hexane/i-PrOH/H2O = 47:47:6 with Et3N 10 μl/liter. To analyze the neutral lipids (CE, TG, FFA, etc.), lipid extracts in HIP were diluted with solvent A by 1:5, and 10 μl was injected onto an HPLC column maintained at 40 °C in a column heater. The neutral lipids were separated by pumping 80% solvent A, 20% solvent B at 0.1 ml/min for 20 min. Solvent C followed by solvent D was pumped through the column at 0.4 ml/min to wash the phospholipids off the column. To analyze the phospholipids, the lipid extracts in 10 μl of HIP were directly injected onto the HPLC without dilution and were separated by pumping 100% solvent D at 0.3 ml/min for 30 min, whereas the column was maintained at 35 °C in the column heater. The peaks were integrated using the Agilent ChemStation software with the quantitation made by comparison with standard curves derived from known amounts of the VLC-PUFAs A5c, E6c, and D7c.
Uptake and Metabolism to Esterified Lipids of Nonfluorescent VLC-PUFAs in Control and L-FABP-expressing L-cells
Cells were grown in 35-mm dishes (5 × 10⁵ cells/dish) for 2 days. Cells were incubated with 0.05 μCi of radiolabeled n-3 or n-6 nonfluorescent PUFAs [1-14C]arachidonic acid, 5,8,11,14,17-[1-14C]eicosapentaenoic acid, and 4,7,10,13,16,19-[1-14C]docosahexaenoic acid and diluted with the corresponding unlabeled n-3 or n-6 VLC-PUFA to a final concentration of 2.5 μm in Puck's buffer with 2.5 μm bovine serum albumin for 5 min or overnight. Cells were frozen and scraped, and the lipids were extracted as described above for fluorescent n-3 and n-6 VLC-PUFA, resolved by thin layer chromatography, identified by comparison with standards on the same plate, and scraped, and radioactivity was counted as described previously (35).
L-Cell Labeling with Fluorescent VLC-PUFA and Organelle Markers
To study the intracellular localization/distribution of fluorescent n-3 and n-6 VLC-PUFA in living cells, L-cells were double-labeled with E6c and one of the following fluorescent markers: Nile Red, lipid droplet marker; ER Tracker; NBD-C6-ceramide, Golgi marker; MitoTracker Green, and LysoTracker Green. L-cells were grown to near confluency in Higuchi medium supplemented with 10% fetal bovine serum on NUNC Lab-Tek two-chambered coverglass (VWR, West Chester, PA) for 2 days in an incubation chamber as described previously (16, 34, 36). L-cells were first incubated with E6c (1.25 μm in Puck's buffer containing 2.5 μm bovine serum albumin) for 3 h in the presence of vitamin E (100 μm) as antioxidant, and then cells were washed and incubated at 37 °C in dye-free Puck's buffer for another 3–5 h so the n-3 and n-6 VLC-PUFAs were esterified to glycerides and cholesteryl esters. The cells were then labeled with fluorescent organelle markers following the manufacturer's instructions unless otherwise specified. The dye concentrations and incubation times were optimized as follows: (a) Nile Red, 1 ml of 100 nm solution in Puck's buffer at 37 °C for 30 min; (b) NBD-C6-ceramide, 1 ml of 125 nm solution in Hanks' balanced salt solution buffer at 4 °C for 30 min, and dye solution was removed, and cells were washed with phosphate-buffered saline and incubated in dye-free Puck's buffer for another 30 min at 37 °C; (c) ER Tracker Green, 1 ml of 0.1 μm in Hanks' balanced salt solution buffer at 37 °C for 15 min; (d) MitoTracker Green, 1 ml of 100 nm in Hanks' balanced salt solution buffer at 37 °C for 20 min; and (e) LysoTracker Green, 1 ml of 50 nm solution at 37 °C for 15 min. After each organelle labeling, cells were washed with phosphate-buffered saline and imaged in Puck's buffer at room temperature.
MPLSM of Fluorescent VLC-PUFA
MPLSM imaging was performed using a Bio-Rad MRC-1024MP laser scanning microscopy system (Zeiss, Thornwood, New York) as follows: (i) a Zeiss Axiovert 135 inverted microscope with Zeiss 63× 1.4 N.A. Plan-Apochromat (Zeiss, Thornwood, New York) oil immersion objective; (ii) a Coherent Mira 900F Titanium:Sapphire laser (Coherent, Inc., Santa Clara, CA) pumped by a Spectra-Physics Millenia X (Spectra-Physics, Mountain View, CA) tuned to 900 nm; and (iii) a three-channel photomultiplier external detection system designed by Warren Zipfel (Cornell University, Ithaca, NY) with three dichroics that provided for detection of fluorescence from up to three probes. Fluorescence from the UV VLC-PUFAs, which emit over the range of 380–500 (peaked around 420 nm), was collected through a HQ430/100 dichroic filter (Chroma Technology, Bellows Falls, VT). The fluorescence of SYTO 11, which emits over the range of 500–600 (peaked at ∼525 nm), was collected through an HQ525/50 dichroic filter (Chroma Technology, Bellows Falls, VT).
Fluorescent VLC-PUFA Cellular Uptake and Nuclear Distribution by Real Time Using MPLSM
To determine in real time the uptake and nuclear distribution of the fluorescent n-3 and n-6 VLC-PUFA in living cells as well as the effects of L-FABP expression, MPLSM experiments were performed with the three fluorescent n-3 and n-6 VLC-PUFA analogues. Murine L-cells were grown to near confluency in Higuchi medium supplemented with 10% fetal bovine serum on Lab-Tek chambered coverglass (Nunc, Rochester, NY) for 2 days in an incubation chamber as described previously (16, 34, 36). Prior to imaging, the cells were washed with Puck's buffer, pH 7.4, and allowed to stabilize for 5 min in the buffer on a heated microscope stage kept at 37 °C. Fatty acid uptake was then initiated by addition of each fatty acid (0–10 μm). Time course acquisition consisted of image collection at 60-s intervals for ∼25 min using Bio-Rad LaserSharp 3.0 Time Course software with three-photon excitation at 900 nm with detection of the fluorescent VLC-PUFAs over the range of 380–480 nm. Because all fluorescent VLC-PUFA uptake curves as a function of time exhibited typical saturation kinetics, a single concentration (2.5 μm) on the linear portion of uptake was chosen for all subsequent studies. For colocalization of fluorescent VLC-PUFAs with nuclei, after the completion of the time course describing the fatty acid uptake, the nuclei of cells were stained with the nuclear dye SYTO 11 (5 μΜ) and imaged as described above using two-photon excitation at 900 nm with detection over the wavelength region between 500 and 550 nm.
Quantitative Analysis of Fluorescent VLC-PUFA Uptake into Cells and Nuclei
Because the emissions of the VLC-PUFAs and the SYTO 11 were detected separately using dichroics in the two-image channels, one for the fluorescent VLC-PUFAs and one for the SYTO 11, the SYTO 11 fluorescence could easily be used to provide a delineation of the cellular nucleus and allow for measurement of the amount of fluorescent fatty acid within the areas marked by the SYTO 11 emission. The SYTO 11 emission was used to create a binary mask in Corel Photo-Paint 11.0 (Ottawa, Ontario, Canada). The mask used a high intensity (255) for the areas of SYTO 11 emission, although areas of no emission were given intensities of zero, basically a yes or no result. This mask represented the nucleus as labeled by the fluorescent nuclear marker. To delineate the nucleoplasm from the nuclear membrane, a second and third mask were created. The second mask was formed by taking a perimeter of the nucleus that included only the first five pixels from the edge inward to represent the perimeter of the nucleus that included the nuclear membrane region. A third mask was created from the remaining pixels, which represented mostly nucleoplasm. These masks were applied to the image channel that recorded the fluorescent emission of the PUFA analogues. After the application of mask 1, all intensities outside of the nucleus were set to zero, and all intensities within the nucleus were maintained at their original value as detected. This was similar for the other two masks such that the intensities of the fluorescence inside the nuclear membrane and the nucleoplasm could be quantitated as well as provide the ability to distinguish regions within the nucleus as opposed to those close to the nuclear envelope. This morphometric integrated density analysis was performed in Metamorph (Universal Imaging Corp. Downingtown, PA) for each time course. The densitometric values were converted to concentrations (whole cell volume normalized to 1) as quantified by HPLC after lipid extraction at 5 min. The results were plotted in SigmaPlot 8.02 (SPSS, Chicago, IL), and the curves for the nucleus, cytoplasm, and total cell were fitted to Equation 4 using nonlinear regression,
The parameters were defined as follows: C1 and C2 represent the concentrations associated with the uptake rates k1 and k2, respectively. CMAX represents the maximal uptake and is the sum of the concentrations C1 and C2.
Furthermore, the initial rate (IR) of concentration uptake, which would be independent of esterification, was calculated using Equation 5,
Statistics
All values were expressed as the means ± S.E. with n and P indicated under “Results.” Statistical analyses were performed using Student's t test or two-way analysis of variance (GraphPad Prism, San Diego). Values with p < 0.05 were considered statistically significant.
RESULTS
Structures of the Fluorescent Analogues of n-3 and n-6 VLC-PUFAs
The 20-carbon fluorescent fatty acid analogue E6c contains a conjugated tetraene fluorophore in the carboxyl-terminal half of the molecule, but it retains natural methylene-interrupted double bonds (i.e. nonfluorescent) beginning at the n-3 position counting from the methyl-terminal (Fig. 1A). Based on these similarities to the naturally occurring eicosapentaenoic acid (20:5n-3), E6c may be considered as a fluorescent 20:5n-3 analogue. Similarly, the fluorescent analogue D7c also contains a conjugated tetraene fluorophore in the carboxyl-terminal half of the molecule similar to E6c and retains natural methylene-interrupted double bonds (i.e. nonfluorescent) beginning at the n-3 position counting from the methyl-terminal, but the methyl-terminal half of the molecule is two 2 carbons longer with an additional methylene-interrupted double bond (Fig. 1A). Thus, based on these similarities to the naturally occurring 22:6n-3, D7c may be considered as a fluorescent 22:6n-3 analogue. Although the 20-carbon fluorescent A5c also bears a conjugated tetraene fluorophore in the carboxyl-terminal half of the molecule, the A5c is structurally more similar to the naturally occurring nonfluorescent arachidonic acid 20:4n-6 in that the methylene-interrupted (nonfluorescent) double bonds begin at the n-6 position from the methyl terminus (Fig. 1B). Thus, A5c may be considered as a fluorescent 20:4n-6 analogue. Because the above comparisons suggested that the fluorescent VLC-PUFAs may be structural analogues of the corresponding nonfluorescent VLC-PUFAs, the following were important: (i) to demonstrate that fluorescent VLC-PUFAs were also functional mimics of their native, nonfluorescent counterparts, and (ii) to take advantage of these properties to test the hypothesis that the L-FABP regulates the uptake, metabolism, and intracellular distribution of VLC-PUFA in living cells. The following sections address these questions.
FIGURE 1.

Structures of fluorescent and nonfluorescent VLC-PUFAs. A, naturally occurring n-3 polyunsaturated fatty acids, eicosapentaenoic acid and docosahexaenoic acid, are compared with two newly synthesized fluorescent n-3 polyunsaturated fatty acids E6c and D7c, respectively. B, naturally occurring n-6 arachidonic acid is compared with the newly synthesized n-6 fluorescent A5c.
Uptake of Fluorescent and Radiolabeled VLC-PUFAs, Chemical Analysis
Because the conjugated tetraene fluorophores of earlier fluorescent PUFA analogues are localized in the methyl-terminal half of the fatty acid, which is not consistent with the methylene-interrupted n-3 or n-6 grouping present in naturally occurring n-3 and n-6 VLC-PUFAs, they imperfectly monitor uptake of fatty acids in living cells (23, 23, 24, 34). To test whether the more physiological placement of the fluorophore in the fluorescent VLC-PUFAs (Fig. 1) better mimicked that of the native nonfluorescent VLC-PUFA counterparts, cellular uptake of fluorescent and radiolabeled VLC-PUFAs was measured as a function of concentration (data not shown). A concentration of VLC-PUFAs that was in the linear portion of the uptake curves (i.e. 2.5 μm) was chosen for all subsequent uptake studies. With increasing incubation time, all three fluorescent VLC-PUFAs were increasingly taken up (Fig. 2A). Although uptake of the 20:5n-3 analogue E6c was slightly greater at 5 min than the other fluorescent VLC-PUFAs, at a longer time the 20:4n-6 analogue A5c was taken up slightly faster than the others (Fig. 2A). Uptake of the corresponding radiolabeled nonfluorescent VLC-PUFAs measured at 5 min (Fig. 2B) was somewhat faster (20:4n-6) or essentially the same (20:5n-6, 22:6n-3) as that of the corresponding fluorescent VLC-PUFAs (Fig. 2A). Specificity of radiolabeled nonfluorescent VLC-PUFAs at 5 min of incubation (Fig. 2B) resembled that of their fluorescent counterparts at 30 min (Fig. 2A). Finally, at longer times the uptake slowed such that by overnight incubation the fluorescent and radiolabeled nonfluorescent VLC-PUFAs were in general taken up 7- and 8-fold more, respectively, than when measured after 5 min of incubation (data not shown). Thus, overall the fluorescent VLC-PUFA analogues were taken up to a similar extent and specificity as their nonfluorescent counterparts. Differences may be due to faster metabolism of nonfluorescent VLC-PUFAs to esterified forms (see below).
FIGURE 2.

Uptake of the fluorescent and nonfluorescent VLC-PUFA into cells. A, L-cells were incubated with A5c, E6c, and D7c for 5, 15, 30 min, and overnight. B, L-cells were incubated with radiolabeled 20:4n-6, 20:5n-3, and 22:6n-3 for 5, 15, 30 min, and overnight. Total uptake was determined as described under “Experimental Procedures” and shown as nanomoles/mg protein of the PUFAs. Values represent the mean ± S.E. (n = 4–6).
Kinetic Analysis of Real Time Uptake of Fluorescent VLC-PUFAs, MPLSM Imaging in Living Cells
Because washing, lipid extraction, and chemical analysis limit the resolution of the initial most rapid phase of fluorescent VLC-PUFA uptake, a real time fluorescent imaging approach was used to resolve and quantitatively analyze the rapid uptake kinetics of the fluorescent VLC-PUFAs in living cells. Because the fluorescent n-3 and n-6 VLC-PUFAs are excited in the ultraviolet wavelength region, strong photobleaching by single photon excitation obviated the use of conventional or confocal imaging. This problem was largely avoided by use of multiphoton (three photon) excitation and imaging. These probes were basically nonfluorescent in aqueous medium, but once taken up into living L-cells the emission of the fluorescent 20:4n-6 analogue A5c as well as the fluorescent 20:5n-3 E6c and 22:6n-3 D7c was readily detected above intrinsic fluorescence in <1 min (Fig. 3, A–C). Sequential analysis of multiple cell uptake curves over time showed that all three probes appeared to be taken up in biphasic fashion (supplemental Table 1) with the following: (i) an initial rapid uptake within the first 5 min consistent with molecular uptake, (ii) then a slower phase consistent with intracellular metabolism, e.g. esterification (Fig. 3, A–C). Esterification of the fluorescent VLC-PUFAs is addressed below. Quantitative analysis of uptake curves allowed derivation of kinetic parameters, rate constants, and fractional pools (supplemental Table 1, top panel). These parameters in turn were used to obtain the initial rates, half-times for each kinetic pool, and maximal uptake as described under “Experimental Procedures”.
FIGURE 3.

Kinetic analysis of fluorescent VLC-PUFA uptake in living cells. L-cells grown to confluency on chambered coverglass were labeled with 2.5 μm A5c (A), E6c (B), and D7c (C), and images were acquired once every minute using MPLSM. Cells were maintained at 37 °C during the time course (see “Experimental Procedures”). The emission density was converted to concentration by normalization of whole cell area to 1 and calibration at the 5-min time point using the direct quantitation by HPLC as described under “Experimental Procedures.” The uptake curves were subjected to kinetic analysis to obtain for A5c (gray bars), E6c (solid bars), and D7c (open bars) the respective initial rates (D), rapid half-time 1t½ (E), slower half-time 2t½ (F), and maximal uptake CMAX (G). Values represent the means ± S.E. (n = 300–500). IR, initial rate.
Kinetic analysis of real time MPLSM images (Fig. 3, D–G, and supplemental Table 1) revealed that the initial rates of fluorescent VLC-PUFA uptake in living cells were in the following order: 20:5n-3 analogue E6c > 22:6n-3 analogue D7c > 20:4n-6 analogue A5c (Fig. 3D), roughly corresponding to uptake derived from chemical analysis after 5 min of incubation (Fig. 2A). Consistent with this pattern, the short (near 1 min) half-time 1t½ of the faster uptake component was also slowest (longest) for the A5c (Fig. 3E). The half-time 2t½ of the slower (near 6–16 min) component of fluorescent VLC-PUFA uptake was similar for 20:5n-3 analogue E6c and 20:4n-6 analogue A5c but severalfold longer for the 22:6n-3 analogue D7c (Fig. 3D), consistent with significant differences in metabolism as shown below.
In short, multiphoton imaging and kinetic analysis resolved a significant rapid uptake component from a slower uptake component for the fluorescent VLC-PUFAs not achievable by conventional lipid extraction and chemical analysis approaches. The kinetics of this rapid uptake component reflected the specificity of fluorescent VLC-PUFA uptake better than the longer uptake component.
MPLSM Imaging of Fluorescent VLC-PUFA Intracellular Distribution Shortly after Uptake
Because nonphysiological placement of the fluorophore in fluorescent PUFA analogues may highly localize the fluorescent PUFA to lipid droplets despite lack of esterification (24, 34, 37), it was important to determine whether the intracellular distribution of the fluorescent n-3 and n-6 VLC-PUFA better reflected that of the native fatty acids.
Qualitative examination of fluorescent 20:4n-6 analogue A5c (Fig. 4A), 20:5n-3 analogue E6c (Fig. 4D), and 22:6n-3 analogue D7c (Fig. 4G) revealed that little of these fluorescent fatty acids accumulated at the cell surface plasma membrane, lipid droplets, or other prominent intracellular regions at short incubation times (5 min). Each of the fluorescent n-3 and n-6 VLC-PUFAs appeared to distribute in the cytoplasm in a diffuse as well as punctate distribution, a pattern similar to that of fluorescent saturated fatty acid analogues associated with soluble proteins (e.g. L-FABP) and with vesicle membranes, respectively (13). The fluorescent VLC-PUFAs appeared less distributed in darker regions suggestive of nuclei (see below). Lipid extraction and chemical analysis revealed that at early time points (e.g. 5 min), the fluorescent VLC-PUFAs were primarily unesterified. When expressed either as mass (Fig. 5A) or as % distribution (Fig. 5B), the three fluorescent VLC-PUFAs were up to 95% unesterified. Small amounts were esterified to phospholipids (e.g. PC and less so PE) but not to cholesteryl esters and triglycerides except D7c (Fig. 5, A and B). Thus, real time MPLSM of the fluorescent VLC-PUFAs taken at early time points primarily reflected that of the unesterified forms.
FIGURE 4.

Real time MPLSM of fluorescent n-3 and n-6 VLC-PUFAs in living cells at 5 min. MPLSM with nondescanned two-channel fluorescence emission detection was used to monitor the distribution (red) of the fluorescent n-3 and n-6 VLC-PUFA analogues A5c, E6c, and D7c (2.5 μm) in L-cell fibroblasts after 5 min of incubation, a time point where very little of the VLC-PUFA analogues were metabolized. The fluorescent VLC-PUFA-labeled cells (red) were subsequently incubated with the nuclear dye SYTO 11 (5 μm) and imaged through a second photomultiplier (green) as described under “Experimental Procedures.” Red images of the distribution of the fluorescent VLC-PUFAs, A5c (A), E6c (D), and D7c (G). The corresponding red images (B, E, and H) show only the SYTO 11 fluorescence distribution in the nuclei. The respective superposed images show the colocalization of A5c with SYTO 11 (C), E6c with SYTO 11 (F), and D7c with SYTO 11 (I).
FIGURE 5.

Metabolism of fluorescent VLC-PUFA to esterified form after short term (5 min) incubation with living cells. L-cells were incubated with A5c, E6c, and D7c for 5 min. The lipids were extracted and analyzed by HPLC as described under “Experimental Procedures.” The amount in nmol/mg protein (A) and % distribution (B) of the VLC-PUFAs in TG, FFA, PE, PC, and total fluorescently labeled lipid are shown. Values represent the means ± S.E. (n = 4–6).
To provide insights as to the nuclear versus cytoplasmic distribution of the fluorescent n-3 and n-6 VLC-PUFAs in real time in living cells, the L-cells were stained with the nuclear DNA vital stain SYTO 11 as described under “Experimental Procedures.” The distribution of fluorescent VLC-PUFAs was first obtained by real time MPLSM imaging (Fig. 4, A, D, and G). The cells were then incubated with SYTO 11, and SYTO 11 in nuclei was imaged (Fig. 4, B, E and H). Superposition of the respective fluorescent VLC-PUFA and SYTO 11 images (Fig. 4, C, F, and I) allowed determination of nuclear versus cytoplasmic distribution and kinetic analysis as a function of time as described under “Experimental Procedures.” Uptake curves for fluorescent 20:4n-6 analogue A5c (Fig. 6A), 20:5n-3 analogue E6c (Fig. 6C), and 22:6n-3 analogue D7c (Fig. 6E) are shown for the cytoplasm (closed circles) and nuclei (open circles). Visual inspection of these curves indicated that the fluorescent VLC-PUFAs were detectable in cytoplasm in <1 min (Fig. 6, A, C, and E), consistent with the known rapid transbilayer migration of fatty acids across the plasma membrane and distribution into the cytoplasm (8).
FIGURE 6.

Real time MPLSM of fluorescent n-3 and n-6 VLC-PUFAs into cytoplasm, nucleus, nucleoplasm, and nuclear envelope membranes in living cells. L-cells grown to confluency on chambered coverglass were labeled with 2.5 μm A5c (A and B), E6c (C and D), and D7c (E and F), and uptake over time was monitored by acquisition of MPLSM images at time intervals of 1 min. The cells were subsequently labeled with the nuclear dye SYTO 11, and MPLSM images of both probes were acquired as described under “Experimental Procedures.” Cells were maintained at 37 °C during the experiment. Morphometric analysis of the images to obtain cytoplasm (solid circles), nucleus (open circles), nucleoplasm (solid squares), and nuclear envelope (inverted triangles) regions was performed in MetaMorph as described under “Experimental Procedures.” The emission intensities were converted to concentration by calibration at the 5-min time point using the results of the HPLC analysis as described under “Experimental Procedures.” The uptake curves are shown as follows: A, A5c into cytoplasm and nucleus; B, A5c into nucleoplasm and nuclear envelope; C, E6c into cytoplasm and nucleus; D, E6c into nucleoplasm and nuclear envelope; E, D7c into cytoplasm and nucleus; F, D7c into nucleoplasm and nuclear envelope. Values represent the mean ± S.E. (n = 300–500).
To quantitatively determine the kinetics of the respective fluorescent VLC-PUFA uptake, uptake curves were analyzed as described under “Experimental Procedures” and shown to best fit the kinetic parameters in supplemental Table 1 (top panel). This allowed for the determination of the initial rate, half-times, and maximal uptake for each fluorescent n-3 and n-6 VLC-PUFA into cytoplasm and nuclei as described under “Experimental Procedures.” As shown by initial rate and half-time (1t½) of the rapid uptake component (Table 1), uptake of the fluorescent VCL-PUFA into the cytoplasm was most rapid in the order E6c > D7c >A5c, basically similar as the order of initial/rapid uptake into the whole cell (Figs. 2 and 3). The initial rates of uptake of the respective fluorescent VLC-PUFAs A5c, E6c, and D7c into nuclei were 26, 34, and 38%, respectively, slower than into cytoplasm (Table 1), consistent with the slightly slower transport through the cytoplasm than across the plasma membrane (8). Consequently, the initial rates and 1t½ values of fluorescent VLC-PUFA uptake into nuclei were in the following order of rapidity: E6c > D7c, A5c (Table 1). The slower 2t½ components of fluorescent VLC-PUFA uptake into cytoplasm and nuclei were similar (near 6 min) for the E6c and A5c, but longer for D7c into cytoplasm (15 min) and much longer (37 min) into nuclei (Table 1). Finally, within the nucleus the fluorescent VLC-PUFAs were all preferentially associated with the nuclear envelope membrane as compared with nucleoplasm in the following order: A5c > D7c > E6c (Table 1), consistent with the high partitioning of fatty acids into membranes (8).
TABLE 1.
MPLSM uptake kinetics of fluorescent VLC-PUFAs into cytoplasm, nucleus, nucleoplasm, and nuclear envelope regions of living L-cells
Values represent fitted parameters ± S.E. from 300 to 500 cells.
| Cell region | CMAX | Initial rate | 1t½ | 2t½ |
|---|---|---|---|---|
| pmol·mg−1 | pmol·mg−1·min−1 | min | min | |
| A5c | ||||
| Whole cell | 600 ± 60 | 170 ± 30 | 1.4 ± 0.1 | 6 ± 2 |
| Cytoplasm | 650 ± 90 | 190 ± 30 | 1.6 ± 0.1 | 5.3 ± 0.8 |
| Nucleus | 430 ± 30 | 140 ± 30 | 0.9 ± 0.1 | 6 ± 1 |
| Nucleoplasm | 127 ± 3 | 61 ± 5 | 1.4 ± 0.1 | |
| Nuclear Envelope | 630 ± 40 | 160 ± 30 | 1.0 ± 0.1 | 6 ± 1 |
| E6c | ||||
| Whole cell | 900 ± 40 | 400 ± 50 | 0.41 ± 0.05 | 7.4 ± 0.5 |
| Cytoplasm | 1030 ± 40 | 450 ± 50 | 0.41 ± 0.05 | 7.4 ± 0.5 |
| Nucleus | 540 ± 10 | 300 ± 50 | 0.35 ± 0.07 | 7.0 ± 0.4 |
| Nucleoplasm | 268 ± 9 | 180 ± 60 | 0.3 ± 0.1 | 6.3 ± 0.6 |
| Nuclear envelope | 643 ± 9 | 320 ± 50 | 0.36 ± 0.06 | 7.2 ± 0.4 |
| D7c | ||||
| Whole cell | 840 ± 70 | 240 ± 20 | 0.98 ± 0.07 | 16 ± 4 |
| Cytoplasm | 900 ± 70 | 270 ± 30 | 0.87 ± 0.07 | 15 ± 3 |
| Nucleus | 933 ± 68 | 169 ± 3 | 1.38 ± 0.01 | 37 ± 6 |
| Nucleoplasm | 249 ± 3 | 72 ± 3 | 2.39 ± 0.08 | |
| Nuclear envelope | 1020 ± 20 | 225 ± 3 | 1.17 ± 0.01 | 24 ± 2 |
Taken together, these data indicated that the fluorescent VLC-PUFAs are primarily unesterified at early time points of uptake. The initial rates of uptake, specificity, and rates of appearance in cytoplasm and nuclei were consistent with the known very rapid transbilayer migration and slower transport through cytoplasm previously established for fluorescent analogues of saturated fatty acids (8, 13, 14, 38). Specificity of fluorescent VLC-PUFA rapid uptake kinetics into nuclei was overall similar as into cytoplasm, but maximal uptake favored D7c over the other fluorescent VLC-PUFAs. Kinetic analysis showed that within the nuclei, the proportion of fluorescent VLC-PUFAs appearing in the nucleoplasm (rather than associated with nuclear envelope membranes) was highest for E6c > D7c > A5c, basically in the order of their initial rates of uptake into the cell, cytoplasm, and nuclei.
Metabolism of Fluorescent and Radiolabeled VLC-PUFAs to Esterified Lipids
Because the placement of the conjugated polyene fluorophore in the methyl-terminal half of fluorescent PUFA analogues does not reflect that of naturally occurring n-3 and n-6 VLC-PUFAs, they are either very poorly metabolized to esterified forms, initially esterified to triglycerides nearly equally well as phospholipids, or esterified to sphingomyelin much faster than their nonfluorescent counterparts (22, 24, 34, 37). Therefore, it was important to determine whether the fluorescent n-3 and n-6 VLC-PUFA analogues were esterified and whether the pattern of esterification mirrored that of their natural nonfluorescent counterparts. Cells were incubated with either the fluorescent or radiolabeled VLC-PUFAs for increasing times, and lipids were extracted, resolved, and quantitated as under “Experimental Procedures.” Esterification of the fluorescent VLC-PUFAs to individual lipid classes is shown as both mass and as % distribution. With respect to esterification of the 20:4n-6 analogue A5c (Fig. 7A), (a) the mass of A5c as free fatty acid was fairly constant from 5 to 30 min but significantly decreased after overnight incubation. (b) With increasing incubation time, the majority of A5c taken up was esterified into phospholipid PC and, to a much lesser degree, PE. (c) The mass of A5c in neutral lipids CE and TG was very low at all time points. Thus, as A5c was taken up, it was differentially esterified into PC ≫ PE > TG > CE. Percentagewise (Fig. 7B), as A5c was increasingly esterified at longer incubation time, the percentage of A5c in PC increased dramatically, although the percentage of CE stayed very low, and the percentage of other lipid class only increased slightly. From 30 min to overnight, the percentage of A5c in CE, TG, and PE stayed similar, although that in PC increased at the expense of that in FFA. With respect to esterification of the 20:5n-3 fluorescent VLC-PUFA analogue E6c (supplemental Fig. 1A), E6c behaved very similarly as A5c. As E6c was taken up, it was esterified at different rates into different lipid classes in the following order: PC > PE > TG > CE. Percentagewise, as E6c was metabolized (decrease in FFA%), the percentage of both PC and PE increased more than the increase in the percentage of CE and TG (supplemental Fig. 1B). With respect to esterification of the 22:6n-3 fluorescent VLC-PUFA analogue D7c (supplemental Fig. 2A), (a) the mass of D7c as free fatty acid fluctuated more than the other two fluorescent VLC-PUFA at shorter time points, and D7c free fatty acid was no longer detectable after overnight incubation. (b) Unlike the other fluorescent VLC-PUFAs, at shorter time points (5–15 min) the majority of D7c that was taken up was esterified into TG; at longer time points (30 min to overnight) D7c was esterified mainly into PE, and to much lesser degree PC and CE, thus making D7c PE the most prominent product. (c) Percentagewise, D7c was increasingly esterified to PE (supplemental Fig. 2B).
FIGURE 7.

Metabolism of the fluorescent A5c and nonfluorescent VLC-PUFA to esterified lipids. L-cells were incubated with A5c (for 5, 15, 30 min and overnight) or nonfluorescent 14C-20:4n-6 (for 5 min and overnight); lipids were extracted and analyzed as described under “Experimental Procedures.” A, amounts in nmol/mg protein of fluorescent A5c VLC-PUFA appearing in CE, TG, FFA, PE, and PC are shown. B, % distribution of each of the fluorescent A5c lipid classes in A is shown. C, amounts in nmol/mg protein of nonfluorescent 20:4n-6 appearing in CE, TG, FFA, phosphatidic acid (PA), PE, phosphoinositol (PI), phosphatidylserine (PS), and PC at 5 min are shown. D, amount in nmol/mg protein of nonfluorescent 20:4n-6 appearing in each of the lipid classes in C is shown. Values represent the mean ± S.E. (n = 4–6).
Metabolism of radiolabeled VLC-PUFAs to esterified lipids was determined at short (5 min) and long incubation times (overnight) as described under “Experimental Procedures.” Although the radiolabeled, nonfluorescent VLC-PUFAs were each more extensively esterified even by 5 min (Fig. 7C and supplemental Figs. 1C and 2C) than their fluorescent VLC-PUFA counterparts (Fig. 5), nevertheless, the pattern of radiolabeled nonfluorescent VLC-PUFA incorporation into esterified lipids overall reflected that of the fluorescent VLC-PUFAs, i.e. PC > PE > TG and CE. After overnight incubation, the same pattern was again observed for 20:4n-6 (Fig. 7D) and 20:5n-3 (supplemental Fig. 1D). However, after overnight incubation, the incorporation of both the fluorescent D7c (supplemental Fig. 2B) and its radiolabeled nonfluorescent 22:6n-3 counterpart (supplemental Fig. 2D) favored PE rather than PC, i.e. PE > PC > TG, CE.
Thus, the fluorescent VLC-PUFAs overall mimicked the pattern of preferential esterification into phospholipids (PC > PE) rather than neutral lipids (CE, TG) exhibited by their natural nonfluorescent counterparts. These findings were consistent with those observed for VLC-PUFAs in vivo (39–41) and reflected the fact that VLC-PUFA-CoA thioesters are poor substrates for TG and CE synthesis (42).
Intracellular Distribution of Fluorescent VLC-PUFA in Esterified Lipids of Living Cells, Real Time MPLSM Imaging Colocalization with Organellar Markers
To further establish that the esterification pattern of fluorescent VLC-PUFAs such as E6c reflected the distribution of E6c in living cells, the real time distribution of E6c together with intracellular markers was determined by MPLSM as described under “Experimental Procedures.”
Visual examination of E6c multiphoton images in cells at long incubation times showed E6c distributed in punctate/bright intracellular structures and diffusely throughout the cell (Fig. 8, A, F, K, P, and U). Although the diffuse cytoplasmic distributing component was consistent with that of the remaining small amount of unesterified E6c (<5%, supplemental Fig. 1B), the remainder was associated with distribution of E6c in structures containing esterified lipids as follows.
FIGURE 8.

Real time MPLSM of fluorescent n-3 E6c VLC-PUFA analogue distribution in living cells. MPLSM was used to examine the intracellular distribution of the fluorescent n-3 E6c in control L-cells. The cells were labeled with 1.25 μm E6c for 3 h, and the cells were then incubated at 37 °C in dye-free Puck's buffer for another 3–5 h to allow E6c to metabolize. Cells were subsequently incubated with several intracellular organellar markers as described under “Experimental Procedures.” A, E6c PUFA (green); B, Nile Red (red); C, E6c PUFA (green) and Nile Red (red); D, grayscale image of E6c showing the colocalized pixels with Nile Red (yellow); E, fluorogram of C; F, E6c PUFA (green); G, ER Tracker (red); H, E6c PUFA (green) and ER Tracker (red); I, grayscale image of E6c showing the pixels colocalizing with ER Tracker (yellow); J, fluorogram of H; K, E6c PUFA (green); L, MitoTracker (red); M, E6c PUFA (green) and MitoTracker Green (red); N, grayscale image of E6c showing the pixels colocalizing with MitoTracker (yellow); O, fluorogram of M; P, E6c PUFA (green); Q, NBD-C6-ceramide (red); R, E6c PUFA (green) and NBD-C6-ceramide (red); S, grayscale image of E6c showing the pixels colocalizing with the Golgi marker NBD-C6-ceramide (yellow); T, fluorogram of R; U, E6c PUFA (green); V, LysoTracker Green (red); W, E6c PUFA (green) and LysoTracker Green (red); X, grayscale image of E6c showing the pixels colocalizing with the LysoTracker Green (yellow); and Y, fluorogram of W.
Because about 15% of E6c was esterified to triglycerides and cholesteryl esters (supplemental Fig. 1B), both highly localized in lipid droplets, cells were labeled with E6c and a lipid droplet marker Nile Red E6c and simultaneous images of E6c (Fig. 8A, green) and Nile Red (Fig. 8B, red) acquired simultaneously through different photomultipliers. Superposition of these images showed cell regions that were red or green, as well as some yellow/orange, consistent with colocalization (Fig. 8C). Display of only superposed pseudo-colored yellow pixels (Fig. 8D) as well as a quantitative pixel fluorogram (Fig. 8E) indicated significant colocalization of E6c with Nile Red in bright spherical lipid droplets within the cell. Because >80% of E6c was esterified to phospholipids, primarily phosphatidylcholine (the single most common phospholipid species in the cell; see supplemental Fig. 1B), it was expected that MPLSM imaging would detect the E6c in a wide variety of cell membranes. Indeed, E6c was significantly colocalized with markers for membranous organelles, including the following: (i) ER Tracker, an endoplasmic reticulum marker (Fig. 8, F–J); (ii) MitoTracker Green, a mitochondrial marker (Fig. 8, K–O); (iii) NBD-C6-ceramide, a Golgi marker (Fig. 8, P–T); and (iv) Lyso Tracker Green, a lysosome marker (Fig. 8, U–Y). This was especially evident when only yellow colocalized pixels were shown in representative cells (Fig. 8, I, N, S, and X) and more quantitatively by the yellow pixels in the corresponding fluorograms (Fig. 8, J, O, T, and Y).
Thus, at long incubation times E6c was mostly esterified, and the distribution of E6c within living cells reflected its major components as follows. (i) Nearly 80% was incorporated into phospholipids (especially PC), essential components in membranes of multiple membranous organelles throughout the cell. (ii) Nearly 15% was incorporated into neutral lipids (CE, TG), essential components of lipid droplets. (iii) the 5% remaining was unesterified. E6c appeared to be more diffusely distributed throughout the cytoplasm and/or lipid structures.
Role of L-FABP in Regulating VLC-PUFA Parameters, Direct Interaction of n-3 and n-6 VLC-PUFAs with L-FABP
The above studies showing that fluorescent VLC-PUFA mimicked many functions of their nonfluorescent natural counterparts for the first time allowed examination of L-FABP as a candidate protein for regulating extent and specificity of VLC-PUFA uptake, intracellular trafficking, and metabolism. Although the large size of the L-FABP ligand binding pocket is known to accommodate up to two lipidic ligands from a broad variety of ligand classes (43, 44), specificity within a class is more marked, ranging nearly 300-fold for fibrates (44) and as much as 30-fold for fatty acids, depending on their individual structures (1, 18). With respect to naturally occurring VLC-PUFAs, L-FABP exhibits high affinity (nanomolar Kd values) but severalfold higher specificity for 22:6n-3 than 20:4n-6 (18). To examine if L-FABP similarly bound the fluorescent VLC-PUFAs, binding was examined by a direct fluorescence binding assay as described under “Experimental Procedures,” Addition of increasing amounts of the 20:4n-6 analogue A5c (Fig. 9A), the 20:5n-3 analogue E6c (Fig. 9B), and the 22:6n-3 analogue D7c (Fig. 9C) to L-FABP resulted in saturation binding curves with similar maximal intensities for each ligand. Quantitative analysis of the binding curves as described under “Experimental Procedures” revealed that L-FABP exhibited two binding sites for each fluorescent VLC-PUFA, a high affinity binding site (K1,d) with 2-fold higher affinity for the 22:6n-3 analogue D7c (47 ± 4 nm) (Fig. 9C) than the 20:4n-6 analogue A5c (77 ± 6 nm) (Fig. 9A), consistent with the known specificity for the naturally occurring nonfluorescent counterparts (18). Interestingly the 20:5n-3 analogue E6c was bound most weakly (90 ± 5 nm), again reflecting specificity for the nonfluorescent counterpart (1). The dissociation constants at the low affinity site of L-FABP (K2d) followed a similar pattern but were 23-, 49-, and 14-fold weaker, respectively, than exhibited by the high affinity site (Fig. 9), again consistent with those of nonfluorescent fatty acids (28, 45). Thus, the fluorescent n-3 and n-6 VLC-PUFA appeared to mimic their nonfluorescent counterparts with regard to L-FABP binding affinity and specificity.
FIGURE 9.

Binding of fluorescent VCL-PUFAs to L-FABP. The fluorescent emission was monitored in phosphate-buffered saline, pH 7.4, as a function of increasing concentrations of the PUFAs in the presence of 180 nm L-FABP and in a reverse titration of increasing concentrations of L-FABP in the presence of 180 nm solution of each PUFA. The free fatty acid concentration and the mean number of bound molecules (νave) was calculated, and the resultant data were plotted and fitted to the two-site sequential binding Equations 1–3 as described under “Experimental Procedures” for the following tetraene-conjugated PUFAs: A, A5c; B, E6c; C, D7c. Values are the mean ± S.E. (n = 5–6).
Effect of L-FABP Expression on Uptake of VLC-PUFAs, Chemical Analysis
Almost nothing is known regarding factors that regulate VLC-PUFA uptake and specificity, especially in living cells. Because L-FABP exhibited similar affinity and specificity for the fluorescent and nonfluorescent VLC-PUFAs, the possibility that L-FABP regulates uptake of the fluorescent VLC-PUFA analogues or their natural nonfluorescent counterparts was examined. L-cells and L-FABP-expressing cells were incubated for 5 min with fluorescent VLC-PUFA analogues or their natural nonfluorescent counterparts, and uptake was quantitated as under “Experimental Procedures.” Regardless of L-FABP expression, at 5-min incubation times the majority of fluorescent n-3 and n-6 VLC-PUFAs was not esterified (Fig. 5A and supplemental Fig. 3A). L-FABP expression increased the mass of the fluorescent n-3 and n-6 VLC-PUFA analogues taken up (Fig. 10A), primarily into the unesterified form (supplemental Fig. 3A). Similarly, L-FABP also increased the uptake of the corresponding radiolabeled nonfluorescent VLC-PUFA counterparts (Fig. 10B).
FIGURE 10.

Effect of L-FABP expression upon initial (5 min) uptake of VLC-PUFAs into living cells. L-cells and L-cells expressing L-FABP were incubated with A5c, E6c, and D7c (A) or radiolabeled 20:4n-6, 20:5n-3, and 22:6n-3 (B) for 5 min. Total uptake was determined as described under “Experimental Procedures.” Uptake is given as nmol/mg protein ± S.E. (n = 4–6). *, p < 0.05; **, p < 0.01, significantly different compared with control L-cells.
Thus, at short incubation times, L-FABP similarly enhanced the uptake of the fluorescent VLC-PUFAs as their natural nonfluorescent counterparts. This suggested that 2-fold differences in L-FABP affinities for the specific fluorescent VLC-PUFAs were not a significant factor in regulating uptake specificity, suggesting greater role of plasma membrane transporters contributing to determining specificity of VLC-PUFA uptake as has been shown for saturated versus monounsaturated fatty acids (23, 24, 46).
Effect of L-FABP Expression on Fluorescent VLC-PUFA Uptake Kinetics, Real Time MPLSM in Living L-cells
To more quantitatively resolve the effects of L-FABP expression on the rapid initial phase of fluorescent VLC-PUFA uptake, not just into whole cells but also into subcellular compartments, real time multiphoton imaging was performed as described under “Experimental Procedures.” Like their mock-transfected control L-cell counterparts (Fig. 4, A, D, and G), L-FABP-expressing cells also took up and distributed the fluorescent 20:4n-6 A5c (supplemental Fig. 4A), 20:5n-3 E6c (supplemental Fig. 4D), and 22:6n-3 D7c (supplemental Fig. 4G) analogues throughout the cytoplasm in a diffuse and punctate pattern. Visual comparison of the respective uptake curves for each fluorescent n-3 or n-6 VLC-PUFA analogue in L-FABP-expressing cells (supplemental Fig. 5) with those of control cells (Fig. 6) suggested that L-FABP expression increased the maximal uptake of each. Kinetic analysis over time for multiple cells showed that the L-FABP-expressing cells also took up all three probes in biphasic fashion (supplemental Fig. 5, A, C, and E). These uptake curves best fit the kinetic parameters resolved in supplemental Table 1 (bottom panel) which in turn were used to calculate the initial rate, half-times, fractions, and maximal uptake for each fluorescent n-3 and n-6 VLC-PUFA as described under “Experimental Procedures” and shown in Table 2.
TABLE 2.
Effect of L-FABP expression on MPLSM-derived uptake kinetics of fluorescent VLC-PUFAs into cytoplasm, nucleus, nucleoplasm, and nuclear envelope regions of living L-cells
Values represent fitted parameters ± S.E. from 300 to 500 cells.* indicates p < 0.05; ** indicates p < 0.01 compared with corresponding fitted parameters in Table 1; ***, p < 0.001 compared with fitted parameters 1t½ in Table 1.
| Cell region | CMAX | Initial rate | 1t½ | 2t½ |
|---|---|---|---|---|
| pmol·mg−1 | pmol·mg−1·min−1 | min | min | |
| A5c | ||||
| Whole cell | 1000 ± 30** | 330 ± 20** | 0.92 ± 0.05** | 14 ± 3** |
| Cytoplasm | 1020 ± 30** | 400 ± 30** | 0.82 ± 0.05** | 10 ± 1** |
| Nucleus | 980 ± 80** | 200 ± 40 | 1.2 ± 0.2 | 12 ± 4 |
| Nucleoplasm | 364 ± 7** | 52 ± 3 | 4.8 ± 0.2** | |
| Nuclear envelope | 1210 ± 50 | 360 ± 40 | 0.72 ± 0.07* | 11 ± 2* |
| E6c | ||||
| Whole cell | 1370 ± 60** | 710 ± 40** | 0.44 ± 0.02 | 17 ± 2** |
| Cytoplasm | 1600 ± 70** | 810 ± 50** | 0.43 ± 0.03 | 17 ± 2** |
| Nucleus | 670 ± 80 | 370 ± 70 | 0.46 ± 0.09 | 17 ± 8 |
| Nucleoplasm | 270 ± 30 | 190 ± 20 | 0.39 ± 0.04 | 17 ± 4 |
| Nuclear envelope | 730 ± 60 | 410 ± 50 | 0.46 ± 0.06 | 17 ± 4 |
| D7c | ||||
| Whole cell | 1070 ± 10** | 450 ± 30** | 050 ± 0.04** | 6.4 ± 0.3* |
| Cytoplasm | 1150 ± 10** | 510 ± 30** | 0.50 ± 0.04** | 6.5 ± 0.4* |
| Nucleus | 770 ± 10* | 280 ± 40* | 0.43 ± 0.08** | 5.4 ± 0.3** |
| Nucleoplasm | 377 ± 5** | 64 ± 2 | 4.1 ± 0.1*** | |
| Nuclear envelope | 860 ± 10** | 420 ± 50** | 0.33 ± 0.05** | 5.6 ± 0.2** |
In general, L-FABP expression enhanced the initial rate and maximal uptake of all three fluorescent VLC-PUFAs into the cell similarly (Table 2). In the case of A5c and D7c, this was accompanied by a shorter 1t½ and shorter 2t½ (Table 2). The initial rates of A5c, E6c, and D7c uptake into the cytoplasm did not differ significantly from those into whole cells, suggesting rapid transbilayer migration of the fluorescent VLC-PUFAs (Table 2). L-FABP expression increased the initial rate of D7c, but not A5c or E6c, uptake into the nucleus, especially the nuclear envelope (Table 2). Furthermore, L-FABP expression increased the maximal uptake of A5c and D7c into the nucleus, nucleoplasm, and in the case of D7c also into the nuclear envelope (Table 2). In contrast, L-FABP did not significantly alter any of the E6c uptake parameters into nuclei, nucleoplasm, or nuclear envelope (Table 2).
In summary, the fluorescent n-3 and n-6 VLC-PUFA analogues were taken up with kinetics reflecting their initial rapid uptake followed by slower metabolism (esterification) in living cells. Although L-FABP exhibited as much as 2-fold higher affinity for the 22:6n-3 analogue D7c (Fig. 9), this difference did not equate with 2-fold greater enhancement of D7c uptake as compared with that of A5c and E6c, suggesting that specificity was determined more by other factors (e.g. plasma membrane fatty acid translocases). However, L-FABP did alter the relative distribution of fluorescent VLC-PUFAs into the nucleus versus cytoplasm in a manner inversely proportional to the affinity of L-FABP for the fluorescent VLC-PUFA. Furthermore, L-FABP increased the relative distribution of the A5c and D7c analogues into nucleoplasm versus the nuclear envelope membrane (Table 2 versus Table 1), again in a manner inversely proportional to the affinity of L-FABP for the fluorescent VLC-PUFA. These findings were consistent with the greater prevalence of L-FABP in the cytoplasm than nucleus (6, 8, 47). Thus, the more tightly bound uptake of E5c VLC-PUFA into nuclei was enhanced less as was its distribution into nucleoplasm versus nuclear envelope.
Effect of L-FABP Expression on Metabolism of Radiolabeled and Fluorescent VLC-PUFAs to Esterified Lipids
Although L-FABP is known to enhance the intracellular esterification of nonfluorescent saturated and monounsaturated fatty acids (13, 35, 48), nothing is known about L-FABP effects on VLC-PUFA esterification. Because L-FABP bound fluorescent and nonfluorescent VLC-PUFA (see above), the possibility that L-FABP affected esterification of fluorescent and natural nonfluorescent VLC-PUFA was examined as described under “Experimental Procedures.” At short incubation times (5 min), L-FABP had little effect on the small proportion of fluorescent VLC-PUFA esterified to PC, PE, CE (not detected), or TG, which was increased slightly for D7c (supplemental Fig. 3A). After 30 min of incubation, over half the E6c was esterified, and L-FABP increased E6c incorporation into PE and CE while decreasing incorporation into TG and PC (Fig. 11A). After overnight incubation, almost all the E6c was esterified, and L-FABP elicited only a small change in % of E6c distribution in CE versus TG (Fig. 11B). These data suggested that L-FABP affected E6c uptake and esterification more at early rather than later time points where almost all the E6c was already esterified even in the absence of L-FABP. At long incubation times (overnight), the radiolabeled nonfluorescent counterpart was also esterified primarily into PC, PE, and TG (Fig. 11C). L-FABP expression increased incorporation of radiolabeled nonfluorescent VLC-PUFA into PE while decreasing that into CE and TG (Fig. 11C). Thus, the fluorescent VLC-PUFAs mirrored the pattern of preferential esterification into phospholipids (PC > PE) rather than neutral lipids (CE, TG) as exhibited by their natural nonfluorescent counterparts. Furthermore, L-FABP expression altered the distribution of fluorescent or radiolabeled VLC-PUFAs into several esterified lipid classes (e.g. more so into PE and less into TG), consistent with the L-FABP enhancing the rate-limiting microsomal transacylation of select fatty acyl-CoAs to form phosphatidic acid (precursor of phospholipids and triglycerides) and microsomal transacylation to cholesteryl esters (25, 49, 50). This suggested that L-FABP played a role not only in increasing the VLC-PUFA available for esterification but also for selective targeting to specific esterified lipid classes.
FIGURE 11.

Effect of L-FABP expression upon metabolism of the fluorescent and nonfluorescent VLC-PUFA. L-cells and L-cells expressing L-FABP were incubated for 30 min (A) or overnight (B) with E6c or incubated overnight with radiolabeled 20:5n-3 (C); lipids were extracted and analyzed as described under “Experimental Procedures.” The % distributions of the respective VLC-PUFA metabolized to different lipids are shown. Values represent the mean ± S.E. (n = 4–6). *, p < 0.05; **, p < 0.01, significantly different compared with control L-cells.
DISCUSSION
The uptake, intracellular transport, and intracellular targeting of saturated and monounsaturated fatty acids into nuclei are increasingly well understood (8–14, 51). In contrast, almost nothing is known regarding these aspects of n-3 and n-6 VLC-PUFA dynamics or the factors that regulate VLC-PUFA uptake, metabolism, and intracellular distribution in living cells. The recent development of fluorescent n-3 and n-6 VLC-PUFA (26, 27), together with MPLSM and L-FABP-expressing cells for the first time, allowed real time quantitative examination of these questions in living cells, yielding the following new insights.
First, the fluorescent n-3 and n-6 VLC-PUFA more accurately reflected the uptake of their nonfluorescent native counterparts than earlier fluorescent PUFAs whose conjugated fluorophores were located in the methyl-terminal region of the PUFA. Kinetic analysis at early time points indicated that the fluorescent n-3 and n-6 VLC-PUFAs were taken up very rapidly, appearing in the cytoplasm with essentially the same kinetics as in the whole cell, i.e. detectable in <1 min, consistent with the known rapid transbilayer transport previously shown for many other types of fatty acids (8). Furthermore, the half-times for fluorescent n-3 and n-6 VLC-PUFA uptake were similar to those of naturally occurring fatty acids, in marked contrast to the much more rapid uptake of earlier fluorescent PUFAs (t½ of 7–10 s) (23, 39, 48, 52, 53). Finally, the specificity of fluorescent n-3 and n-6 VLC-PUFA uptake (especially with increasing time of incubation) better mimicked that of their nonfluorescent counterparts, again in contrast to that observed with earlier fluorescent PUFAs such as the cis- and trans-parinaric acids (23, 24, 54). trans-Parinaric acid uptake is faster and has 40-fold lower Km values than that of cis-parinaric acid, opposite to the specificity for nonfluorescent counterparts (23, 24, 54).
Second, the fluorescent n-3 and n-6 VLC-PUFA better mimicked the intracellular distribution of nonfluorescent counterparts. At early time points when the fluorescent VLC-PUFAs were primarily unesterified, real time MPLSM imaging showed them distributed as follows: (i) in the cytoplasm both diffusely and punctate consistent with the free VLC-PUFAs bound to cytoplasmic proteins and vesicle membranes, respectively, as has been shown for fluorescent analogues of saturated fatty acids (13); (ii) less so in the nucleus (nuclear envelope membrane > nucleoplasm); and (iii) at longer incubation times the fluorescent VLC-PUFAs were primarily in esterified form and distributed into a variety of membranous structures as well as into lipid droplets. In contrast, earlier nonesterified fluorescent PUFAs with the conjugated tetraene fluorophore in the methyl-terminal region were distributed primarily into bright lipid droplets and diffusely in cytoplasm and less so in nuclei (34). Thus, the intracellular distribution of fluorescent n-3 and n-6 VLC-PUFA much better reflected that of the native fatty acids.
Third, the metabolism of the fluorescent n-3 and n-6 VLC-PUFAs much better represented that of their occurring counterparts than previous fluorescent PUFAs. With increasing incubation time, the fluorescent n-3 and n-6 VLC-PUFA was more representative of their radiolabeled nonfluorescent counterparts in becoming increasingly esterified to the phospholipids rather than neutral lipids. At early time points, the fluorescent VLC-PUFAS mimicked their radiolabeled VLC-PUFA counterparts in becoming primarily incorporated into PC and less so into PE. Although this was also the case at longer time points (overnight incubation) for fluorescent A5c and E6c as well as their radiolabeled nonfluorescent counterparts (20:4n-6, 20:5n-3), both the fluorescent D7c analogue and its radiolabeled nonfluorescent counterpart (22:6n-3) was esterified more into PE than PC. Overall, these findings were consistent with studies of n-3 and n-6 VLC-PUFA distribution in esterified lipids of multiple tissues (39, 40–42, 57). Finally, both fluorescent n-3 and n-6 VLC-PUFA analogues as well as their radiolabeled nonfluorescent counterparts were only weakly esterified to the neutral lipids. This finding was due to the CoA thioesters of n-3 and n-6 VLC-PUFAs being poor substrates for diacylglycerol acyltransferase (last step in triglyceride synthesis) and cholesterol acyl-CoA acyltransferase (last step in cholesterol ester synthesis (42)). In marked contrast, earlier fluorescent PUFA analogues wherein the conjugated polyene fluorophore was localized in the methyl half of the molecule (interrupting/abolishing the normal methylene interruptions present in naturally occurring n-3 and n-6 PUFAs) were either very slowly esterified (3%/day) or esterified nearly equally to phospholipids and neutral lipids, especially at early time points of incubation (22, 24, 34). Finally, it is important to note that very little of the fluorescent n-3 and n-6 VLC-PUFAs were oxidized or photodegraded in the early time frame of the experiments herein because their fluorescence was relatively stable. Similar low degree of oxidation and/or photodestruction was reported for earlier fluorescent PUFA analogues, regardless of where the conjugated fluorescent polyene resided in the molecule (16, 22). Taken together, these data suggested that the fluorescent n-3 and n-6 VLC-PUFAs were taken up and remained primarily in unesterified form at early time points, preferentially esterified to phospholipids (not neutral lipids) at longer time points, and relatively stable to oxidation/photodestruction under the conditions of the real time MPLSM imaging studies in living cells used herein.
Fourth, L-FABP binding of fluorescent VLC-PUFAs mirrored the natural nonfluorescent counterparts better than earlier fluorescent PUFAs (1, 28, 45). L-FABP bound all three fluorescent VLC-PUFAs with high affinity and reflected the specificities for their nonfluorescent counterparts (1, 28, 45). The high affinities exhibited by L-FABP for both the fluorescent and naturally occurring n-3 and n-6 VLC-PUFAs reflected the natural distribution of the endogenous bound native nonfluorescent fatty acids (32) as follows. (i) the n-3 and n-6 VLC-PUFAs included over 40% of the endogenous L-FABP-bound fatty acid, consistent with the higher affinity of L-FABP for such fatty acids than saturated or monounsaturated fatty acids. (ii) 20:4n-6 and 22:6n-3 included 25 and 2% of the total endogenous bound fatty acid, whereas 22:5n-3 was not detectable, consistent with the relative composition of hepatic unesterified fatty acid pool (32, 42, 57). In contrast, earlier fluorescent PUFAs with conjugated polyene fluorophore in the methyl-terminal region (e.g. parinaric acids) do not interact with L-FABP in the same manner as naturally occurring n-3 and n-6 VLC-PUFA (20:4n-6, 22:6n-3). For example, although several studies previously established that L-FABP has higher or equal affinity for 22:6n-3 than 20:4n-6, parinaric acid displacement assays showed the opposite (1, 18, 19, 25). L-FABP exhibits higher affinity for the straight chain trans-parinaric acid (saturated analogue) as compared with the kinked chain cis-parinaric acid (unsaturated analogue), opposite to the known preference of L-FABP for kinked chain unsaturated fatty acids versus straight chain saturated fatty acids (8, 28, 58). Thus, the pattern of L-FABP affinities for the fluorescent n-3 and n-6 VLC-PUFAs, but not that established with parinaric acid displacement assays, better reflects that of naturally occurring n-3 and n-6 VLC-PUFA.
With regard to specificity of L-FABP for VLC-PUFA binding, the cytosolic fatty acid-binding protein family is composed of more than a dozen members with overlapping specificity for binding a broad variety of fatty acids. The rodent FABPs bind n-3 and n-6 VLC-PUFAs in the following order of affinities: L-FABP, H-FABPs ≫ intestinal type FABP, adipocyte-type FABP ≫ cellular retinoic acid-binding proteins I and II (18). The liver L-FABP has high affinity for VLC-PUFAs (as compared with most other FABP family members), and it is highly expressed in tissues active in fatty acid uptake and metabolism (i.e. liver, intestine, kidney). L-FABP also enhances the uptake/metabolism of saturated and monounsaturated fatty acids (43). Although it is tempting to speculate that differences in binding affinities to L-FABP may account for the differences in predominant products formed by the n-3 and n-6 PUFA synthetic pathways, there is as yet no evidence that this is the case (1). Conversely, however, by binding long chain fatty acid peroxidation products of PUFAs, the L-FABP (more so than other FABPs tested) modulates availability of these PUFAs to intracellular oxidative pathways and controls the amount of reactive oxygen species released within the cell (19, 59, 60). These findings suggested L-FABP as a candidate protein for regulating these properties of VLC-PUFAs.
Fifth, L-FABP enhanced fluorescent and radiolabeled n-3 and n-6 VLC-PUFA uptake. This reflects higher intracellular fatty acid binding capacity (61). The functional significance of an L-FABP-mediated increase in fatty acid uptake is evidenced by increased fatty acid cytoplasmic transport and metabolism in cultured cells overexpressing L-FABP, decreased fatty acid cytoplasmic transport and metabolism in hepatocytes and livers from L-FABP gene-ablated mice, and increased weight gain/obesity in L-FABP gene-ablated mice, even when fed a PUFA-rich diet (8, 35, 43, 62–64). It is important to note that the L-FABP-mediated increase in fatty acid uptake was not due to concomitant up-regulation of plasma membrane fatty acid translocase/transport proteins (e.g. FATP, FAT/CD36) (13, 62, 63). In contrast, earlier fluorescent PUFA analogues such as cis- and trans-parinaric acid did not accurately reflect the fatty acid structural specificity for uptake or the effects of L-FABP on specificity of uptake (23, 24, 48, 65). Taken together, these data were consistent with the fluorescent n-3 and n-6 VLC-PUFAs being better analogues for replicating the effects of L-FABP expression on VLC-PUFA uptake, especially by real time imaging. There have been no previous studies reported examining the specificity of different FABPs for enhancing VLC-PUFA uptake. However, the near equal affinity of L-FABP and H-FABP for VLC-PUFA together with the much weaker affinities of other rodent FABP family members (18) would suggest that H-FABP might also be highly effective in facilitating VLC-PUFA uptake, especially in tissues where H-FABP is highly expressed (muscle, heart).
Sixth, as demonstrated by the fluorescent VLC-PUFAs in combination with live-cell imaging, L-FABP selectively increased the total uptake of n-3 and n-6 VLC-PUFA into nuclei not only by increasing total cellular uptake but by preferential distribution into the nuclei and/or within the nucleoplasm of living cells. With the exception of the 20:5n-3 E6c analogue, L-FABP increased the initial rate of transport of these fatty acids into nuclei and preferentially distributed A5c and D7c into nucleoplasm versus nuclear envelope membranes. In contrast, L-FABP bound the E6c more tightly in the cytoplasm and was less able to deliver it into nuclei or nucleoplasm. Together with the fact that L-FABP (14 kDa) is sufficiently small to pass through nuclear pores (accommodate proteins up to 50 kDa), these data indicate that L-FABP may co-transport bound VLC-PUFAs into the nucleus and nucleoplasm. This possibility is supported by earlier studies with saturated and monounsaturated fatty acids showing the following: (i) L-FABP-bound oleic acid (much less so than free oleic acid) is transported into purified nuclei (15); (ii) L-FABP expression enhances uptake of fluorescent saturated fatty acid analogues into nuclei (16, 34); (iii) L-FABP gene ablation decreases cytosolic binding capacity of earlier fluorescent PUFAs (61), decreasing their cytoplasmic transport rate (13, 38), and thus their distribution into nuclei (17); (iv) L-FABP is present in nuclei as well as cytoplasm (16, 17, 66, 67). Regarding FABP specificity, to our knowledge there are no previous reports showing that any other FABP family member enhances distribution of bound ligand into the nucleus. Although several other members of the FABP family (adipocyte-type FABP, K-FABP, and CRABP-2) translocate to the nucleus in response to the presence of ligand, it is unclear whether this resulted from post-translational modification, as has been shown for the carbohydrate-response element-binding protein or from ligand-induced conformational change and co-transport of bound ligand into the nucleus (6, 68, 69). Finally, it is important to note that some FABP family members (e.g. CRABP-1) do not enter nuclei regardless of the presence or absence of ligand, suggesting specificity in the ability of FABP family members to co-transport bound ligand into the nucleus (6). The combination of these findings indicated that L-FABP enhanced the uptake into the cytoplasm and selectively increased the distribution of fluorescent VLC-PUFAs into the nucleus by increasing the cytosolic fatty acid binding capacity as well as providing a molecular carrier important for co-transport of the bound ligand into the nucleus.
In summary, the fluorescent n-3 and n-6 VLC-PUFAs were overall better mimics of their nonfluorescent natural counterparts than previous fluorescent PUFAs with regard to uptake, intracellular distribution, metabolism, and binding to L-FABP. Because of recent advancements in MPLSM, these three-photon accessible probes were imaged in real time as they were taken up in living cells and distributed throughout the cytoplasm and nucleus as mostly free fatty acids initially and then as known metabolites (phospholipids) that were incorporated into organellar membranes at longer time intervals. Consistent with its high affinity for natural and the new fluorescent VLC-PUFAs, L-FABP was proposed and shown to be a functionally significant potential regulator of VCL-PUFA uptake, metabolism, and distribution. This emphasized L-FABP as an important contributor in the intracellular delivery not only of unesterified saturated fatty acids (16, 17, 34) and monounsaturated fatty acids (15) but also of unesterified n-3 and n-6 VLC-PUFAs into the nucleus for potential interaction with nuclear receptors and gene regulation (6, 7, 55, 56).
Supplementary Material
This work was supported, in whole or in part, by National Institutes of Health Grants DK41402 (to F. S. and A. B. K.), GM31651 (to F. S. and A. B. K.), DK70965 (to B. P. A.), and DK22042 (to W. L. S.) from USPHS.

The on-line version of this article (available at http://www.jbc.org) contains supplemental Figs. 1–5 and Table 1.
- VLC-PUFA
- very long chain polyunsaturated fatty acid
- MPLSM
- multiphoton laser scanning microscopy
- A5c
- 5E,7E,9E,11Z,14Z-eicosapentaenoic acid
- E6c
- 5E,7E,9E,11Z,14Z,17Z-eicosahexanoic acid
- D7c
- 4E,6E,8E,10Z,13Z,16Z,19Z-docosaheptaenoic acid
- L-FABP
- liver-type fatty-acid binding protein
- H-FABP
- heart-type fatty-acid binding protein
- CE
- cholesterol esters
- TG
- triacylglycerides
- FFA
- free fatty acid
- PE
- phosphatidylethanolamine
- PC
- phosphatidylcholine
- HPLC
- high pressure liquid chromatography
- i-PrOH
- isopropyl alcohol.
REFERENCES
- 1.Norris A. W., Spector A. A. (2002) J. Lipid Res. 43, 646–653 [PubMed] [Google Scholar]
- 2.Anderson B. M., Ma D. W. (2009) Lipids Health Dis. 8, 33. [DOI] [PMC free article] [PubMed] [Google Scholar]
- 3.Simopoulos A. P. (2006) Biomed. Pharmacother. 60, 502–507 [DOI] [PubMed] [Google Scholar]
- 4.Morris D. H. (2007) in FLAX: A Health and Nutrition Primer (Morris D. H. ed) pp. 22–33, Flax Council of Canada, Winnipeg, Manitoba, Canada [Google Scholar]
- 5.Morris D. H. (2007) in FLAX: A Health and Nutrition Primer (Morris D. H. ed) pp. 34–43, Flax Council of Canada, Winnipeg, Manitoba, Canada [Google Scholar]
- 6.Schroeder F., Petrescu A. D., Huang H., Atshaves B. P., McIntosh A. L., Martin G. G., Hostetler H. A., Vespa A., Landrock D., Landrock K. K., Payne H. R., Kier A. B. (2008) Lipids 43, 1–17 [DOI] [PubMed] [Google Scholar]
- 7.Jump D. B. (2008) Curr. Opin. Lipidol. 19, 242–247 [DOI] [PMC free article] [PubMed] [Google Scholar]
- 8.McArthur M. J., Atshaves B. P., Frolov A., Foxworth W. D., Kier A. B., Schroeder F. (1999) J. Lipid Res. 40, 1371–1383 [PubMed] [Google Scholar]
- 9.Schaffer J. E., Lodish H. F. (1995) Trends Cardiovasc. Med. 5, 218–224 [DOI] [PubMed] [Google Scholar]
- 10.Bradbury M. W., Berk P. D. (2003) Adv. Mol. Cell Biol. 33, 47–80 [Google Scholar]
- 11.Abumrad N. A. (2005) J. Clin. Invest. 115, 2965–2967 [DOI] [PMC free article] [PubMed] [Google Scholar]
- 12.Hamilton J. A. (2003) Curr. Opin. Lipidol. 14, 263–271 [DOI] [PubMed] [Google Scholar]
- 13.Atshaves B. P., McIntosh A. M., Lyuksyutova O. I., Zipfel W., Webb W. W., Schroeder F. (2004) J. Biol. Chem. 279, 30954–30965 [DOI] [PubMed] [Google Scholar]
- 14.Weisiger R. A. (2002) Mol. Cell. Biochem. 239, 35–43 [PubMed] [Google Scholar]
- 15.Lawrence J. W., Kroll D. J., Eacho P. I. (2000) J. Lipid Res. 41, 1390–1401 [PubMed] [Google Scholar]
- 16.Huang H., Starodub O., McIntosh A., Atshaves B. P., Woldegiorgis G., Kier A. B., Schroeder F. (2004) Biochemistry 43, 2484–2500 [DOI] [PubMed] [Google Scholar]
- 17.McIntosh A. L., Atshaves B. P., Hostetler H. A., Huang H., Davis J., Lyuksyutova O. I., Landrock D., Kier A. B., Schroeder F. (2009) Arch. Biochem. Biophys. 485, 160–173 [DOI] [PMC free article] [PubMed] [Google Scholar]
- 18.Richieri G. V., Ogata R. T., Zimmerman A. W., Veerkamp J. H., Kleinfeld A. M. (2000) Biochemistry 39, 7197–7204 [DOI] [PubMed] [Google Scholar]
- 19.Ek B. A., Cistola D. P., Hamilton J. A., Kaduce T. L., Spector A. A. (1997) Biochim. Biophys. Acta 1346, 75–85 [DOI] [PubMed] [Google Scholar]
- 20.Kuklev D. V., Smith W. L. (2004) Chem. Phys. Lipids 131, 215–222 [DOI] [PubMed] [Google Scholar]
- 21.Mateo C. R., Souto A. A., Amat-Guerri F., Acuña A. U. (1996) Biophys. J. 71, 2177–2191 [DOI] [PMC free article] [PubMed] [Google Scholar]
- 22.Kuerschner L., Ejsing C. S., Ekroos K., Shevchenko A., Anderson K. I., Thiele C. (2005) Nat. Methods 2, 39–45 [DOI] [PubMed] [Google Scholar]
- 23.Schroeder F., Jefferson J. R., Powell D., Incerpi S., Woodford J. K., Colles S. M., Myers-Payne S., Emge T., Hubbell T., Moncecchi D., Prows D. R., Heyliger C. E. (1993) Mol. Cell. Biochem. 123, 73–83 [DOI] [PubMed] [Google Scholar]
- 24.Heyliger C. E., Kheshgi T. J., Murphy E. J., Myers-Payne S., Schroeder F. (1996) Mol. Cell. Biochem. 155, 113–119 [DOI] [PubMed] [Google Scholar]
- 25.Schroeder F., Jolly C. A., Cho T. H., Frolov A. A. (1998) Chem. Phys. Lipids 92, 1–25 [DOI] [PubMed] [Google Scholar]
- 26.Kuklev D. V., Smith W. L. (2004) Chem. Phys. Lipids 130, 145–158 [DOI] [PubMed] [Google Scholar]
- 27.McIntosh A. L., Atshaves B. P., Wellberg E. K., Smith W. L., Schroeder F. (2005) FASEB J. 19, A292 [Google Scholar]
- 28.Frolov A., Cho T. H., Murphy E. J., Schroeder F. (1997) Biochemistry 36, 6545–6555 [DOI] [PubMed] [Google Scholar]
- 29.Nemecz G., Hubbell T., Jefferson J. R., Lowe J. B., Schroeder F. (1991) Arch. Biochem. Biophys. 286, 300–309 [DOI] [PubMed] [Google Scholar]
- 30.Jefferson J. R., Powell D. M., Rymaszewski Z., Kukowska-Latallo J., Lowe J. B., Schroeder F. (1990) J. Biol. Chem. 265, 11062–11068 [PubMed] [Google Scholar]
- 31.Thompson J., Winter N., Terwey D., Bratt J., Banaszak L. (1997) J. Biol. Chem. 272, 7140–7150 [DOI] [PubMed] [Google Scholar]
- 32.Murphy E. J., Edmondson R. D., Russell D. H., Colles S., Schroeder F. (1999) Biochim. Biophys. Acta 1436, 413–425 [DOI] [PubMed] [Google Scholar]
- 33.Lin Q., Ruuska S. E., Shaw N. S., Dong D., Noy N. (1999) Biochemistry 38, 185–190 [DOI] [PubMed] [Google Scholar]
- 34.Huang H., Starodub O., McIntosh A., Kier A. B., Schroeder F. (2002) J. Biol. Chem. 277, 29139–29151 [DOI] [PubMed] [Google Scholar]
- 35.Atshaves B. P., Storey S. M., Huang H., Schroeder F. (2004) Mol. Cell. Biochem. 259, 115–129 [DOI] [PubMed] [Google Scholar]
- 36.Atshaves B. P., Petrescu A. D., Starodub O., Roths J. B., Kier A. B., Schroeder F. (1999) J. Lipid Res. 40, 610–622 [PubMed] [Google Scholar]
- 37.McGuire S. O., James-Kracke M. R., Sun G. Y., Fritsche K. L. (1997) Lipids 32, 219–226 [DOI] [PubMed] [Google Scholar]
- 38.Murphy E. J. (1998) Am. J. Physiol. 275, G244–G249 [DOI] [PubMed] [Google Scholar]
- 39.Chen C. T., Green J. T., Orr S. K., Bazinet R. P. (2008) Prostaglandins Leukot. Essent. Fatty Acids 79, 85–91 [DOI] [PubMed] [Google Scholar]
- 40.Golovko M. Y., Murphy E. J. (2006) J. Lipid Res. 47, 1289–1297 [DOI] [PubMed] [Google Scholar]
- 41.Murphy E. J., Rosenberger T. A., Patrick C. B., Rapoport S. I. (2000) Lipids 35, 891–898 [DOI] [PubMed] [Google Scholar]
- 42.Jump D. B. (2002) J. Biol. Chem. 277, 8755–8758 [DOI] [PubMed] [Google Scholar]
- 43.Atshaves B. P., Martin G. G., Hostetler H. A., McIntosh A. L., Kier A. B., Schroeder F. (2010) J. Nutr. Biochem. in press [DOI] [PMC free article] [PubMed] [Google Scholar]
- 44.Chuang S., Velkov T., Horne J., Wielens J., Chalmers D. K., Porter C. J., Scanlon M. J. (2009) J. Med. Chem. 52, 5344–5355 [DOI] [PubMed] [Google Scholar]
- 45.Wolfrum C., Börchers T., Sacchettini J. C., Spener F. (2000) Biochemistry 39, 1469–1474 [DOI] [PubMed] [Google Scholar]
- 46.Heyliger C. E., Scarim A. L., Eymer V. P., Skau K. A., Powell D. M. (1997) Mol. Cell. Biochem. 176, 281–286 [PubMed] [Google Scholar]
- 47.Hostetler H. A., McIntosh A. L., Atshaves B. P., Storey S. M., Payne H. R., Kier A. B., Schroeder F. (2009) J. Lipid Res. 50, 1663–1675 [DOI] [PMC free article] [PubMed] [Google Scholar]
- 48.Murphy E. J., Prows D. R., Jefferson J. R., Schroeder F. (1996) Biochim. Biophys. Acta 1301, 191–198 [DOI] [PubMed] [Google Scholar]
- 49.Jolly C. A., Hubbell T., Behnke W. D., Schroeder F. (1997) Arch. Biochem. Biophys. 341, 112–121 [DOI] [PubMed] [Google Scholar]
- 50.Chao H., Zhou M., McIntosh A., Schroeder F., Kier A. B. (2003) J. Lipid Res. 44, 72–83 [DOI] [PubMed] [Google Scholar]
- 51.Weisiger R. A. (1996) Comp. Biochem. Physiol. B 115, 319–331 [Google Scholar]
- 52.Samuel D., Paris S., Ailhaud G. (1976) Eur. J. Biochem. 64, 583–595 [DOI] [PubMed] [Google Scholar]
- 53.Murphy E. J., Prows D. R., Jefferson J. R., Incerpi S., Hertelendy Z. I., Heyliger C. E., Schroeder F. (1996) Arch. Biochem. Biophys. 335, 267–272 [DOI] [PubMed] [Google Scholar]
- 54.Fraser H., Coles S. M., Woodford J. K., Frolov A. A., Murphy E. J., Schroeder F., Bernlohr D. A., Grund V. (1997) Mol. Cell. Biochem. 167, 51–60 [DOI] [PubMed] [Google Scholar]
- 55.Botolin D., Wang Y., Christian B., Jump D. B. (2006) J. Lipid Res. 47, 181–192 [DOI] [PMC free article] [PubMed] [Google Scholar]
- 56.Jump D. B., Botolin D., Wang Y., Xu J., Demeure O., Christian B. (2008) Chem. Phys. Lipids 153, 3–13 [DOI] [PMC free article] [PubMed] [Google Scholar]
- 57.Jump D. B. (2004) Crit. Rev. Clin. Lab. Sci. 41, 41–78 [DOI] [PubMed] [Google Scholar]
- 58.Paulussen R. J. A., Veerkamp J. H. (1990) in Subcellular Biochemistry (Hilderson H. J. ed) pp. 175–226, Plenum Publishing Corp., New York [Google Scholar]
- 59.Raza H., Pongubala J. R., Sorof S. (1989) Biochem. Biophys. Res. Commun. 161, 448–455 [DOI] [PubMed] [Google Scholar]
- 60.Yan J., Gong Y., She Y. M., Wang G., Roberts M. S., Burczynski F. J. (2009) J. Lipid Res. 50, 2445–2454 [DOI] [PMC free article] [PubMed] [Google Scholar]
- 61.Martin G. G., Danneberg H., Kumar L. S., Atshaves B. P., Erol E., Bader M., Schroeder F., Binas B. (2003) J. Biol. Chem. 278, 21429–21438 [DOI] [PubMed] [Google Scholar]
- 62.Atshaves B. P., Storey S. M., Petrescu A., Greenberg C. C., Lyuksyutova O. I., Smith R., 3rd, Schroeder F. (2002) Am. J. Physiol. Cell Physiol. 283, C688–C703 [DOI] [PubMed] [Google Scholar]
- 63.Atshaves B. P., McIntosh A. L., Payne H. R., Mackie J., Kier A. B., Schroeder F. (2005) Am. J. Physiol. Cell Physiol. 288, C543–C558 [DOI] [PubMed] [Google Scholar]
- 64.Atshaves B. P., McIntosh A. L., Storey S. M., Landrock K. K., Kier A. B., Schroeder F. (2010) Lipids 45, 97–110 [DOI] [PMC free article] [PubMed] [Google Scholar]
- 65.Prows D. R., Murphy E. J., Schroeder F. (1995) Lipids 30, 907–910 [DOI] [PubMed] [Google Scholar]
- 66.Schroeder F., Atshaves B. P., Starodub O., Boedeker A. L., Smith R. R., 3rd, Roths J. B., Foxworth W. B., Kier A. B. (2001) Mol. Cell. Biochem. 219, 127–138 [DOI] [PubMed] [Google Scholar]
- 67.Bordewick U., Heese M., Börchers T., Robenek H., Spener F. (1989) Biol. Chem. Hoppe-Seyler 370, 229–238 [DOI] [PubMed] [Google Scholar]
- 68.Tan N. S., Shaw N. S., Vinckenbosch N., Liu P., Yasmin R., Desvergne B., Wahli W., Noy N. (2002) Mol. Cell. Biol. 22, 5114–5127 [DOI] [PMC free article] [PubMed] [Google Scholar]
- 69.Davies M. N., O'Callaghan B. L., Towle H. C. (2008) J. Biol. Chem. 283, 24029–24038 [DOI] [PMC free article] [PubMed] [Google Scholar]
Associated Data
This section collects any data citations, data availability statements, or supplementary materials included in this article.