

Abstract
Dendritic cells (DC) play a major role in the pathogenesis of graft-vs-host disease (GvHD). Directed modification of surface molecules on DC that provide instructive signals for T cells may create a tolerogenic DC phenotype that affects GvHD severity. To investigate the impact of the mammalian target of rapamycin (mTOR) inhibitor rapamycin (RAPA) on in vivo migratory capacities, tolerogenic function, and B7 superfamily surface expression on DC following allogeneic hematopoietic cell transplantation (aHCT), we generated a platform for magnetic resonance imaging and bioluminescence imaging based cell trafficking studies. Luciferase transgenic DC were labeled with superparamagnetic iron oxide nanoparticles bound to a murine IgG Ab that allowed for Fc-γR-mediated endocytosis. Locally injected luc+ DC could be tracked within their anatomical context by bioluminescence imaging and magnetic resonance imaging after aHCT, based on stable intracellular localization of superparamagnetic iron oxide-IgG complexes. RAPA preconditioned DC (DC-R) displayed reduced expression of MHC class II, B7-1 (CD80), and B7-2 (CD86) but not B7-H4 whose ligation of T cells has a profound inhibitory effect on their proliferation and cytokine secretion. DC-R of recipient genotype reduced GvHD severity that is compatible with their tolerogenic phenotype. CCR5, CCR7, and CD62L expression was not affected by mTOR inhibition, which allowed for DC-R in vivo trafficking to secondary lymphoid compartments where immunregulation is required. This study is the first to delineate the impact of RAPA on DC migration and tolerogenic function after aHCT. Modification of the DC phenotype by mTOR inhibition may have therapeutic potential in an attempt to reduce GvHD following aHCT.
One of the major goals in allogeneic hematopoietic cell transplantation (aHCT)3 is the establishment of tolerance by the donor immune system toward nonmalignant recipient tissues. Although the involvement of various cell populations has been implicated in this process (1–4), the relative contributions of different subpopulations are not yet identified, which is in part because of the difficulty to determine their diverse trafficking patterns in vivo. Dendritic cells (DC) are a heterogenous population of APCs that contribute to innate immunity and also play an important role in immune homeostasis by excertion of tolerogenic functions (5). Recently, substantial evidence supports the hypothesis that Ag-presenting DC interact with CD4+CD25+Foxp3+ regulatory T cells (Treg) during the process of peripheral immunregulation (6). Although recipient type DC are critical for CD8-mediated graft-vs-host disease (GvHD) development (7), recent data indicate the relevance of donor type DC for the development of CD4-mediated chronic GvHD (8). Therefore, cross presentation of host Ag by donor type DC may participate in the stimulation of effector and regulatory cell populations.
Although structurally similar to calcineurin inhibitors, the immunosuppressive drug rapamycin (RAPA) binds uniquely to FKBP12 and then complexes with mammalian target of RAPA (mTOR). Importantly, RAPA does not interact with calcineurin or its downstream effectors, which is important because calcineurin-dependent IL-2 production was shown to be crucial for Treg function after aHCT (9). Besides having a beneficial impact on Foxp3+ Treg (9–11), RAPA has been shown to induce a poor stimulatory function in DC, which promotes solid organ transplant tolerance (12). Mechanistically, RAPA appears to exert some of its immunosuppressive effects by affecting DC maturation (13), Ag uptake (14, 15), intracellular signaling (16) and survival (17, 18). Recently, RAPA has demonstrated efficacy in clinical protocols of bone marrow transplantation (BMT) (19, 20). Therefore, we reasoned that more information on the tolerogenic function and the fate of donor and recipient DC following mTOR inhibition in the aHCT recipient is of specific interest when this drug is considered for the treatment of immunological disorders.
Although our previous studies have demonstrated that in vivo bioluminescence imaging (BLI) is a valuable tool to identify regions of interest for histological evaluation (21), magnetic resonance imaging (MRI) offers high resolution imaging of specific anatomical regions in vivo. Since intracellular nanoparticles are diluted out when cells divide, MRI is particularly suitable for DC tracking because these cells have a low proliferative capacity and are efficient in Ag uptake (22). Conversely, T cells that have a high proliferative potential and only modest Ag uptake capacity are ideal for BLI techniques where the genomic integration of the reporter gene leads to increased signal intensity upon cell division.
In the present study, we investigated the impact of mTOR pathway inhibition by RAPA on DC with respect to costimulatory capacity, tolerogenic in vivo function, and lymphoid homing by BLI- and MRI-based imaging following aHCT.
Materials and Methods
Mice
C57BL/6 (H-2Kb, Thy-1.2), FVB/N (H-2Kq, Thy-1.2), and BALB/c (H-2Kd, Thy-1.2) mice were purchased from The Jackson Laboratory or Charles River Laboratory. Mice were used between 6 and 12 wk of age. Only gender-matched combinations were used for transplant experiments. The luciferase-expressing (luc+) transgenic FVB/N L2G85 line was previously described (23). C57BL/6 (H-2Kb, Thy-1.1) luciferase transgenic animals were generated by backcrossing FVB/N L2G85 mice on the C57BL/6 background for more than 10 generations. All animal protocols were approved by the University Committee on Use and Care of Laboratory Animals at Stanford University or the Albert-Ludwigs University Freiburg.
DC isolation
Single-cell suspensions from bone marrow and spleens of luc+ C57BL/6-L2G85 donor mice were enriched for CD11c+ cells after staining with anti-CD11c microbeads (Miltenyi Biotec) using the manual MACS system by positive selection reaching a purity above 90% (Miltenyi Biotec). T cell-depleted bone marrow was obtained through negative depletion using anti-CD4 and anti-CD8 magnetic beads (Miltenyi Biotec).
Phagocytic uptake of superparamagnetic iron oxide (SPIO)
For labeling studies, we used either carboxydextran-coated SPIO complexes (Feridex) as negative control or SPIO-IgG-FITC complexes (generated by chemicell). The fluidMAG/GA – anti mouse IgG 1-FITC complexes were generated by combining an anti-mouse IgG-FITC (clone P3; eBioscience) with SPIO nanoparticles (200 nm, matrix: starch). To achieve an efficient uptake of the SPIO-IgG FITC+ complexes, the cell populations were incubated for 24 or 48 h at 5% CO2 and 37°C with SPIO complexes at a concentration of 100 μg/ml. A total of 2 × 10⁶ CD11c+ per flat-bottom well in 24-well plates were cultured in the presence of GM-CSF (10 ng/ml; R&D Systems) and where indicated with RAPA 100 ng/ml (Sigma-Al-drich). Cell culture was performed with RPMI 1640 plus 10% FBS (In-vitrogen) L-glutamine (2 mM), penicillin (100 U/ml), and streptomycin (0.1 mg/ml).
Impact of SPIO on DC vitality
To study the impact on vitality, DC were incubated at 5% CO2 and 37°C with or without SPIO or SPIO-IgG FITC+ complexes at a concentration of 100 μg/ml. A total of 2 × 10⁶ CD11c+ DC per flat-bottom well in 24-well plates were cultured in the presence of GM-CSF (10 ng/ml; R&D Systems). The rate of apoptotic (Annexin V/propidium iodide (PI) double positive) DC was determined by flow cytometry after various time points after SPIO exposure.
BMT model
BMT were performed as described previously (9). In brief, recipients were given 5 × 10⁶ wild-type (wt) T cell-depleted bone marrow cells after lethal irradiation with 800 cGy (C57BL/6→BALB/c). For trafficking studies, 1 × 10⁶ luciferase transgenic SPIO-loaded CD11c+ DC were given i.m. on day 0. For GvHD studies, 1 × 10⁶ T cells (day +1) and 1 × 10⁶ CD11c+ DC (day 0) were injected i.v. via the tail vein. Mice were given antibiotic water (sulfomethoxazole-trimethoprim; Schein Pharmaceutical). To study regulatory immune responses following DC transfer, lymph nodes and spleens of BMT recipients were removed on day 7 and analyzed for the presence of CD4+Foxp3+ and CD4+IL-10+ cells. At the same time point, serum levels of IL-6, IL-12, IL-10, MCP-1, TNF, and IFN-γ (Inflammation kit; BD Biosciences) were analyzed.
Slides of small bowel and large bowel samples collected on day 7 were stained with H&E and scored by an experienced pathologist (U. V. Gerlach) according to a previously published histopathology scoring system.
In vivo BLI
In vivo BLI was performed as previously described (24). In brief, mice were injected i.p. with luciferin (10 μg/g bodyweight). Ten minutes later, mice were imaged using an IVIS200 charge-coupled device imaging system (Xenogen) for 5 min. Expansion was quantified in photons/second/cm2. Imaging data were analyzed and quantified with Living Image Software (Xenogen) and IgorProCarbon (WaveMetrics).
Immunosuppressive treatment
For in vivo studies, RAPA (Sigma-Aldrich) was dissolved in carboxy-methylcellulose sodium salt (C-5013; Sigma-Aldrich) and polysorbate 80 (P-8074; Sigma-Aldrich). RAPA stock solution was stored at 4°C in the dark in distilled water according to the manufacturer’s instructions. i.p. injections were given once daily and started on day 0. Dosage was adjusted to the body weight every other day. The RAPA dosage used in vivo of 1.5 mg/kg/day corresponds to blood levels that were reported to reach 6–15 ng/ml (25). Immunosuppressive treatment was continued until death or end of the observation period.
Proliferation assays with SPIO-loaded DC as stimulators
CD4+ and CD8+ T cell splenocytes from C57BL/6 mice and CD11c+ DC from BALB/c mice were purified by positive selection. For CFSE labeling, 1 × 10⁷/ml T cells were resuspended in plain PBS and stained with Vybrant CFDA SE (carboxyfluorescein diacetate, succinimidyl ester) Tracer kit (Molecular Probes) at a final concentration of 5 μM for exactly 6 min at 37°C. Immediately after staining, cells were washed in 5 vol of ice-cold RPMI 1640 plus 10% FBS (Invitrogen) twice, resuspended in PBS, and counted before use in an in vitro assay. A total of 2 × 10⁵ cells/well were cultured in flat-bottom, 96-well plates and stimulated with DC that had previously been exposed to SPIO or just media for 24 h. Culture medium consisted of RPMI 1640 supplemented with L-glutamine (2 mM), penicillin (100 U/ml), streptomycin (0.1 mg/ml), 2-ME (5 × 10⁻⁵ M), and 10% FCS. After 72-h culture, T cells were harvested and analyzed by FACS for CFSE dilution.
Magnetic resonance imaging
MRI was done on a 94/20 Bruker BioSpec (Bruker) system using a cylindrical quadrature coil with an inner diameter of 38 mm specifically designed for whole-body mouse imaging (Bruker). The MRI protocol consisted of a Pilot-Scan, a T1-weighted FLASH sequence (TR/TE/FA: 350 ms/5.4 ms/40°) and a T2-weighted RARE sequence (TR/TEeff/FA: 3490 ms/36 ms/180°) with a field of view of 30 mm × 30 mm, a matrix of 256 × 256 pixel obtaining an in plane resolution of 117 × 117 μm2 for morphological reference. Slice thickness and distance was 1 mm. Slice orientation was coronal in both sequences. Further on, we performed a three-dimensional FLASH sequence that had a TE/TR of 2.94 ms/20 ms, a bandwidth of 55 kHz, an echo position of 25%, a matrix of 256 × 256 × 96, a resolution of 105 × 105 × 104 μm, a tacq of 12′ 17″, and an α of 10°. The three-dimensional FLASH sequence was used to gain information about the migration of the DCs based on an anatomical context.
Mice were anesthetized under spontaneous breathing conditions using isoflurane. Heart rate and respiration rate were continuously monitored, and gating was used to reduce moving and blood flow artifacts during the scan. Body temperature was kept constant using a custom-made built-in heating device that flushed water at 37°C through the animal bed.
Migration assay
For migration studies, 96-well flat-bottom Transwell polyester membrane plates with a 5-μm pore size (Costar) were used. The plate with medium was place in 37°C before adding the cells. A total of 106 cells were added to the upper chamber and the number of cells that had migrated spontaneously into the lower chamber was quantified by trypan blue stain/manual counting at different time points (3, 12, 24, and 48 h). CD1+ cells were enriched by MACS and used as a negative control for the migration assay.
Flow cytometry
The following Abs were used for flow cytometric analysis: unconjugated anti-CD16/32 (2.4G2), CD4 (RM4-5), CD8α (53-6.7), CD25 (PC61), CD11c (M1/70), CD45R/B220 (RA3-6B2), Thy-1.1 (H1S51), Thy-1.2 (53-2.1), Foxp3 (FJK-16s), CD80 (16-10A1), CD86 (GL 1), CD40 (3/23), and anti-MHC-II (AF6-120.1) were purchased from BD Pharmingen and eBioscience. Staining was performed in the presence of purified anti-CD16/32 at saturation to block nonspecific staining. PI (Sigma-Aldrich) was added before analysis to exclude dead cells. All analytical flow cytometry was done on a dual laser LSRScan (BD Immunocytometry Systems) in the Shared FACS Facility, Center for Molecular and Genetic Medicine at Stanford or at Freiburg University using FlowJo software (TreeStar) for data analysis.
Conventional and immunofluorescence microscopy
Tissues were embedded in OCT and cryopreserved at −80°C. Fresh frozen sections of 5-μm thickness were mounted on positively charged precleaned microscope slides (Superfrost/Plus; Fisher Scientific) and stored at −80°C. For staining with fluorescence labeled Abs, the sections were thawed for 15 min at room temperature (RT). After acetone fixation (7 min at RT) and air drying (3–5 min), sections were incubated with blocking solution (PBS plus 2% FCS) for 15 min. Incubations with primary Abs were performed for 1 h at RT. The following primary Abs were used at a dilution of 1/100 in 1 × PBS: CD4-allophycocyanin (A20; Caltag Laboratories), anti-mouse CD11c biotin (Miltenyi Biotec). Secondary detection included streptavidin PE (eBioscience) in a 1/100 dilution in PBS. Nuclei were stained with DAPI (4′,6-diamidino-2-phenylindole). Washing steps after Ab incubation and DAPI staining were performed in PBS. For morphological assessment, tissues were stained with H&E according to standard protocols. Evaluation of the stained tissue sections was performed on a Nikon microscope (Eclipse, TE 300). Standard magnifications were 200×/numerical aperture 0.45 and ×400/numerical aperture 0.60. Microscopic photos were obtained using a Spot digital camera (Diagnostic Instruments).
Prussian blue stain for intracellular iron
The cellular uptake of the SPIO particles was verified by Prussian blue stain as previously described (26). In brief, cytospin preparations of the exposed cells were stained with Kalium Ferrocyanide Trihydrate (K4Fe(CN)6.3H2O; Sigma-Aldrich) for 20 min at RT. After washing with distilled water, slides were counterstained for 5 min with nuclear fast red.
Statistical analysis
Differences in transwell migration, mean fluorescence intensity of costimulatory molecule expression, photons/sec and cell numbers in lymphoid compartments were analyzed using the two-tailed Student’s t test of the arithmetic mean. Differences in animal survival (Kaplan-Meier survival curves) were analyzed by log-rank test. A value of p < −0.05 was considered statistically significant.
Results
SPIO nanoparticle-based cell labeling as quantified by FACS correlates with MRI signal intensity
Previous studies have shown that SPIO nanoparticles are taken up by DC via receptor-mediated endocytosis (27). Therefore, we aimed to enhance phagocytic activity by using SPIO nanoparticles directly coupled to a murine IgG Ab labeled with FITC, that are taken up via Fc-γR-mediated endocytosis. CD11c+ DC derived from bone marrow and spleens were incubated together with SPIO-IgG-FITC particles for 24 or 48 h. Immunofluorescence images showed that DC acquired SPIO-IgG-FITC, as demonstrated by localization of FITC within the cells (Fig. 1A). To further quantify the intracellular vs surface-bound localization of the SPIO-IgG-FITC complexes, the cultured DC were stained with an anti-FITC Ab for detection of cell surface-bound FITC. FACS analysis demonstrated that 86% of the pDC (gating on CD11c+B220+) and 83% of the myDC (gating on CD11c+B220−) but only 4% of B cells (gating on CD11c−B220+) stained negative for cell surface FITC (Fig. 1B), indicating that the SPIO-IgG-FITC complexes were internalized by the DC. Also, the presence of intracellular iron representing the endocytosed SPIO nanoparticles was verified by Prussian blue staining (Fig. 1C).
FIGURE 1.
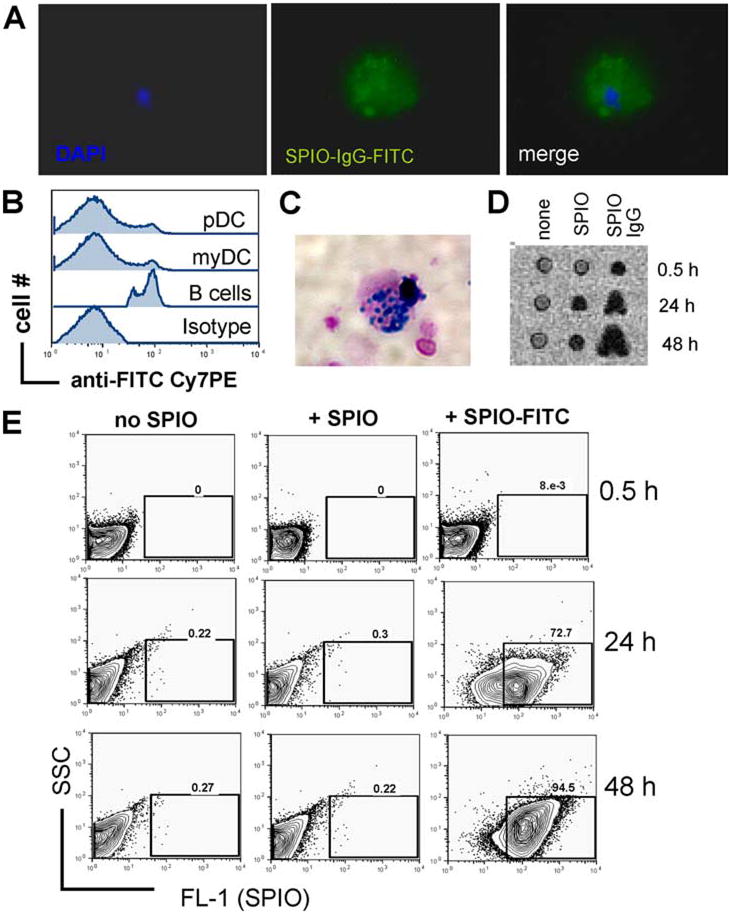
Intracellular uptake of SPIO nanoparticles coupled to murine IgG-FITC. A, Phagocytic uptake of SPIO-IgG-FITC particles by sorted DC as demonstrated by immunofluorescence microscopy. DC display intracellular FITC signal. Nuclear staining for DAPI. Original magnification ×1000. B, Gating on CD11c-positive cells counterstained with anti-FITC or isotype control Abs labeled with phyocerythrin-indotricarbo-cyanine (PE-Cy7) for detection of extra-cellular FITC. Experiments were repeated three times. C, Prussian blue stain for intracellular iron within DC cultured with SPIO-IgG-FITC particles. Counterstain was with nuclear fast red. Original magnification ×1000. D, MRI signal disruption within a sorted DC cell population is displayed. Left panel, No SPIO, signal disruption is significantly higher when SPIO-IgG as compared with SPIO are used. Each well contains 1 × 10⁵ cells. Experiments were repeated three times. E, After the indicated time points, DC were washed and analyzed by flow cytometry for FITC as a parameter for the uptake of SPIO-IgG-FITC particles. Experiments were repeated three times.
To study whether flow cytometry-based quantification of Fc-γR-mediated uptake of the SPIO-IgG-FITC complexes correlated with the signal intensity detected by MRI, we monitored the number of FITC-positive cells under different conditions. As expected, we did not detect a significant increase of the MRI signal in the absence of SPIO-IgG-FITC complexes (Fig. 1D, left column). When FITC-negative SPIO were used, there was a dim MRI signal detectable after 24 h (Fig. 1D, middle column), indicating that without the Fc-γR-IgG-mediated uptake there was still a baseline phagocytic activity of the nanoparticles. In contrast, when SPIO-IgG-FITC complexes were used, the MRI signal intensity was highest (Fig. 1D, most right column). The MRI signal intensity correlated with the number of FITC-positive cells (Fig. 1E, most right column). Based on these findings we reasoned that FACS analysis is a reliable tool to verify effective labeling via Fc-γ R-IgG-FITC mediated uptake in DC.
SPIO labeling of DC is permissive for intact costimulatory molecule and MHC class II expression, migration capacity, and alloantigen-driven T cell proliferation
To investigate whether the labeling with SPIO-IgG-FITC complexes would affect costimulatory molecule and MHC class II expression on DC, the surface expression of these molecules was investigated by FACS analysis. We were not able to detect a difference in the expression of CD80, CD86, CD40, and MHC class II in the presence as compared with the absence of SPIO (Fig. 2A), suggesting that nanoparticle loading may not affect the costimulatory capacity of DC.
FIGURE 2.
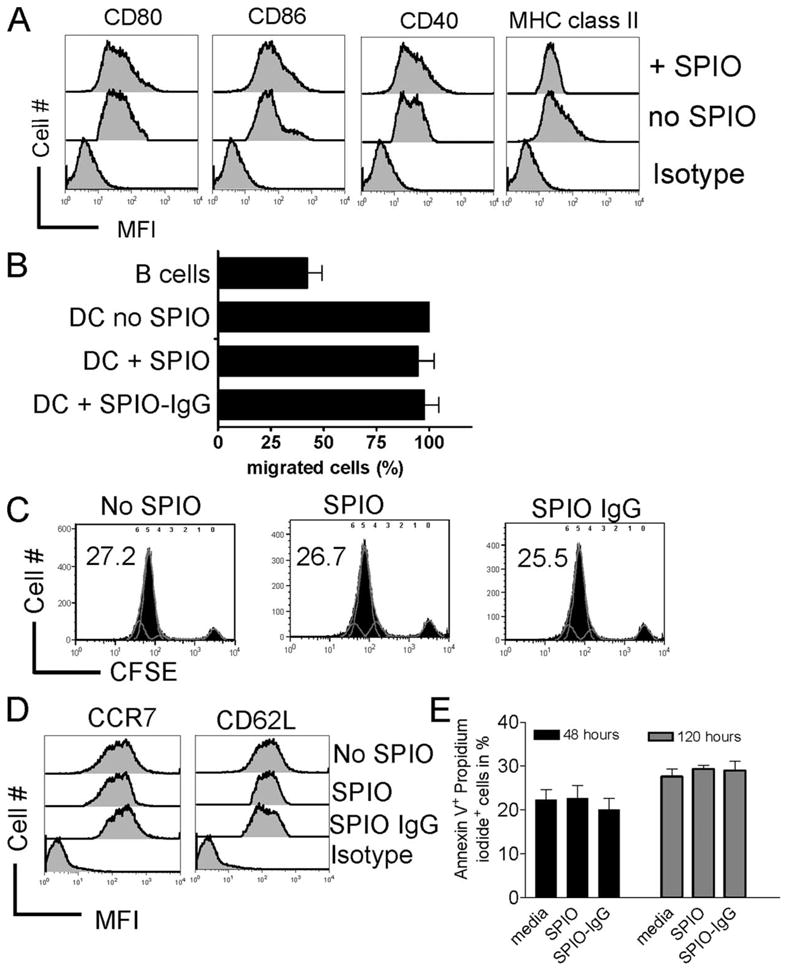
Migratory and stimulatory capacity of SPIO-labeled DC remains intact. A, CD40, CD80, CD86, and MHC class II expression on DC with or without SPIO labeling as indicated for the respective line. Experiments were repeated three times. B, Migratory capacity of DCs determined by the percentage of DCs labeled with or without SPIO that migrate through a 5-μm transwell membrane in an vitro migration assay. B cells were used as negative controls. Experiments were repeated three times. C, Stimulatory activity of myeloid (my) and plasmacytoid (p) DC in an alloantigen-driven MLR. FACS plots represent gating on H-2kb responder CD3+ T cells that were CFSE-labeled before exposure to either DC subset (H-2kd). The concentration for each cell type was 1 × 10⁶ cells/well cultured in flat-bottom, 6-well plates. Stimulation was by either myDD or pDC (both H-2kd) as indicated for the respective experiment. After 72-h culture, T cells were harvested and analyzed by FACS for CFSE dilution. The numbers indicate the amount of divided cells in percent. D, CCR7 and CD62L surface expression on DC that had been cultured for 24 h in the absence or presence of SPIO or SPIO-IgG. MFI for CCR7: 361 ± 4 vs 375 ± 5 (no SPIO vs SPIO-IgG), CD62L: 531 ± 4 vs 527 ± 8 (no SPIO vs SPIO-IgG). E, Amount of Annexin V+/PI+ DC that had been cultured for the indicated time (h) in the absence or presence of SPIO or SPIO-IgG. No significant difference was found.
Since we aimed to study the in vivo trafficking of CD11c+ DC, we first evaluated the potential impact of SPIO-IgG-FITC complexes on their migratory capacity. Importantly, DC migration was comparable, independent of SPIO-IgG-FITC complex loading (Fig. 2B). To evaluate the stimulatory functionality of SPIO-IgG-FITC complex or SPIO-labeled DC, we used them in comparison to unlabeled DC subsets as allogeneic stimulators for CD4/CD8 T cell proliferation. We found that SPIO labeling did not affect the ability of DC to induce T cell proliferation (Fig. 2C) and costimulatory surface molecule expression (Fig. 2D). The amount of viable DC was not significantly affected by the presence of SPIO after 24, 48, 72, 96, 120, 144, and 168h of exposure (data not shown). The number of apoptotic DC is shown for the representative time points 48 and 120 h of SPIO exposure (2E).
Luciferase transgenic donor DC traffic to secondary lymphoid organs after local injection and retain SPIO particles
Local i.m. injection of SPIO-labeled CD11c+ cells into the right proximal leg of a BMT recipient led to migration from this site toward inguinal, mesenteric, axillary, and cervical lymph node compartments on the ipsilateral side of injection (Fig. 3A). On consecutive time points after day 8, luc+ DC were also detectable on the contralateral lymph nodes while during later time points (day 30), DC had dispersed in skin and BLI demonstrated only modest signal projecting over the spleen area (Fig. 3A). To study whether DC that had migrated to the cervical lymph node still contained SPIO nanoparticles, we performed a selective removal of the BLI+ cervical lymph nodes. Prussian blue stain demonstrated the presence of iron within the removed cervical lymph node, indicating that migrating DC retained SPIO nanoparticles (Fig. 3B).
FIGURE 3.
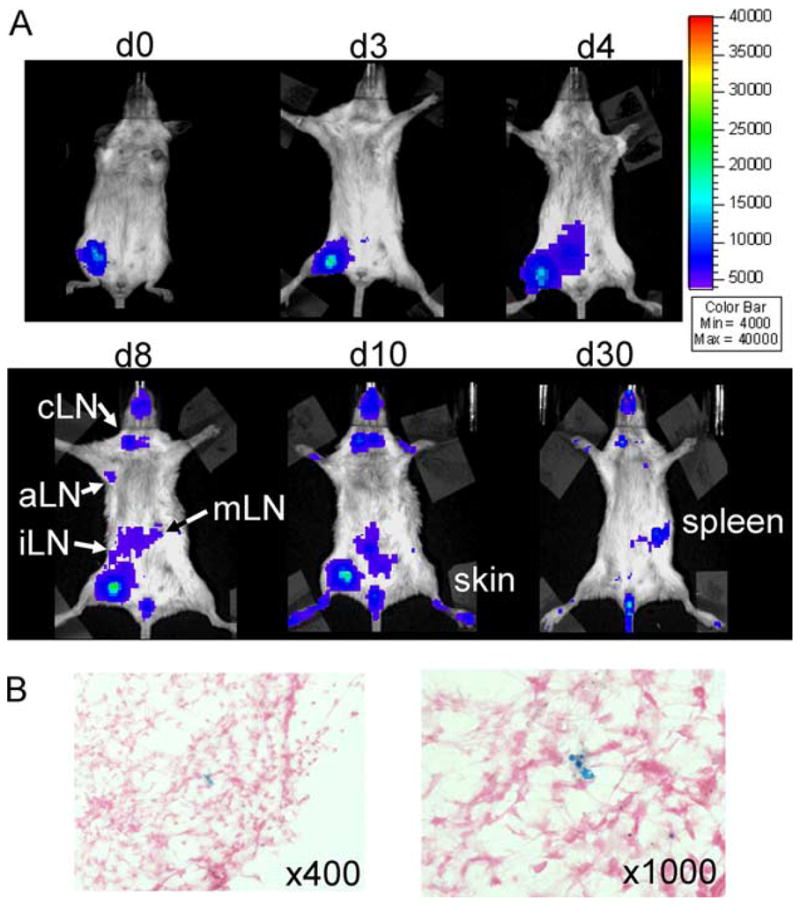
Donor DC traffic to secondary lymphoid organs after local injection and retain SPIO particles. A, i.m. injection of luc+SPIO+CD11c+ cells in the right proximal leg 1 h after BMT (C57B/6→BALB/c). Trafficking is monitored by BLI on the indicated days. cLN = Cervical lymph node, aLN = axillary lymph node, iLN = inguinal lymph node, mLN = mesenteric lymph node. B, Detection of Fe within the cervical lymph node of an animal receiving local luc+SPIO+CD11c+ cells in the right proximal leg as indicated by Prussian blue stain. Counterstained with nuclear fast red, original magnification ×400 and ×1000. Experiments were repeated three times.
In vivo MRI allows for detection of SPIO-labeled DC following aHCT
Based on the BLI/histology results, we reasoned that it may be possible to track locally injected SPIO-loaded CD11c+ DC. Interestingly, we observed trafficking patterns similar to BLI and found a demarcation of MRI signal disruption in the cervical region on day 8 after BMT (Fig. 4A). To verify that SPIO particles were transported to the cervical lymph nodes, these were surgically removed and stained for the presence of iron. Prussian blue stain reveals iron accumulation in the cervical lymph nodes of animals that received i.m. injection of SPIO-labeled DCs in the right lower extremity (Fig. 4B).
FIGURE 4.
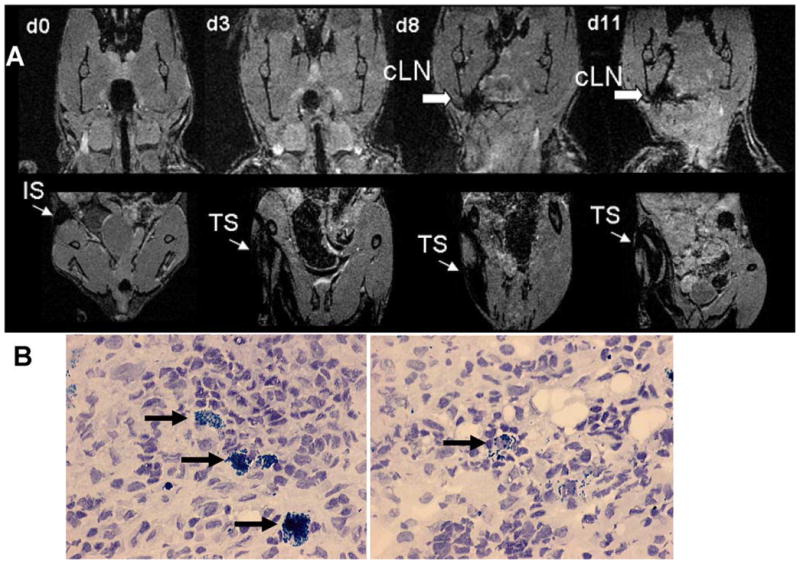
MRI and IFM demonstrate migration of SPIO+ DC from the injection site toward cervical lymph nodes day 8 after BMT. A, i.m. injection of luc+SPIO+CD11c+ cells in the right proximal leg 1 h after BMT (C57B/6→BALB/c). Trafficking is monitored by MRI using the three dimensional FLASH sequence on the indicated days in the cervical region (upper row) and lower extremities (lower row). The thin arrow indicates signal disruption within the right leg injection site (IS) within the muscle tissue (TS) and the bold arrow indicates signal disruption within the cervical lymph node (cLN) region. Experiments were repeated two times. B, Detection of Fe within the cervical lymph node (black arrow) of an animal receiving local SPIO+ CD11c+ cells in the right proximal leg as indicated by Prussian blue stain. Counterstained with Hematoxylin, original magnification ×400.
Intact chemokine receptor and reduced costimulatory molecule expression of RAPA-exposed DC
Based on previous reports indicating that RAPA can generate DC with a tolerogenic phenotype (12) and based on our previous studies on the impact of RAPA following aHCT (9, 28), we exposed DC for 24 h with RAPA at a concentration of 100 ng/ml (25). To determine the impact of additional in vivo RAPA administration, BMT recipients were treated with RAPA at a dosage of 1.5 mg/kg bodyweight daily. During the process of sampling host alloantigens in post conditioning inflamed tissue and migrating to the local lymph nodes, where DC present these Ags to T cells, different chemotactic signals are crucial. We studied CCR5 as an inflammatory chemokine receptor (29) and did not find a difference with respect to the presence vs the absence of RAPA (Fig. 5A). CCR7 drives DC toward T cell areas within the lymph nodes, where its ligands secondary lymphoid tissue chemokine and EBI1-ligand chemokine are produced (30). We found that the expression of CCR7 and CD62L was not affected by RAPA administration in vitro and in vivo (Fig. 5A). These data indicate that RAPA preconditioned DC (DC-R) display a normal chemokine receptor repertoire that may allow migration toward sites where immunoregulation is required.
FIGURE 5.
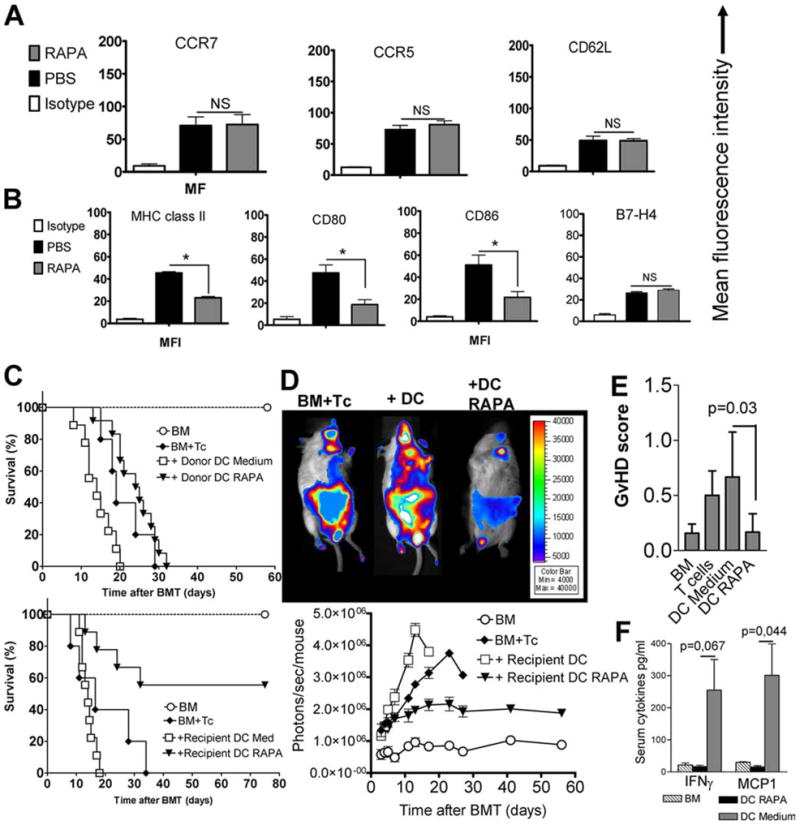
RAPA induces a tolerogenic DC phenotype that reduces alloreactivity in vivo. A, Local injection of 2 × 10⁶ SPIO+CD11c+ cells in the right proximal leg 30 min after BMT (C57B/6→BALB/c). cLN were harvested on day 12 post BMT. DC had been incubated for 24 h with SPIO-IgG ± RAPA 100 ng/ml in cRPMI. BMT recipients were injected daily with RAPA (1.5 mg/kg body weight i.p.) or PBS. The amount of CCR7, CCR5, and CD62L surface expression was quantified as mean fluorescence intensity after gating on donor marker (H-2kb) and CD11c-positive cells. Experiments were repeated four times. B, Expression of MHC class II, CD80, CD86, and B7-H4 on donor type (H-2kb) DC that have been pretreated in vitro and in vivo with RAPA as described under A. MFI is reduced in the RAPA as compared with the PBS group: MHC class II (23 ± 1 vs 47 ± 2), CD80 (19 ± 2 vs 52 ± 3), CD86 (24 ± 2 vs 53 ± 2), *p < 0.05. No difference was found for B7-H4 expression. Experiments were repeated four times. C, Survival of BALB/c after lethal irradiation 8 Gy and transplantation of 5 × 10⁶ BM cells and where indicated T cells (i.v. 1 × 10⁶) and DC (i.v. 1 × 10⁶) pretreated in vitro with (DC-RAPA) or without (DC) RAPA. In these studies, no additional RAPA was given to the BMT recipients. Upper survival graph, Donor type DC; lower survival graph, recipient type DC. Improved survival is seen when recipient type DC exposed to RAPA were used (recipient DC-R vs recipient DC, p = 0.02). D, upper panel, Representative BALB/c recipients from the indicated groups on day 6 after BMT. BMT was performed as described under C. Lower panel, Expansion of luc transgenic alloreactive T cells as quantified in photons/second/mouse over time (DC vs DC RAPA: p < 0.05 on days 7, 11, 13, and 17, BM+Tc vs DC RAPA: p < 0.05 on days 11, 13, 17, 23, and 27). E, Seven days after transplantation, mice from the indicated groups were sacrificed and sections of small bowel and large bowel were stained with H&E. Slides were analyzed by a pathologist blinded to the treatment groups (U. V. Gerlach) for evidence of pathologic damage. F, Serum levels of MCP-1 and IFN-γ derived from BMT recipients in the group receiving bone marrow alone (BM), with T cells and DC exposed to medium (DC Medium) or with T cells and DC exposed to RAPA. Each bar represents pooled data from three mice.
To study whether the previously reported tolerogenic phenotype of DC-R (12) is maintained in an inflammatory environment after aHCT, we monitored expression of MHC class II, CD80, CD86, and B7-H4 on donor type DC on day 25 re-isolated from transplanted animals (Fig. 5B). We found MFI to be reduced in the RAPA as compared with the PBS group for MHC class II (23 ± 1 vs 47 ± 2, p = 0.02), CD80 (19 ± 2 vs 52 ± 3, p = 0.014), and CD86 (24 ± 2 vs 53 ± 2, p = 0.03). Interestingly, RAPA did not reduce the expression of B7-H4 as a negative regulator of T cell proliferation (31).
Since previous studies had shown that CD80 and CD86 expression by donor DC was critical for GvHD development (8), we studied the effects of donor or recipient type DC transferred with the BM graft with or without previous exposure to RAPA. In these studies, no additional RAPA was given to the BMT recipients. Adoptive transfer of DC-R did not significantly reduce GvHD severity when they were donor derived (Fig. 5C, upper panel). In contrast, adoptive transfer of DC-R of host origin led to improved survival of BMT recipient mice (Fig. 5C, lower panel). Compatible with reduced GvHD severity, the expansion of luc transgenic allogeneic T cells was decreased in the presence of host type DC-R as compared with untreated host DC (Fig. 5D). In a dose response study with three different dosages of DC (1 × 10⁵, 5 × 10⁵, or 1 × 10⁶ i.v. on day 0), we found that 1 × 10⁵ DC-RAPA was not sufficient to achieve protection from GvHD, while at a dose of 5 × 10⁵ RAPA-DC a certain degree of protection with a survival of 30% (DC-RAPA) vs 0% (DC medium) was seen (data not shown). Histopathological GvHD-scoring day 7 after BMT identified the DC-RAPA group as having a significantly lower disease score as compared with the DC medium group (p = 0.03) (Fig. 5E).
We observed significantly reduced serum levels of MCP-1 (p = 0.044) and a trend toward reduced IFN-γ serum levels (p = 0.067) in the RAPA-DC group as compared with the DC medium group (Fig. 5F), indicative for an impact on proinflammatory cytokine production. Numbers of CD4+Foxp3+ and CD4+IL-10+ cells were unchanged independent of DC-RAPA transfer (data not shown).
Intact lymphoid homing of DC in the presence of mTOR inhibition by RAPA
To compare the migration patterns of DC in the presence vs the absence of RAPA, we used our previously established MRI platform. SPIO+ CD11c+ cells were injected in the right proximal leg after BMT. DC had been incubated for 24 h with SPIO-IgG ± RAPA 100 ng/ml in cRPMI. BMT recipients were injected daily with RAPA (1.5 mg/kg body weight i.p.) or PBS. Interestingly, we found that DC-R displayed comparable in vivo migration capacity from the local injection site toward the cervical lymph node as their untreated counterparts (Fig. 6A). The DC migration kinetics observed by MRI were comparable with the pattern seen in the BLI studies (Fig. 3A). The observation that donor DC were confined to the body side of injection suggests that DC most likely use the lymphatic vessels rather than the blood stream in the early phase after aHCT to migrate toward the compartments that display lymphotactic stimuli. To further verify whether DC that had initially been loaded with the SPIO-IgG complexes can be detected in the cervical lymph nodes where MRI signal was visible, these were surgically removed and immunhistological analysis demonstrated FITC signal (green) within CD11c (red) DC in the cervical lymph nodes that had demonstrated MRI signal disruption (Fig. 6B).
FIGURE 6.
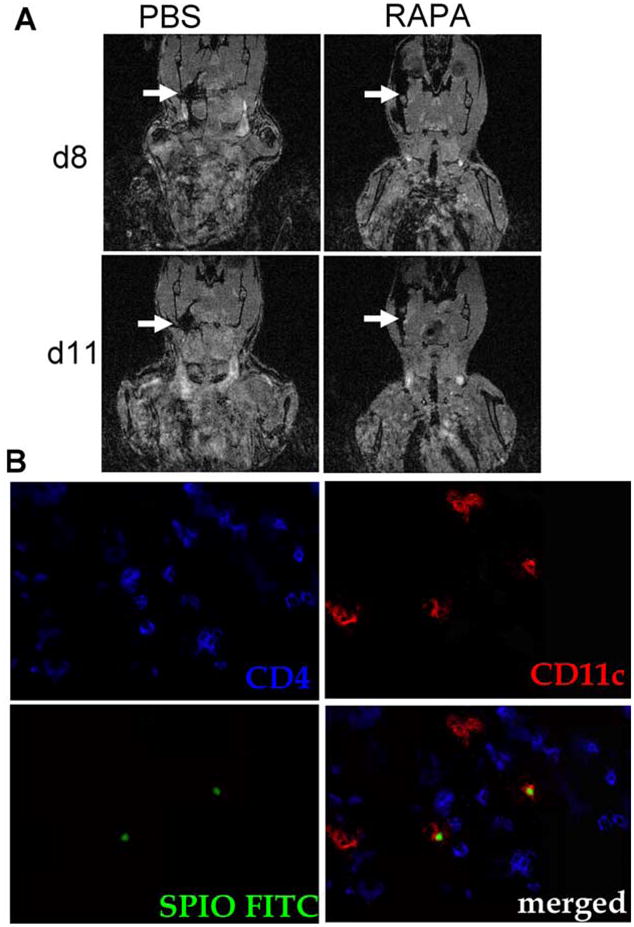
RAPA exposed DC home with comparable kinetics as the control to the cervical lymph nodes after aHCT. A, Local injection of 2 × 10⁶ SPIO+CD11c+ cells in the right proximal leg 30 min after BMT (C57B/6→BALB/c). DC had been incubated for 24 h with SPIO-IgG ± RAPA 100 ng/ml in cRPMI. BMT recipients were injected daily with RAPA (1.5 mg/kg body weight i.p.) or PBS. Signal disruption in the cervical region is found on days 8 and 11 when PBS or RAPA is injected. Experiments were repeated two times. B, Immunofluorescence detection of SPIO+ DC within the right cervical lymph node of an animal receiving DC that had been incubated for 24 h with RAPA 100 ng/ml and was injected daily with RAPA (1.5 mg/kg body weight i.p.). The lymph node was removed on day 12 after aHCT. SPIO-IgG FITC: green, CD11c: red, CD4: blue, original magnification ×600.
H&E staining revealed comparable amounts of iron-positive cells in both groups (Fig. 7A). To analyze the survival of donor type DC under in vivo RAPA treatment, we quantified these cells in different lymph node regions and found that RAPA did not impact the number of donor DC in the lymphoid compartment (Fig. 7B). These data indicate that RAPA-conditioned DC maintained a tolerogenic phenotype, were fully capable of migrating to the lymphoid compartment where immunoregulation is required after aHCT.
FIGURE 7.
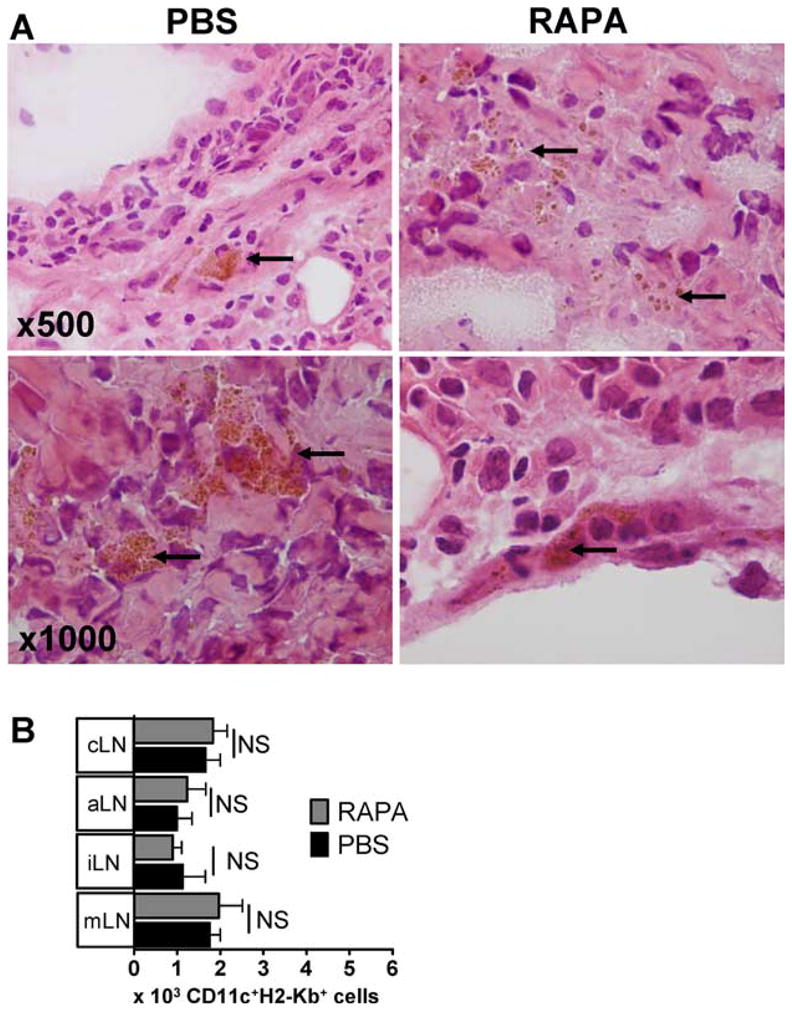
DC that have been cultured with RAPA home with comparable kinetics as the control to the cervical lymph nodes (cLN) after aHCT. A, Local injection of 2 × 10⁶ SPIO+CD11c+ cells in the right proximal leg 30 min after BMT (C57B/6→BALB/c). DC had been incubated for 24 h with SPIO-IgG ± RAPA 100 ng/ml in cRPMI. BMT recipients were injected daily with RAPA (1.5 mg/kg body weight i.p.) or PBS. cLN were harvested on day 12 post BMT and stained by H&E. Local iron deposits reflects SPIO loaded cells are in brown (original magnification: ×500 and ×1000). Experiments were repeated 2 times. B, Transplants were performed as described under A. Absolute numbers of donor type (H-2kbCD11c+) DC were isolated from the cLN of transplanted animals on day 12. Recipients had been pretreated in vitro and in vivo with RAPA as described under A, p > 0.05.
Discussion
Cell tracking during GvHD as an allo-immune response is crucial to understand the complex interactions between activating and inhibitory cell populations that determine outcomes such as GvHD and graft-vs-tumor reactions. A critical cell population for GvHD development is a DC of host (7) and donor origin (8) that present Ags to the incoming T cells. Recent data indicate that the DC pool consists of different cell types that are heterogeneous in phenotype and function (5) and that shifting the DC phenotype toward a more tolerogenic phenotype can help to promote tolerance in different models of alloreactivity (12, 32, 33). In the present study, we report that in vitro and in vivo exposure of DC to RAPA induces a stable tolerogenic phenotype and allows for comparable expression levels of the chemokine receptor CCR7 that binds the chemokines CCL19 and CCL21 (29) and promotes homing to secondary lymphoid tissue during the proinflammatory immune response that ensues after aHCT. These data are compatible with studies by others demonstrating intact migration of RAPA-conditioned DC in a heart allograft model (12) and high levels of CCR7 expression on human monocyte-derived DC after RAPA exposure (34). Furthermore, expression levels of CCR5 and CD62L were similar in the presence as compared with the absence of RAPA. Most importantly, we found that even during GvHD as an uncontrolled immune response with an array of proinflammatory cytokines being secreted (35) the expression levels of costimulatory molecules and MHC class II were reduced in RAPA-exposed DC as compared with DC from the PBS control group. These data support the concept that RAPA renders DC resistant to maturation, which may partly explain its recently described beneficial effects on the incidence of GvHD in clinical trials (19, 20). In line with this concept, previous studies have demonstrated that in vitro treatment with RAPA renders DC resistant to stimuli that induce maturation, such as CD40 ligation (12), TLR ligands (15), and IL-4 (13). Most importantly, we observed reduced expansion of allo-reactive T cells when RAPA-conditioned DC were injected together with the graft, which was consistent with improved survival of this group. The observed reduction of MCP-1 and IFN-γ serum levels in the RAPA-DC group indicates that the modified DC affect proinflammatory cytokine production. These data indicate that directed modification of the DC phenotype by mTOR inhibition may have therapeutic potential in an attempt to reduce GvHD following aHCT.
To study the migratory capacity of DC in the presence of RAPA after aHCT, MRI- and BLI-based imaging platforms were established. By using SPIO-IgG complexes, we achieved a high uptake rate of the nanoparticles via Fc-γR-mediated endocytosis, a mechanism that been previously reported to be used by DC subsets (36). Initial studies demonstrated that SPIO-labeled DC populations could be visualized by MRI when concentrated in agarose gel. In vivo we studied the migration of total CD11c+ DC from a local injection site and found them to migrate toward lymph nodes of aHCT recipients at the same time as donor conventional T cells and Treg (21), suggesting an interaction at the early time points after transplantation. Our observation that DC can be effectively tracked by means of MRI following in vivo administration are consistent with previous reports that SPIO-loaded DC can be tracked by MRI in mice and in humans (26, 37).
In conclusion, this study is the first to delineate the trafficking pattern of DC by means of a combined approach including MRI and BLI in the presence vs absence of immunosuppression by RAPA after aHCT. We found that BLI is ideal for the determination that anatomical area is of interest while MRI studies of this specific region can then provide more information on the localization of labeled cells in the anatomical context in a noninvasive manner. Our data indicate that RAPA-preconditioned DC displayed normal chemokine receptor repertoire and intact in vivo migration after aHCT, which is crucial for trafficking toward sites where immunoregulation is required. Furthermore, down-regulation of costimulatory molecules and MHC class II were stable in the presence of RAPA and reduced T cell alloreactivity after aHCT, which has important implications for clinical strategies that aim to decrease GvHD incidence.
Acknowledgments
We thank Sophie Krüger and Volker Schmid for technical assistance.
Footnotes
Abbreviations used in this paper: aHCT, allogeneic hematopoietic cell transplantation; DC, dendritic cell; Treg, regulatory T cell; GvHD, graft-vs-host disease; RAPA, rapamycin; mTOR, mammalian target of RAPA; BLI, bioluminescence imaging; MRI, magnetic resonance imaging; SPIO, superparamagnetic iron oxide; PI, propidium iodide; wt, wild type; BMT, bone marrow transplantation; RT, room temperature; DAPI, 4′,6-diamidino-2-phenylindole.
Disclosures
The authors have no financial conflict of interest.
This work was supported by grants from the National Institutes of Health (R01 CA0800065 to R.S.N.) and in part by the Deutsche Krebshilfe, Germany Grant 108034 (to R.Z.).
References
- 1.Sprent J, Schaefer M, Lo D, Korngold R. Properties of purified T cell subsets. II. In vivo responses to class I vs. class II H-2 differences. J Exp Med. 1986;163:998–1011. doi: 10.1084/jem.163.4.998. [DOI] [PMC free article] [PubMed] [Google Scholar]
- 2.Baker J, Verneris MR, Ito M, Shizuru JA, Negrin RS. Expansion of cytolytic CD8+ natural killer T cells with limited capacity for graft-versus-host disease induction due to interferon γ production. Blood. 2001;97:2923–2931. doi: 10.1182/blood.v97.10.2923. [DOI] [PubMed] [Google Scholar]
- 3.Ruggeri L, Capanni M, Urbani E, Perruccio K, Shlomchik WD, Tosti A, Posati S, Rogaia D, Frassoni F, Aversa F, et al. Effectiveness of donor natural killer cell alloreactivity in mismatched hematopoietic transplants. Science. 2002;295:2097–2100. doi: 10.1126/science.1068440. [DOI] [PubMed] [Google Scholar]
- 4.Edinger M, Hoffmann P, Ermann J, Drago K, Fathman CG, Strober S, Negrin RS. CD4+CD25+ regulatory T cells preserve graft-vs-tumor activity while inhibiting graft-vs-host disease after bone marrow transplantation. Nat Med. 2003;9:1144–1149. doi: 10.1038/nm915. [DOI] [PubMed] [Google Scholar]
- 5.Steinman RM, Hawiger D, Nussenzweig MC. Tolerogenic dendritic cells. Annu Rev Immunol. 2003;21:685–689. doi: 10.1146/annurev.immunol.21.120601.141040. [DOI] [PubMed] [Google Scholar]
- 6.Tang Q, Adams JY, Tooley AJ, Bi M, Fife BT, Serra P, Santamaria P, Locksley RM, Krummel MF, Bluestone JA. Visualizing regulatory T cell control of autoimmune responses in nonobese diabetic mice. Nat Immunol. 2005;7:83–92. doi: 10.1038/ni1289. [DOI] [PMC free article] [PubMed] [Google Scholar]
- 7.Shlomchik WD, Couzens MS, Tang CB, McNiff J, Robert ME, Liu J, Shlomchik MJ, Emerson SG. Prevention of graft-versus-host disease by inactivation of host antigen-presenting cells. Science. 1999;285:412–415. doi: 10.1126/science.285.5426.412. [DOI] [PubMed] [Google Scholar]
- 8.Anderson BE, McNiff JM, Jain D, Blazar BR, Shlomchik WD, Shlomchik MJ. Distinct roles for donor- and host-derived antigen-presenting cells and costimulatory molecules in murine chronic graft-versus-host disease: requirements depend on target organ. Blood. 2005;105:2227–2234. doi: 10.1182/blood-2004-08-3032. [DOI] [PubMed] [Google Scholar]
- 9.Zeiser R, V, Nguyen H, Beilhack A, Buess M, Schulz S, Baker J, Contag CH, Negrin RS. Inhibition of CD4+CD25+ regulatory T cell function by calcineurin dependent interleukin-2 production. Blood. 2006;108:390–399. doi: 10.1182/blood-2006-01-0329. [DOI] [PMC free article] [PubMed] [Google Scholar]
- 10.Battaglia M, Stabilini A, Roncarolo MG. Rapamycin selectively expands CD4+CD25+FoxP3+ regulatory T cells. Blood. 2005;105:4743–4748. doi: 10.1182/blood-2004-10-3932. [DOI] [PubMed] [Google Scholar]
- 11.Battaglia M, Stabilini A, Migliavacca B, Horejs-Hoeck J, Kaupper T, Roncarolo MG. Rapamycin promotes expansion of functional CD4+CD25+FOXP3+ regulatory T cells of both healthy subjects and type 1 diabetic patients. J Immunol. 2006;177:8338–8347. doi: 10.4049/jimmunol.177.12.8338. [DOI] [PubMed] [Google Scholar]
- 12.Turnquist HR, Raimondi G, Zahorchak AF, Fischer RT, Wang Z, Thomson AW. Rapamycin-conditioned dendritic cells are poor stimulators of allogeneic CD4+ T cells, but enrich for antigen-specific Foxp3+ T regulatory cells and promote organ transplant tolerance. J Immunol. 2007;178:7018–7031. doi: 10.4049/jimmunol.178.11.7018. [DOI] [PubMed] [Google Scholar]
- 13.Hackstein H, Taner T, Zahorchak AF, Morelli AE, Logar AJ, Gessner A, Thomson AW. Rapamycin inhibits IL-4-induced dendritic cell maturation in vitro and dendritic cell mobilization and function in vivo. Blood. 2003;101:4457–4463. doi: 10.1182/blood-2002-11-3370. [DOI] [PubMed] [Google Scholar]
- 14.Hackstein H, Taner T, Logar AJ, Thomson AW. Rapamycin inhibits macropinocytosis and mannose receptor-mediated endocytosis by bone marrow-derived dendritic cells. Blood. 2002;100:1084–1087. doi: 10.1182/blood.v100.3.1084. [DOI] [PubMed] [Google Scholar]
- 15.Monti P, Mercalli A, Leone BE, Valerio DC, Allavena P, Piemonti L. Rapamycin impairs antigen uptake of human dendritic cells. Transplantation. 2003;75:137–145. doi: 10.1097/00007890-200301150-00025. [DOI] [PubMed] [Google Scholar]
- 16.Chiang PH, Wang L, Liang Y, Liang X, Qian S, Fung JJ, Bonham CA, Lu L. Inhibition of IL-12 signaling Stat4/IFN-γ pathway by rapamycin is associated with impaired dendritic (correction of dendritc) cell function. Transplant Proc. 2002;34:1394–1395. doi: 10.1016/s0041-1345(02)02900-7. [DOI] [PubMed] [Google Scholar]
- 17.Woltman AM, de Fijter JW, Kamerling SW, van Der Kooij SW, Paul LC, Daha MR, van Kooten C. Rapamycin induces apoptosis in monocyte- and CD34-derived dendritic cells but not in monocytes and macrophages. Blood. 2001;98:174–180. doi: 10.1182/blood.v98.1.174. [DOI] [PubMed] [Google Scholar]
- 18.Woltman AM, van der Kooij SW, Coffer PJ, Offringa R, Daha MR, van Kooten C. Rapamycin specifically interferes with GM-CSF signaling in human dendritic cells, leading to apoptosis via increased p27KIP1 expression. Blood. 2003;101:1439–1445. doi: 10.1182/blood-2002-06-1688. [DOI] [PubMed] [Google Scholar]
- 19.Antin JH, Kim HT, Cutler C, Ho VT, Lee SJ, Miklos DB, Hochberg EP, Wu CJ, Alyea EP, Soiffer RJ. Sirolimus, tacrolimus, and low-dose methotrexate for graft-versus-host disease prophylaxis in mismatched related donor or unrelated donor transplantation. Blood. 2003;102:1601–1605. doi: 10.1182/blood-2003-02-0489. [DOI] [PubMed] [Google Scholar]
- 20.Cutler C, Li S, Ho VT, Koreth J, Alyea E, Soiffer RJ, Antin JH. Extended follow-up of methotrexate-free immunosuppression using sirolimus and tacrolimus in related and unrelated donor peripheral blood stem cell transplantation. Blood. 2007;109:3108–3114. doi: 10.1182/blood-2006-09-046219. [DOI] [PMC free article] [PubMed] [Google Scholar]
- 21.Zeiser R, V, Nguyen H, Hou JZ, Beilhack A, Zambricki EA, Buess M, Contag CH, Negrin RS. Early CD30 signaling is critical for adoptively transferred CD4+CD25+ regulatory T cells in prevention of acute graft versus host disease. Blood. 2007;109:2225–2233. doi: 10.1182/blood-2006-07-038455. [DOI] [PMC free article] [PubMed] [Google Scholar]
- 22.Verdijk P, Scheenen TW, Lesterhuis WJ, Gambarota G, Veltien AA, Walczak P, Scharenborg NM, Bulte JW, Punt CJ, Heerschap A, et al. Sensitivity of magnetic resonance imaging of dendritic cells for in vivo tracking of cellular cancer vaccines. Int J Cancer. 2007;120:978–984. doi: 10.1002/ijc.22385. [DOI] [PubMed] [Google Scholar]
- 23.Cao YA, Wagers AJ, Beilhack A, Dusich J, Bachmann MH, Negrin RS, Weissman IL, Contag CH. Shifting foci of hematopoiesis during reconstitution from single stem cells. Proc Natl Acad Sci USA. 2004;101:221–226. doi: 10.1073/pnas.2637010100. [DOI] [PMC free article] [PubMed] [Google Scholar]
- 24.Beilhack A, Schulz S, Baker J, Beilhack GF, Wieland CB, Herman EI, Baker EM, Cao YA, Contag CH, Negrin RS. In vivo analyses of early events in acute graft-versus-host disease reveal sequential infiltration of T cell subsets. Blood. 2005;106:1113–1122. doi: 10.1182/blood-2005-02-0509. [DOI] [PMC free article] [PubMed] [Google Scholar]
- 25.Phung TL, Eyiah-Mensah G, O’Donnell RK, Bieniek R, Shechter S, Walsh K, Kuperwasser C, Benjamin LE. Endothelial Akt signaling is rate-limiting for rapamycin inhibition of mouse mammary tumor progression. Cancer Res. 2007;67:5070–5075. doi: 10.1158/0008-5472.CAN-06-3341. [DOI] [PMC free article] [PubMed] [Google Scholar]
- 26.De Vries IJ, Lesterhuis WJ, Barentsz JO, Verdijk P, van Krieken JH, Boerman OC, Oyen WJ, Bonenkamp JJ, Boezeman JB, Adema GJ. Magnetic resonance tracking of dendritic cells in melanoma patients for monitoring of cellular therapy. Nat Biotechnol. 2005;23:1407–1413. doi: 10.1038/nbt1154. [DOI] [PubMed] [Google Scholar]
- 27.Ahrens ET, Feili-Hariri M, Xu H, Genove G, Morel PA. Receptor-mediated endocytosis of iron-oxide particles provides efficient labeling of dendritic cells for in vivo MR imaging. Magn Reson Med. 2003;49:1006–1013. doi: 10.1002/mrm.10465. [DOI] [PubMed] [Google Scholar]
- 28.Zeiser R, Leveson-Gower DB, Zambricki EA, Kambham N, Beilhack A, Loh J, Hou JZ, Negrin RS. Differential impact of mTOR inhibition on CD4+CD25+Foxp3+ regulatory T cells as compared to conventional CD4+ T cells. Blood. 2008;111:453–462. doi: 10.1182/blood-2007-06-094482. [DOI] [PMC free article] [PubMed] [Google Scholar]
- 29.Dieu MC, Vanbervliet B, Vicari A, Bridon JM, Oldham E, Aït-Yahia S, Brière F, Zlotnik A, Lebecque S, Caux C. Selective recruitment for immature and mature dendritic cells by distinct chemokines expressed in different anatomic sites. J Exp Med. 1998;188:373–386. doi: 10.1084/jem.188.2.373. [DOI] [PMC free article] [PubMed] [Google Scholar]
- 30.Ngo VN, Tang HL, Cyster JG. Epstein-Barr virus-induced molecule 1 ligand chemokine is expressed by dendritic cells in lymphoid tissues and strongly attracts naive T cells and activated B cells. J Exp Med. 1998;188:181–191. doi: 10.1084/jem.188.1.181. [DOI] [PMC free article] [PubMed] [Google Scholar]
- 31.Sica GL, I, Choi H, Zhu G, Tamada K, Wang SD, Tamura H, Chapoval AI, Flies DB, Bajorath J, Chen L. B7–H4, a molecule of the B7 family, negatively regulates T cell immunity. Immunity. 2003;18:849–861. doi: 10.1016/s1074-7613(03)00152-3. [DOI] [PubMed] [Google Scholar]
- 32.Reddy V, Hill GR, Pan L, Gerbitz A, Teshima T, Brinson Y, Ferrara JL. G-CSF modulates cytokine profile of dendritic cells and decreases acute graft-versus-host disease through effects on the donor rather than the recipient. Blood. 2000;69:691–693. doi: 10.1097/00007890-200002270-00041. [DOI] [PubMed] [Google Scholar]
- 33.Xua H, Chena T, Wanga HQ, Huaa YB, Wu WW. Combination treatment with donor interleukin-12p35 silenced dendritic cells and cyclosporine induces long-term survival of intestinal allografts in rats. Transplant Proc. 2007;39:286–288. doi: 10.1016/j.transproceed.2006.10.229. [DOI] [PubMed] [Google Scholar]
- 34.Sordi V, Bianchi G, Buracchi C, Mercalli A, Marchesi F, D’Amico G, Yang CH, Luini W, Vecchi A, Mantovani A, et al. Differential effects of immunosuppressive drugs on chemokine receptor CCR7 in human monocyte-derived dendritic cells: selective up-regulation by rapamycin. Transplantation. 2006;82:826–834. doi: 10.1097/01.tp.0000235433.03554.4f. [DOI] [PubMed] [Google Scholar]
- 35.Ferrara JL, Cooke KR, Teshima T. The pathophysiology of acute graft-versus-host disease. Int J Hematol. 2003;78:181–187. doi: 10.1007/BF02983793. [DOI] [PubMed] [Google Scholar]
- 36.Benitez-Ribas D, Adema GJ, Winkels G, Klasen IS, Punt CJ, Figdor CG, de Vries IJ. Plasmacytoid dendritic cells of melanoma patients present exogenous proteins to CD4+ T cells after Fc γ RII-mediated uptake. J Exp Med. 2006;203:1629–1635. doi: 10.1084/jem.20052364. [DOI] [PMC free article] [PubMed] [Google Scholar]
- 37.Ahrens ET, Flores R, Xu H, Morel PA. In vivo imaging platform for tracking immunotherapeutic cells. Nat Biotechnol. 2005;23:983–987. doi: 10.1038/nbt1121. [DOI] [PubMed] [Google Scholar]