Abstract
Cell detachment is central to a broad range of physiopathological changes, but there are no quantitative methods to study this process. Here we report programmed subcellular release, a method for spatially and temporally controlled cellular detachment, and present quantitative results of the detachment dynamics of 3T3 fibroblasts at the subcellular level.
The dynamic attachment and detachment of cells to and from their extracellular milieu regulates cell motility and is critical for embryonic development, the inflammatory immune response, wound repair and metastasis of cancerous cells1. Cells on substrata form focal adhesion complexes that are spatially and temporally organized over the interface between the cell and the underlying extracellular matrix (ECM), and mediate a wide range of signaling and transduction functions2. Quantitative studies of cell adhesion have led to important mechanistic insights into the architecture and function of focal adhesions, as well as the regulatory processes that drive their assembly. A widely used method to study focal adhesion assembly is the cell-spreading assay3–6, whereby a cell initially in suspension is allowed to adhere to an underlying surface and focal adhesion formation is monitored using live-cell microscopy. This assay has a well-defined reference point in time that allows determination of the dynamics of focal adhesion formation. Current methods for studying cell detachment and focal adhesion disassembly include bulk microtubule disassembly by nocadozole7, a pharmacological approach that leads to uncontrolled off-target effects, and laser-induced disruption of actin stress fibers8,9 that does not allow for the investigation of the full cascade of subcellular events from the ECM to the subsequent reorganization of actin filaments and focal adhesion proteins.
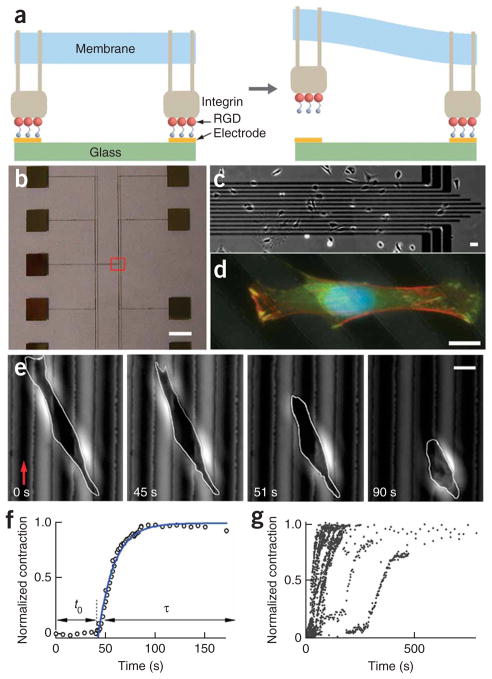
The platform for programmed subcellular release (Fig. 1a) is a chip-based device comprising an array of gold lines on a glass substrate fabricated using photolithography (Fig. 1b,c and Supplementary Methods online). We chemically tethered an adhesion-promoting arginine-glycine–aspartic acid (RGD) peptide sequence to the gold lines via a thiol linkage. When cells are plated on a device, the RGD sequence specifically binds integrins, the major receptors for cell-ECM adhesion. A computer-controlled low-voltage pulse to an individual gold line results in rapid (<1 s) desorption and detachment of the thiol groups (Supplementary Fig. 1 online). As an additional control, cells plated on devices with arginine-alanine–aspartic acid (RAD)-terminated thiol did not release (data not shown). Using lithographic techniques, the electrode width and spacing can be easily controlled and various device configurations can be used. Cell spreading and focal adhesion formation can be modified by functionalizing the glass surface with polyethylene glycol to limit focal adhesion formation between the gold lines. Unless otherwise stated, for all experiments reported here, we did not modify the glass, allowing focal adhesions to form on both the glass and gold electrodes (Fig. 1d). The gold lines are individually addressable, allowing for both spatial and temporal control of detachment at the subcellular level (Fig. 1e). Cells remained viable after release, and in some cases sequential release experiments could be performed (Supplementary Fig. 2 online).
Figure 1.
Programmed subcellular release. (a) Left schematic illustration showing RGD-integrin complexes formed at RGD-terminated thiols on gold electrodes. Right, electrochemical desorption of the tethered RGD peptide from a gold electrode, triggered by a small voltage pulse, results in local release of the RGD-integrin complexes. (b) Photograph of a device showing the electrode array (center of the device) and contact pads. (c) Low-resolution phase contrast image of one end of the electrode array (red box in b), with cells plated on the device. (d) Overlaid fluorescence images of a fixed 3T3 fibroblast spanning multiple electrodes (dark diagonal lines) stained for actin fibers (Alexafluor 568 phalloidin, red), vinculin (FITC anti-vinculin, green) and cell nucleus (DAPI, blue). (e) Phase contrast images during a typical cell release experiment. A voltage was applied to an electrode (red arrow) at t = 0 s. After release of the cell from the gold line on the left, there was an induction period before the cell began to contract. Scale bars, 4 mm (b), 40 μm (c) and 10 μm (d,e). (f) Plot of normalized cell contraction versus time for the cell shown in e. The induction time (t0) and contraction phase (τ) are indicated by the arrows. The solid line is a fit to the equation ΔL(t)/ΔLm = 1 − exp(−(t−t0)/τ), with t0 = 43 s and τ = 16 s. (g) Plot of the normalized cell contraction curves for 22 cells.
Upon local release of RGD peptides from a preselected electrode at the cell periphery (Fig. 1e), there was a delay in the overall morphological response of the cell (which we termed ‘induction time’), after which the cell contracted and eventually reached a new configuration of smaller area in contact with the substratum (Fig. 1e and Supplementary Movies 1–3 online). We plotted the normalized extent of cell contraction as ΔL(t)/ΔLm (Fig. 1f), where ΔL(t) is the change in cell length at time t (Linital − L(t)) divided by the maximum change in cell length (Linital − Lfinal). The solid line in Figure 1f shows a good fit to the equation: ΔL(t)/ΔLm = 1 − exp(−(t − t0)/τ), where t0 is the induction time before retraction of the cell, and τ is the characteristic contraction time.
The morphological response of cells to local release is relatively uniform (Fig. 1g) with an average induction time of 57 ± 14 s (mean ± s.e.m.) and an average contraction time of 39 ± 7 s. High-resolution microscopy analysis revealed that after release of the RGD-thiol from the electrode there was no apparent change in cell morphology during the induction time (Supplementary Movie 3). After the induction period, the cell began to contract, and the ensuing change in cell morphology can be described by a macroscopic model of a cell under tension with a global contraction that is damped by both the internal viscoelastic friction and the friction between the cell surface and the substratum.
To establish the biological relevance of our method, we compared our subcellular release method to the spontaneous cell retraction, or tail snap, observed during normal cell motility on glass. The contraction associated with tail snap followed the same exponential dynamics with a characteristic contraction time within the limits reported above (Supplementary Fig. 3 online). A feature of normal cell locomotion is the observation that cellular material is often left behind on the substratum10,11. We often observed debris along the contraction axis after both programmed subcellular release and spontaneous cell contraction (Supplementary Fig. 4 online). We observed integrins in the debris but not elsewhere along the contraction axis (Supplementary Fig. 4).
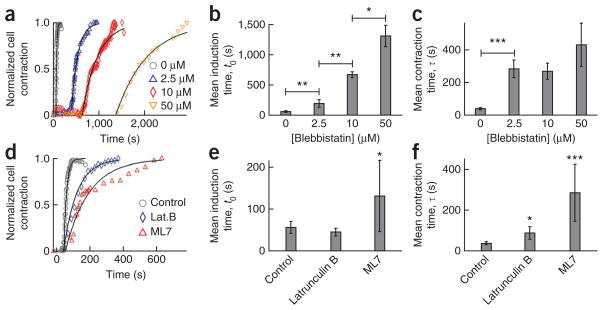
To determine whether programmed subcellular release can be used to study cytoskeletal regulators of cell detachment and focal adhesion disassembly, we used molecular inhibitors known to be associated with contractility (Fig. 2). The addition of blebbistatin, which inhibits the ATPase activity of the nonmuscle motor protein myosin II12, resulted in a progressive increase in both induction and contraction times with increasing concentration (Fig. 2a–c). This increase in contraction time was consistent with the decrease in tensile forces in the cell resulting from myosin II inhibition. The addition of the actin-depolymerizing drug latrunculin B13 decreases the stiffness and contractile forces in adherent cells14. The increase in contraction time of cells treated with latrunculin B (Fig. 2d–f) can be explained by a reduction of the intracellular stiffness and prestress in the cytoplasm. Treatment of cells with upstream regulators of actin filament contraction, such as myosin light chain kinase inhibitor ML-7, greatly increased the average contraction time and slightly increased the average induction time (Fig. 2d–f). Taken together, these results implicate actomyosin contractility in the control of both the induction and contraction phases of release.
Figure 2.
Programmed subcellular release in the presence of cytoskeleton inhibitors. (a–c) Normalized cell contraction curves and mean induction and contraction times with 0 μM (n = 18), 2.5 μM (n = 4), 10 μM (n = 3) and 50 μM (n = 3) blebbistatin. (d–f) Normalized cell contraction curves and mean induction and contraction times for cells treated with: 0.3 μM (n = 3) latrunculin B and 20 μM (n = 3) ML7 on cell release. *P < 0.05; **P < 0.01; ***P < 0.001. Error bars, s.e.m.
The distribution of induction times was not random (that is, it did not follow Poisson statistics; Fig. 1g), which suggests that the cell acted as a signal integrator and that this initial ‘incubation’ phase was not a stochastic but rather an activated process that depends critically on actomyosin contractility (Fig. 2b). The ensuing contraction phase was well-described by a viscoelastic relaxation model, which depends on actin filament assembly and contractility.
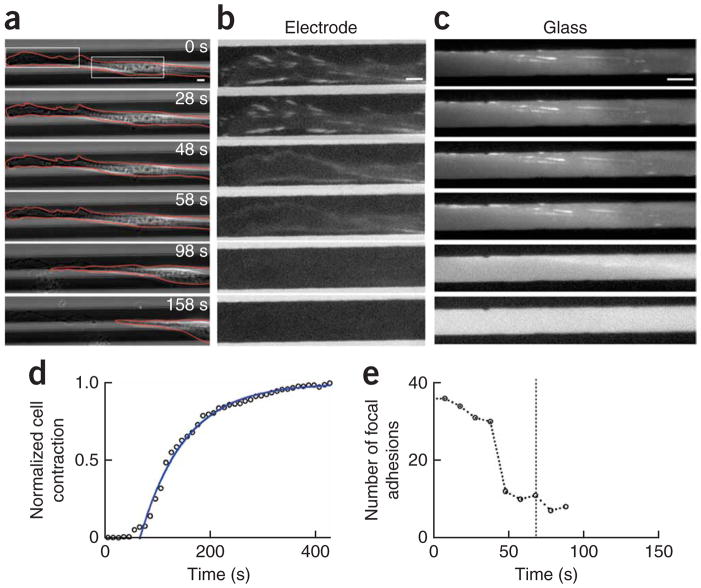
To determine the dynamics of focal adhesions and actin stress fibers during the induction and ensuing cell contraction, we imaged live cells expressing GFP-labeled paxillin (GFP-paxillin; Fig. 3) or GFP-labeled actin (lifeact-GFP15; Supplementary Fig. 5 online). Cells transfected with either GFP-paxillin (Fig. 3b,c) or lifeact-GFP (Supplementary Fig. 5c) showed the same contraction dynamics as described above with induction and contraction times in the range observed for nontransfected cells, indicating that the contraction dynamics were not influenced by transfection. Live-cell imaging of GFP-paxillin revealed that focal adhesions on the release electrode disappeared during the induction period (59 s) (Fig. 3a,b) whereas focal adhesions on the glass adjacent to the release electrode remained visible during the induction time (Fig. 3c). The number of focal adhesions decreased slightly during the first 40 s but then decreased dramatically before the onset of global cell contraction (Fig. 3d,e). We obtained similar results in a population-averaged morphometric analysis of vinculin, another focal adhesion protein (data not shown). Subsequent image analysis revealed no change in focal adhesion size and shape during the induction time (data not shown). Control experiments with the Rho inhibitor C3 transferase confirmed that the focal adhesions are Rho-dependent. The disappearance of focal adhesions on the release electrode before the onset of cell contraction was most likely associated with the contraction of actin stress fibers in the cell (Supplementary Fig. 5).
Figure 3.
Cell detachment and focal adhesion dynamics. (a) Phase contrast images of cell release (top electrode) of a 3T3 fibroblast transfected with GFP-paxillin. Cellular debris is seen along the contraction trajectory after release (98 and 158 s). (b) Fluorescence images of the regions of the cell (left box in a): focal adhesions on the release electrode during release and cell contraction (the contrast was enhanced for clarity; see Supplementary Methods. (c) Fluorescence images of the regions of the cell in a indicated by the white box at the right: focal adhesions on the glass during release and cell contraction. All bars, 5 μm. (d) Normalized cell contraction versus time for the cell in a with t0 = 68 s and τ = 85 s. (e) The total number of focal adhesions versus time for the cell shown in a.
Live-cell imaging of actin dynamics revealed that the actin stress fibers began to contract before cell contraction (Supplementary Fig. 5a–f). In this example, the induction time for cell contraction was 65 s; however, the actin stress fibers began to contract after 38 s. Furthermore, the contraction of the stress fibers exhibited exponential dynamics, with a characteristic contraction time of 95 s that was similar to the contraction time of the cell of 91 s. These results suggest that the detachment and the contraction of the actin stress fibers before the onset of global cell contraction is associated with the disappearance of the focal adhesions on the release electrode.
Here we demonstrated that programmed subcellular release of cells can be used to functionally probe focal adhesion, actin filament and cell detachment dynamics by releasing cells in a spatially and temporally controlled manner.
Supplementary Material
Acknowledgments
This work was supported by US National Institutes of Health (D.W. and P.C.S.), National Science Foundation (P.C.S.), Howard Hughes Medical Institution (D.W. and P.C.S.) and the Achievement Awards for College Scientists foundation (B.W.). We thank members of Wirtz and Searson laboratories for technical advice and reagents, S. Sun for useful discussions and H. Vo for assistance with microfabrication of devices.
Footnotes
Note: Supplementary information is available on the Nature Methods website.
Reprints and permissions information is available online at http://npg.nature.com/reprintsandpermissions/
References
- 1.Lauffenburger DA, Horwitz AF. Cell. 1996;84:359–369. doi: 10.1016/s0092-8674(00)81280-5. [DOI] [PubMed] [Google Scholar]
- 2.Schwartz MA, Schaller MD, Ginsberg MH. Annu Rev Cell Dev Biol. 1995;11:549–599. doi: 10.1146/annurev.cb.11.110195.003001. [DOI] [PubMed] [Google Scholar]
- 3.Dobereiner HG, Dubin-Thaler B, Giannone G, Xenias HS, Sheetz MP. Phys Rev Lett. 2004;93:108105. doi: 10.1103/PhysRevLett.93.108105. [DOI] [PubMed] [Google Scholar]
- 4.Galbraith CG, Sheetz MP. Curr Opin Cell Biol. 1998;10:566–571. doi: 10.1016/s0955-0674(98)80030-6. [DOI] [PubMed] [Google Scholar]
- 5.Raucher D, Sheetz MP. J Cell Biol. 2000;148:127–136. doi: 10.1083/jcb.148.1.127. [DOI] [PMC free article] [PubMed] [Google Scholar]
- 6.Giannone G, et al. Cell. 2004;116:431–443. doi: 10.1016/s0092-8674(04)00058-3. [DOI] [PubMed] [Google Scholar]
- 7.Ezratty EJ, Partridge MA, Gundersen GG. Nat Cell Biol. 2005;7:581–590. doi: 10.1038/ncb1262. [DOI] [PubMed] [Google Scholar]
- 8.Rajfur Z, Roy P, Otey C, Romer L, Jacobson K. Nat Cell Biol. 2002;4:286–293. doi: 10.1038/ncb772. [DOI] [PubMed] [Google Scholar]
- 9.Kumar S, et al. Biophys J. 2006;90:3762–3773. doi: 10.1529/biophysj.105.071506. [DOI] [PMC free article] [PubMed] [Google Scholar]
- 10.Regen CM, Horwitz AF. J Cell Biol. 1992;119:1347–1359. doi: 10.1083/jcb.119.5.1347. [DOI] [PMC free article] [PubMed] [Google Scholar]
- 11.Palecek SP, Schmidt CE, Lauffenburger DA, Horwitz AF. J Cell Sci. 1996;109:941–952. doi: 10.1242/jcs.109.5.941. [DOI] [PubMed] [Google Scholar]
- 12.Kovacs M, Toth J, Hetenyi C, Malnasi-Csizmadia A, Sellers JR. J Biol Chem. 2004;279:35557–35563. doi: 10.1074/jbc.M405319200. [DOI] [PubMed] [Google Scholar]
- 13.Spector I, Shochet NR, Blasberger D, Kashman Y. Cell Motil Cytoskeleton. 1989;13:127–144. doi: 10.1002/cm.970130302. [DOI] [PubMed] [Google Scholar]
- 14.Lee JS, et al. Biophys J. 2007;93:2542–2552. doi: 10.1529/biophysj.106.102426. [DOI] [PMC free article] [PubMed] [Google Scholar]
- 15.Riedl J, et al. Nat Methods. 2008;5:605–607. doi: 10.1038/nmeth.1220. [DOI] [PMC free article] [PubMed] [Google Scholar]
Associated Data
This section collects any data citations, data availability statements, or supplementary materials included in this article.


