

Abstract
Stem cells depend on intrinsic and local factors to maintain their identity and activity, but they also sense and respond to changing external conditions. We previously showed that germline stem cells (GSCs) and follicle stem cells (FSCs) in the Drosophila ovary respond to diet via insulin signals. Insulin signals directly modulate the GSC cell cycle at the G2 phase, but additional unknown dietary mediators control both G1 and G2. Target of rapamycin, or TOR, is part of a highly conserved nutrient-sensing pathway affecting growth, proliferation, survival and fertility. Here, we show that optimal TOR activity maintains GSCs but does not play a major role in FSC maintenance, suggesting differential regulation of GSCs versus FSCs. TOR promotes GSC proliferation via G2 but independently of insulin signaling, and TOR is required for the proliferation, growth and survival of differentiating germ cells. We also report that TOR controls the proliferation of FSCs but not of their differentiating progeny. Instead, TOR controls follicle cell number by promoting survival, independently of either the apoptotic or autophagic pathways. These results uncover specific TOR functions in the control of stem cells versus their differentiating progeny, and reveal parallels between Drosophila and mammalian follicle growth.
Keywords: TOR, Stem cells, Cell cycle, Cell growth, Oogenesis, Drosophila
INTRODUCTION
Stem cells self-renew and produce differentiating progeny for tissue integrity and function (Potten and Loeffler, 1990). Local and intrinsic factors maintain stem cell properties (Li and Xie, 2005) but external and circulating factors also affect stem cells. Drosophila intestinal and mammalian neural stem cells increase proliferation upon damage via insulin-like signals (Amcheslavsky et al., 2009; Yan et al., 2006; Zhang et al., 2001). Hormones modulate mammary stem cells (LaMarca and Rosen, 2008). Dietary factors stimulate mouse embryonic and hematopoietic stem cell activity (Hinge et al., 2009; Kim et al., 2009). It remains largely unknown, however, whether stem cells and their progeny respond to systemic changes uniformly or more specifically.
The Drosophila ovary houses stem cells in the germarium, the anterior-most portion of each ovariole (Fig. 1A) (Li and Xie, 2005). Two or three germline stem cells (GSCs) in a specialized niche self-renew and produce cystoblasts, which divide four times with incomplete cytokinesis to form germline cysts containing one oocyte and fifteen nurse cells. Follicle stem cells (FSCs) self-renew and produce follicle cells that envelop each cyst to form an egg chamber, or follicle. After leaving the germarium, each follicle develops through fourteen stages, forming a mature oocyte. As the cyst grows, follicle cells divide mitotically until stage 7, when they begin endoreplicating. Yolk uptake or vitellogenesis initiates at stage 8 (Spradling, 1993). The control of distinct stem cell populations and their differentiating progeny can thus be probed in this system.
Fig. 1.
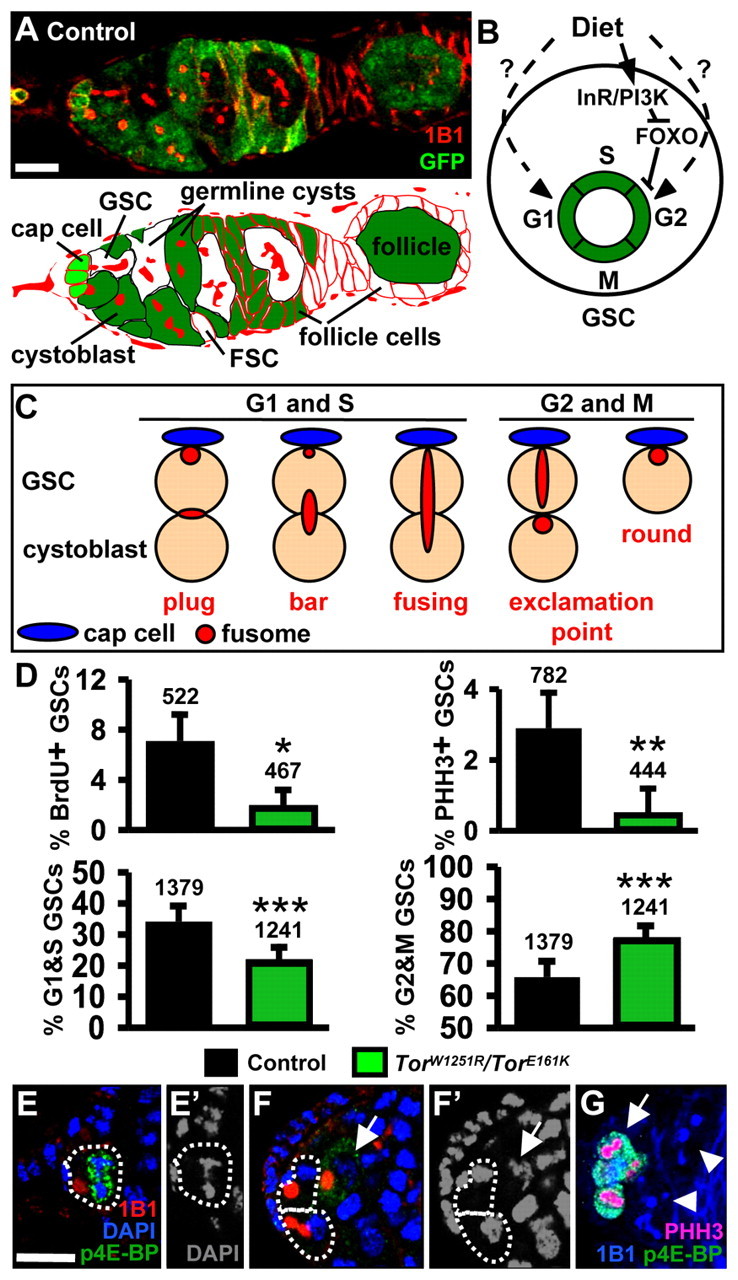
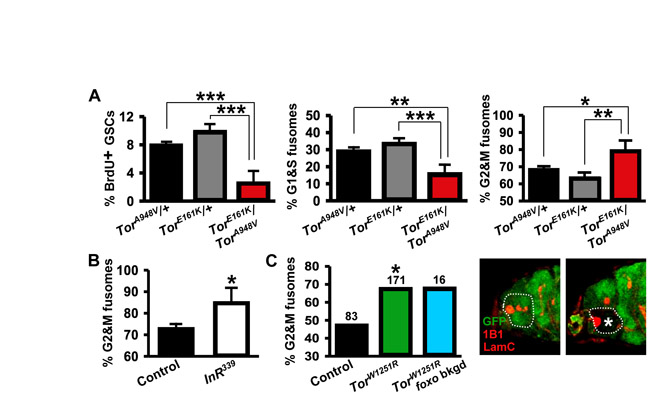
TOR controls GSC G2. (A) Lineage-traced germarium. Cells are labeled with GFP (green), except for a follicle stem cell (FSC), a germline stem cell (GSC) and their descendents. 1B1 (red) labels fusomes and follicle cell membranes. Cell types are indicated in the lower panel. GFP-negative GSCs and FSCs gave rise to GFP-negative cysts and follicle cells, respectively. (B) GSC division control by diet. InR regulates G2 via PI3 kinase and FOXO, whereas unknown factors regulate G1 and G2 (Hsu et al., 2008). (C) GSC fusome morphology. During G1 and S, the fusome has `plug', `bar' or `fusing' morphologies, whereas in G2 and M, the fusome has `exclamation point' or `round' morphologies (de Cuevas and Spradling, 1998; Hsu et al., 2008). (D) Frequencies of GSCs positive for BrdU (BrdU+, S marker) or PHH3 (PHH3+, M marker), or displaying `G1 and S' (G1&S) or `G2 and M' (G2&M) fusomes. Numbers above bars indicate the number of GSCs analyzed. (E) Phosphorylated 4E-BP (p4E-BP, green)-positive GSC in M. (F) p4E-BP-negative GSCs in interphase. 1B1, red; DAPI, DNA (blue). DAPI alone is shown in E′,F′. Arrows indicate a p4E-BP-positive cystoblast in M. (G) p4E-BP-positive cysts in M (arrow) and p4E-BP-negative cysts in interphase (arrowheads). PHH3 (pink), M marker; 1B1, blue. Error bars, s.d. *, P<0.03; **, P<0.01; ***, P<0.001. Scale bars: 10 μm.
Ovarian stem cells and their progeny respond to diet. On a protein-rich diet, GSCs and FSCs proliferate rapidly and their descendents divide and grow robustly. On a protein-poor diet, proliferation and growth are slowed, early germline cysts die and vitellogenesis is blocked (Drummond-Barbosa and Spradling, 2001). Insulin signaling is required for all responses, except early cyst viability (Drummond-Barbosa and Spradling, 2001; L.L. and D.D.-B., unpublished results). Insulin-like peptides directly promote GSC division, cyst growth and vitellogenesis (LaFever and Drummond-Barbosa, 2005) and indirectly control GSC maintenance (Hsu and Drummond-Barbosa, 2009). Insulin-like peptides promote GSC G2 progression through PI3 kinase and FOXO; however, additional diet mediators control both G1 and G2 (Fig. 1B) (Hsu et al., 2008).
The conserved TOR kinase regulates cell survival, growth and proliferation downstream of growth factors, amino acids, hormones and energy status (Wang and Proud, 2009). Tuberous sclerosis complex 1 (TSC1) and TSC2 inhibit TOR activity (Pan et al., 2004), and the TOR and insulin pathways cross-talk, but also have independent functions (Hietakangas and Cohen, 2009). Drosophila hypomorphic Tor mutants have small ovaries with frequent cell death and absent vitellogenic follicles (Zhang et al., 2006), although specific oogenesis processes requiring Tor have remained unclear.
This study reveals specific Tor roles in Drosophila GSCs versus FSCs. Although Tor is required for proper proliferation of GSCs and FSCs, it plays a major role in GSC, but not FSC, maintenance. TOR also differentially regulates stem cells versus their progeny. Tor is necessary for early cyst proliferation, growth and survival by preventing apoptosis. By contrast, TOR does not regulate follicle cell proliferation and controls follicle cell growth and survival independently of apoptosis or autophagy. Follicle cell TOR activity also affects underlying cyst growth. Finally, TOR regulates these processes via insulin-dependent and -independent mechanisms. These studies uncover specific roles for TOR in the control of stem cells and their differentiating progeny in the Drosophila ovary. TOR is a known nutrient sensor in many systems (Wang and Proud, 2009); we therefore speculate that TOR is part of a broadly conserved mechanism that ties stem cell maintenance and function, and the survival, proliferation and growth of their descendents, to diet-dependent factors.
MATERIALS AND METHODS
Drosophila culture and genetic mosaic analyses
Fly stocks were maintained at 22-25°C on standard medium. yw is a wild-type control. TorA948V, TorW1251R, TorE161K, TorP2293L, TorR248X, foxo21, foxo25, Tsc1Q87X, InRE19, InR339, Thor2 and Atg7d4 alleles and other genetic elements are described (Ashburner and Drysdale, 1994; Bernal and Kimbrell, 2000; Hsu et al., 2008; Juhasz et al., 2007; LaFever and Drummond-Barbosa, 2005; Tapon et al., 2001; Zhang et al., 2006).
Mosaic analyses of flipase (FLP)/FLP recognition target (FRT)-mediated stem-cell-derived clones, including cyst growth and GSC relative division rate measurements, were performed as described (LaFever and Drummond-Barbosa 2005; Hsu et al., 2008). Many rounds of stem cell division occur prior to our analyses (with the exception of the initial daughter cells from a newly mutant GSC); therefore, perdurance of wild-type products is not a concern. Early germline cysts were staged based on fusome morphology (de Cuevas and Spradling, 1998). Egg chambers were staged based on size and nuclear morphology (Spradling, 1993). GSC and FSC maintenance was measured as described (Song and Xie, 2003; Xie and Spradling, 1998). The fraction of germaria containing a GFP-negative GSC or FSC relative to total germarium number was measured at different times after heat-shock, starting at four days (T0). T0 values were set at 100% and remaining values normalized to T0. Results were subjected to a Student's t-test or Chi-square analysis.
Immunostaining and microscopy
Ovaries were fixed and stained with 4′,6-diamidino-2-phenylindole (DAPI) and antibodies as described (Hsu et al., 2008). Antibodies used were: mouse anti-β-Gal (Promega; 1:500), rabbit anti-GFP (Torrey Pines; 1:5000), rabbit anti-phosphohistone H3 (PHH3; Upstate Biotechnology; 1:250), guinea pig anti-Double-parked (DUP) (gift from T. Orr-Weaver, 1:500) (Whittaker et al., 2000), rat anti-BrdU (Accurate Biochemicals; 1:500), rabbit anti-phospho-4E-BP1 (Thr37/46; Cell Signaling Technology; 1:200), rabbit anti-Cleaved caspase-3 (Cell Signaling Technology; 1:50), mouse anti-Hts [1B1; Developmental Studies Hybridoma Bank (DSHB); 1:10], mouse α-spectrin (DSHB; 1:50), mouse anti-Cyclin B (CycB; DSHB; 1:20), mouse anti-Lamin C (LamC) (DSHB; 1:100), mouse anti-fasciclin III (FASIII; DSHB; 1:25), Alexa 488-, 568- or 633-conjugated goat anti-mouse, -rabbit, -guinea pig or -rat secondaries (Molecular Probes; 1:400). 5-bromo-2-deoxyuridine (BrdU) incorporation and detection were performed as described (Lilly and Spradling, 1996). ApopTag Fluorescein Direct In Situ Apoptosis Detection Kit (Millipore) was used as described (Drummond-Barbosa and Spradling, 2001). Samples mounted in Vectashield (Vector Lab) were analyzed using a Zeiss Axioplan 2, LSM 510 or LSM 700 confocal microscope.
Cell cycle analyses
GSC division cycle analyses were performed in 0- to 2-day-old females maintained for five days on yeasted standard medium as described (Hsu et al., 2008). Briefly, GSCs, identified by fusome morphology and cap cell juxtaposition, were scored using BrdU (S), PHH3 (M) and CycB (G2, M). CycE was not used to mark G1 because it is expressed during most of the GSC cell cycle (Hsu et al., 2008). Experiments were performed at least in triplicate and results subjected to Student's t-test.
To measure proliferation of FSCs, optical confocal sections 1.5 μm apart along the z-axis of germaria containing FSC-derived clones were analyzed. We identified the FSC as the anterior-most, marker-negative follicle cell in the region immediately anterior to the germarium 2A–2B border (Margolis and Spradling, 1995). FSCs and their immediate daughters typically lie just anterior to the bright FASIII-staining region (Nystul and Spradling, 2009). Each marker-negative FSC was scored as BrdU-positive or BrdU-negative, and percentages of BrdU-positive FSCs relative to total marker-negative FSC number were calculated. Follicle cell cycle in Tor mosaics was analyzed using CycB, BrdU, PHH3 and DUP (late G1 and S) (Thomer et al., 2004). Chi-square statistical analyses were performed.
Follicle cell size analysis
Relative follicle cell size was measured in mosaic follicle cell monolayers at stages when follicle cells normally undergo mitosis (stages 2-6) or endoreplication (stages 7-10). Using ImageJ 1.40g, Tor mutant or control GFP-negative follicle cell clones ranging from 2-16 cells were measured in arbitrary area units. For each measured GFP-negative clone, a similar measurement was made for an adjacent wild-type, GFP-positive follicle cell group of equal number, and the ratio between GFP-negative and GFP-positive areas obtained. Ten to sixty pairs of measurements were made for each mosaic genotype, and average ratios were expressed as a percentage and subjected to Student's t-test.
RESULTS
TOR controls GSC proliferation at G2 largely independently of insulin signaling
Insulin-like peptides partially mediate the G2 effects of diet, but additional mediators control both G1 and G2 (Hsu et al., 2008). To test if the nutrient-sensor TOR (Wang and Proud, 2009) controls GSC proliferation, we analyzed TorW1251R/TorE161K and TorA948V/TorE161K hypomorphic females, identifying GSCs by position and fusome morphology (Fig. 1C). Frequencies of 5-bromo-2-deoxyuridine (BrdU) and phosphohistone H3 (PHH3) labeling were significantly lower in Tor mutant GSCs than those of controls (Fig. 1D; see Fig. S1A in the supplementary material), indicating reduced proliferation rates.
To determine if Tor controls GSCs via a predominant effect on either G1 or G2, we used fusome morphology as a cell cycle marker (Fig. 1C) (de Cuevas and Spradling, 1998; Hsu et al., 2008). Tor mutant females had a higher frequency of GSCs with `G2 and M' fusomes, and a lower frequency of GSCs with `G1 and S' fusomes relative to controls (Fig. 1D; see Fig. S1A in the supplementary material). Thus, Tor mutant GSCs progress more slowly through G2. Interestingly, wild-type GSCs and dividing cysts display increased levels of phosphorylation of 4E-BP, the eukaryotic translation initiation factor 4E (eIF4E) binding protein, which serves as a TOR activity reporter (Miron et al., 2003) during M but not interphase (Fig. 1E-G), further suggesting that an increase in TOR activity might be necessary for the G2 to M transition.
To determine if TOR is required intrinsically or indirectly (e.g. through the niche) for GSC proliferation, we generated genetic mosaic females in which Tor mutant ovarian cells [recognized by the absence of a β-galactosidase (β-gal) or green fluorescent protein (GFP) marker] are present in the context of surrounding control cells. Alleles of increasing severity were used: TorW1251R, a hypomorph; TorP2293L, a kinase-dead; and TorR248X, a null. In mosaic germaria, the ratio of the number of progeny (i.e. cystoblasts and cysts) from the Tor mutant GSC to the number of progeny from the control GSC was markedly reduced relative to the corresponding ratio in mock mosaic germaria (Table 1; see Fig. 3A), consistent with the slower proliferation of Tor mutant GSCs.
Table 1.
Tor is required for germline cyst division, growth and vitellogenesis

Fig. 3.
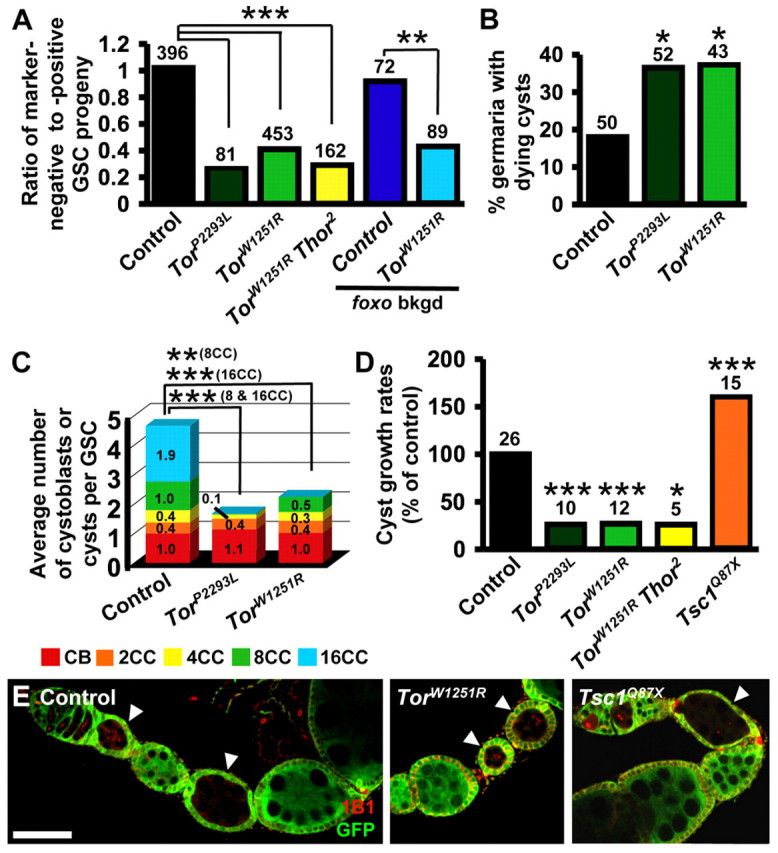
TOR regulates germline cyst proliferation, growth and survival independently of 4E-BP and FOXO. (A) Ratios of marker-negative to marker-positive GSC progeny in mosaic germaria. foxo bkgd indicates clones induced in foxo21/foxo25 females. (B) Percentage of germaria with TUNEL-marked dying cystoblasts and/or cysts. (C) Average number of marker-negative cystoblasts (CB) or cysts (2CC, 2-cell cyst; 4CC, 4-cell cyst; 8CC, 8-cell cyst; 16CC, 16-cell cyst) normalized per marker-negative GSC in control and Tor mosaics. (D) Growth rates (normalized to control) for marker-negative cysts in mosaics. Numbers above bars indicate the number of cystoblasts and cysts (A), mosaic germaria (B) or cysts (D) analyzed. *, P≤0.04; **, P≤0.02; ***, P≤0.001. (E) Control, TorW1251R or Tsc1Q87X cysts (arrowheads) in mosaics. 1B1 (red), cell membranes; GFP (green), wild-type cells. Scale bar: 50 μm.
To directly test for an intrinsic effect of Tor on the cell cycle, we analyzed fusome morphology in genetic mosaics. As a control experiment, we analyzed germaria mosaic for an insulin receptor mutation, InR339 (see Fig. S1B in the supplementary material), and found an increased frequency of `G2 and M' fusomes, in accordance with the known requirement for InR in GSC proliferation via G2 (Hsu et al., 2008). Similarly, TorW1251R GSCs in mosaics had an increased frequency of `G2 and M' fusomes relative to neighboring control GSCs (see Fig. S1C in the supplementary material), consistent with an intrinsic requirement for G2 progression. Despite the similar trend, however, the frequencies of `G2 and M' fusomes in TorW1251R and control GSCs in mosaics were both reduced relative to frequencies in whole Tor mutant and control females, respectively, suggesting either communication between GSCs in mosaics or background differences.
Both the insulin pathway and TOR are intrinsically required for normal GSC G2 progression. Thus, TOR regulation of G2 could be insulin-dependent or -independent (Fig. 1B). In InR mutants, removal of the downstream negative regulator foxo rescues the G2 delay (Hsu et al., 2008). We therefore reasoned that if TOR acts through insulin signaling to regulate G2, Tor foxo double mutants should reverse the Tor mutant G2 delay. Because TorW1251R/TorE161K; foxo21/foxo25 flies were inviable, we generated Tor mosaics in a foxo21/foxo25 background. Still, this genotype exhibited reduced adult viability, precluding GSC cell cycle analyses. Instead, we measured the ratio of Tor mutant to control GSC progeny in the foxo21/foxo25 background and found that loss of foxo does not rescue the reduced proportions observed in a wild-type background (Table 1; see Fig. 3A). As expected, loss of foxo rescues the low InR mutant to control GSC progeny ratio of InR mosaics (Table 1). Cyst death contributes to the low Tor cyst proportion ratio (see below); however, the fact that removal of foxo does not result in a partial cyst proportion rescue suggests that Tor controls GSC proliferation largely independently of the insulin pathway, although insulin signaling upstream of FOXO might provide a minor contribution to TOR activation.
TOR activity is required for GSC maintenance
Five- to seven-day-old TorW1251R/TorE161K females had fewer GSCs per germarium (1.8 ± 0.7, n=472) than controls (2.8 ± 0.7, n=557). To test if Tor is intrinsically required for GSC maintenance, we performed a relative GSC maintenance assay in Tor mosaics (Fig. 2). Control GSCs were lost slowly (Fig. 2A,D), as expected (Hsu and Drummond-Barbosa, 2009; Wang and Lin, 2005; Xie and Spradling, 1998). By contrast, TorP2293L and TorW1251R GSCs were lost significantly faster (Fig. 2B,D). No TUNEL-positive GSCs were detected in 226 germaria with a mosaic Tor germline, suggesting that Tor mutant GSCs are not lost by apoptosis. TOR activity is known to control autophagy (Chang et al., 2009), but inactivation of the autophagy pathway by an Atg7 mutation failed to rescue the Tor mutant GSC loss (see Table S1 in the supplementary material). Thus, the Tor GSC maintenance defect is probably caused by differentiation, although we cannot exclude the possibility that GSCs die by a distinct mechanism.
Fig. 2.
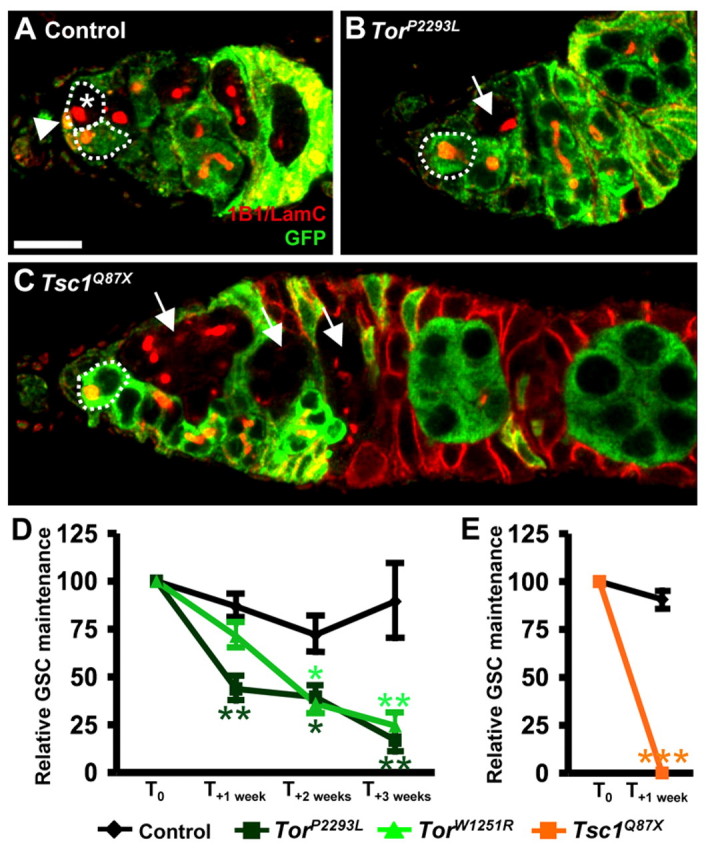
Normal TOR activity promotes GSC maintenance. (A-C) Control, TorP2293L and Tsc1Q87X mosaic germaria. GFP (green), control cells; 1B1 (red), fusomes and follicle cell membranes; LamC (red), cap cell nuclear membranes (arrowhead). GSCs are outlined. Asterisk, GFP-negative GSC; arrows, TorP2293L or Tsc1Q87X cysts derived from GSCs subsequently lost. (D,E) Quantification of relative GSC maintenance in control, TorP2293L, TorW1251R and Tsc1Q87X mosaic germaria. The fraction of mosaic germaria containing a GFP-negative GSC was arbitrarily set at 100% at time point T0 (4 days after clone induction) and data from one week (T+1 week), two weeks (T+2 weeks) or three weeks (T+3 weeks) later were normalized to T0. Error bars, s.e.m. *, P<0.01; **, P<0.005; ***, P<0.001. Scale bar: 10 μm.
Given the increased loss of Tor mutant GSCs, we reasoned that high TOR activity might promote GSC maintenance. We generated germline clones mutant for Tsc1, which encodes an upstream negative regulator of TOR (Tapon et al., 2001). Surprisingly, Tsc1Q87X GSCs exhibited an even greater loss rate than Tor mutant GSCs, such that within a week from the initial measurement, no Tsc1Q87X GSC remained in the niche (Fig. 2C,E). Optimal levels of TOR activity might therefore be required for proper GSC maintenance. Alternatively, TSC1 might be required for GSC maintenance independently of TOR.
TOR controls germline cyst proliferation and survival
As described above, Tor mutant GSCs produce markedly fewer progeny relative to control GSCs in mosaics (Fig. 3A; Table 1), partially owing to reduced proliferation (Fig. 1). Tor, however, can also regulate cell survival (Chang et al., 2009). Indeed, compared with control mosaics, Tor mosaics show increased frequency of TUNEL-positive cysts (Fig. 3B; Table 1), suggesting apoptosis of Tor mutant cysts.
To test whether Tor mutant cysts die at specific stages, we quantified the frequency of control and Tor mutant cystoblasts and 2-, 4-, 8- and 16-cell cysts (normalized per GSC). Stages were identified by fusome morphology, which becomes progressively more branched as cyst cell number increases (de Cuevas and Spradling, 1998). Although the frequencies of cystoblasts and 2-cell cysts per Tor mutant GSC were indistinguishable from those of controls, no TorP2293L 8- or 16-cell cysts were observed in mosaic germaria, and the TorW1251R allele yielded fewer 8-cell cysts and no 16-cell cysts at 10 days after clone induction (Fig. 3C). Thus, most Tor mutant cysts apparently die at the 8- and 16-cell stages. Occasionally, we observed follicles in which Tor mutant cysts with fewer than 16 cells were encapsulated with a neighboring wild-type 16-cell cyst, which might contribute to Tor mutant cyst reduction. Finally, the number of Tor mutant cystoblasts and 2-cell cysts was similar to controls despite reduced Tor mutant GSC proliferation rates, suggesting proportionately slowed Tor mutant cyst division.
TOR controls germline cyst growth
Although most Tor mutant cysts die early, a few of those cysts form a follicle. These are usually 16-cell cysts (or sometimes 8-cell cysts), and are more frequently observed at 6 rather than 10 days after clone induction. Tor mutant cysts grow at about 25% of the wild-type rate, suggesting a significant growth delay (Fig. 3D,E). In fact, follicles of TorP2293L cysts do not grow past the stage 2 size, whereas follicles of hypomorphic TorW1251R cysts reach the stage 3 or 4 size (Fig. 3E; Table 1). It is possible that these rare escaper follicles result from TOR protein perdurance in the initial progeny from a newly mutant GSC. In fact, Tor-null mutants can develop to larval stage 2 before death, presumably owing to perdurance of maternally derived TOR protein for about two to three days (Zhang et al., 2000). Conversely, Tsc1Q87X cysts have increased follicle growth rates (Fig. 3D,E; Table 1), consistent with the increased imaginal cell growth and proliferation observed upon TSC1/2 loss (Gao et al., 2002).
TOR control of cyst proliferation, growth, and survival is 4E-BP-independent
Many of the functions of Tor reflect its role in protein translation control via downstream targets 4E-BP (encoded by Thor in Drosophila) and S6 kinase (S6K) (Miron and Sonenberg, 2001; Teleman et al., 2008). 4E-BP is a conserved translational inhibitor that binds eIF4E, a cap-dependent translational activator, and 4E-BP phosphorylation by TOR releases eIF4E inhibition (Hay and Sonenberg, 2004). Accordingly, eIF4E overexpression leads to increased cell size in mammalian cells and Drosophila (Lachance et al., 2002; Lazaris-Karatzas et al., 1990). To test if reduced TOR activity affects cyst numbers and growth rates via 4E-BP-mediated translational inhibition, we analyzed TorW1251R Thor2 clones. Neither the proportion of TorW1251R Thor2 to control germline cysts nor the growth rates of TorW1251R Thor2 cysts were statistically different from TorW1251R mosaics (Fig. 3A,D; Table 1), indicating that Thor is dispensable for these effects. Instead, TOR might control translation in the germline primarily via S6K or MYC (Miron and Sonenberg, 2001; Teleman et al., 2008). In fact, mutation of S6K in mosaic ovarioles results in similar defects to those caused by Tor mutation (L.L. and D.D.-B., unpublished results), and MYC has been shown to act downstream of TOR (Teleman et al., 2008) and to control ovarian cell size (Maines et al., 2004).
TOR mediates the effects of insulin signaling on germline cyst growth but also receives additional inputs
Tor and the insulin pathway are required to control GSC proliferation and cyst growth (this study) (LaFever and Drummond-Barbosa, 2005; Hsu et al., 2008), and several studies showed that insulin signaling is among inputs integrated by TOR (Grewal, 2009; Hay and Sonenberg, 2004). Although the effects of insulin signaling on GSC division are mediated by foxo (Hsu et al., 2008), it is unknown whether foxo mutation suppresses the slow growth of InR mutant cysts, which could be potentially mediated via Tor and/or foxo. As expected, the low ratio of InRE19 to control GSC progeny (which reflects slower proliferation of InRE19 GSCs) is reversed by the foxo25 mutation, but not by the Tsc1Q87X mutation, in double-mutant mosaics (Table 1). The reverse occurs in cyst growth control. InRE19 cysts have markedly reduced growth rates (Table 1) (LaFever and Drummond-Barbosa, 2005), whereas InRE19 Tsc1Q87X cysts have higher growth rates than control cysts in mosaic ovarioles (Table 1). By contrast, InRE19 foxo25 cysts had cyst growth rates comparable with those of InRE19 cysts in mosaic ovarioles (Table 1). Thus, although the insulin pathway controls the proliferation of GSCs via foxo, it apparently controls the growth of their differentiating progeny via Tor. Nevertheless, null Tor mutant cysts have a more severe growth delay relative to null InR cysts (LaFever and Drummond-Barbosa, 2005), strongly suggesting that additional dietary factors besides insulin signaling modulate cyst growth via TOR.
TOR is necessary for FSC proliferation, but not maintenance
Tor is intrinsically required for GSC proliferation and maintenance; therefore, we wondered if Tor might similarly control FSCs as a mechanism to coordinate the response of both stem cell types to diet-dependent signals. To determine if Tor is required for FSC proliferation, we identified FSCs based on lineage tracing and measured S phase frequencies in control versus Tor mutant FSCs (Fig. 4A). Approximately half of control GFP-negative FSCs are BrdU-positive, whereas this frequency is drastically reduced for TorP2293L or TorW1251R FSCs (Fig. 4B), indicating that Tor is required for normal FSC proliferation.
Fig. 4.
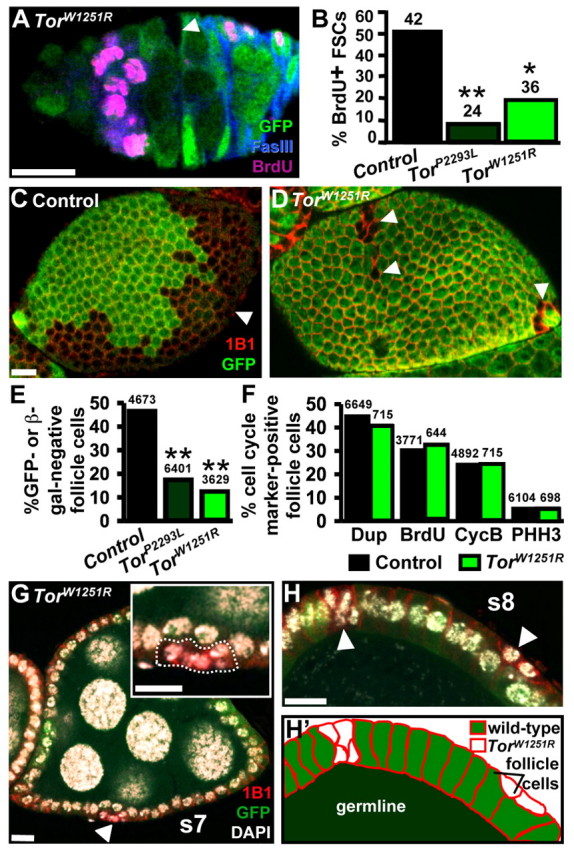
TOR controls FSC, but not follicle cell, proliferation. (A) GFP-negative TorW1251R FSC (arrowhead) in TorW1251R mosaic germarium. GFP (green) labels heterozygous cells. Fasciclin III (FASIII, blue) labels all but immediate FSC daughters. BrdU (pink, due to mouse and rat secondary antibody cross-reaction) marks cells in S. (B) BrdU-positive control, TorP2293L or TorW1251R FSC frequencies in mosaics. (C,D) Control and TorW1251R mosaic follicle cell monolayers 10 days after clone induction. 1B1 (red), follicle cell membranes; arrowheads, GFP-negative follicle cell clones. (E) Percentage of GFP- or β-gal-negative follicle cells relative to total follicle cell number. (F) Percentage of GFP- or β-gal-negative follicle cells positive for DUP (G1 and S), BrdU (S), CycB (G2 and M) or PHH3 (M) relative to total marker-negative follicle cell number in follicles at stages 2-6. (G) Stage-7 follicle containing TorW1251R follicle cells (arrowhead; outlined in inset) that lost contact with the underlying germline. DAPI (white) labels DNA. (H,H′) Posterior region of a stage-8 follicle containing TorW1251R follicle cell clones and outlined in H′ (arrowheads). Numbers above bars indicate the total number of GFP-negative FSCs (B) or marker-negative follicle cells (E,F) analyzed. *, P<0.003; **, P<0.001. Scale bars: 10 μm.
To determine if Tor activity controls FSC maintenance, we performed an FSC maintenance assay in mosaic ovarioles analyzed at different times after clone induction (see Materials and methods). Although there was considerable experimental variability (see Table S2 in the supplementary material), Tor and Tsc1 do not appear to play a major role in FSC maintenance.
TOR does not affect follicle cell proliferation
Given that Tor controls FSC division, we asked whether Tor also regulates proliferation of their progeny. First, we compared Tor mutant to control follicle cell numbers in mosaic ovarioles (Fig. 4C-E). In control mosaics containing wild-type GFP-positive and GFP-negative FSCs, approximately equal numbers of follicle cells derived from each FSC result in a one-to-one ratio of progeny (Fig. 4C,E) (see also Margolis and Spradling, 1995). By contrast, Tor mosaics have a significantly reduced ratio of TorP2293L or TorW1251R to control follicle cells (Fig. 4D,E). Similar results were observed for InRE19 or InRE19 foxo25 follicle cells (L.L. and D.D.-B., unpublished results), suggesting that insulin signaling controls follicle cell numbers independently of foxo. Although we had concluded that InR is not required cell autonomously in follicle cells (LaFever and Drummond-Barbosa, 2005), retrospective analyses revealed our previous misinterpretation due to weak GFP staining (heterozygous InR follicle cells with one copy of GFP mistaken for GFP-negative InR mutant follicle cells). These data suggest that Tor controls follicle cell survival and/or proliferation, given that the reduced Tor mutant FSC proliferation cannot account for the dramatic reduction in Tor mutant follicle cell number (Nystul and Spradling, 2009).
To directly test if Tor mutant follicle cells have reduced proliferation, we analyzed TorW1251R follicle cells using Cyclin B (G2 and M), BrdU (S), PHH3 (M) and Double parked (DUP, late G1 and S) (Thomer et al., 2004; Whittaker et al., 2000). Surprisingly, the frequencies of cells positive for these cell cycle markers were indistinguishable between control and Tor mutant follicle cells (Fig. 4F), indicating that Tor does not modulate follicle cell proliferation, unlike for FSCs. Thus, Tor controls follicle cell numbers by modulating their survival.
TOR promotes follicle cell survival independently of suppression of apoptotic or autophagic cell death
Tor modulates apoptosis and autophagy in many systems (Chang et al., 2009; Diaz-Troya et al., 2008). We therefore examined apoptosis incidence in control versus Tor mutant follicle cells in mosaics using TUNEL labeling and activated Caspase-3 antibody staining. Negligible numbers of either TUNEL-positive or activated Caspase-3-positive follicle cells were observed in both control or TorW1251R mosaics (9-41 mosaic ovarioles analyzed for each genotype and condition), suggesting that Tor mutant follicle cells are not eliminated by apoptosis.
If Tor mutant follicle cell number reduction is a result of autophagic death, then blocking autophagy in Tor mosaics should increase Tor mutant follicle cell numbers to wild-type levels. Null mutations in Atg7 result in an 85-95% reduction in autophagy at the ultrastructural level, but homozygous females are still viable and fertile (Juhasz et al., 2007; Juhasz and Neufeld, 2008). We therefore analyzed TorW1251R mosaic follicle cells in Atg7d4 homozygotes. Well-fed Atg7d4 females exhibited vitellogenic follicle degeneration and stage-14 oocyte accumulation, which normally occur under starvation and are consistent with impaired autophagy-dependent nutrient mobilization from the fat body (a storage tissue) (Drummond-Barbosa and Spradling, 2001; Grewal and Saucedo, 2004; Hou et al., 2008). Furthermore, degenerating follicles accumulate, in agreement with autophagy being required for clearance of dying follicles (Pritchett et al., 2009). Despite these clear indications that autophagy is disrupted in Atg7d4 females, the ratio of TorP2293L or TorW1251R to control follicle cells remained unchanged in the Atg7d4 background (see Table S1 in the supplementary material), suggesting that reduction in Tor mutant follicle cell numbers does not require autophagic death.
Alternative mechanisms might explain the reduced survival of Tor mutant follicle cells. When the entire follicle cell monolayer is homozygous for TorW1251R, follicle development is supported through stage 9 (see Fig. S2 in the supplementary material), suggesting that surrounding wild-type cells might contribute to the reduced Tor mutant follicle cell numbers. Intriguingly, Tor mutant follicle cells surrounded by wild-type follicle cells often appeared to be undergoing extrusion from the mosaic follicle cell layer. Approximately 65% of mosaic ovarioles containing Tor mutant follicle cells (15/22 for TorP2293L mosaics and 14/22 for TorW1251R mosaics) displayed at least one mutant cell above or below the wild-type monolayer, which was never observed in control mosaics (Fig. 4G,H). As described above, extruded Tor mutant follicle cells were negative for activated Caspase-3. These results suggest that wild-type neighbors eliminate Tor mutant follicle cells without apparent apoptosis.
TOR regulates follicle cell size and timely exit from the follicle cell mitotic program
We also examined whether Tor controls follicle cell size. Follicle cells undergo mitotic cell divisions until stage 6, then transition to an endoreplicative program and greatly increase in size (Royzman and Orr-Weaver, 1998). During mitotic stages, TorP2293L or TorW1251R follicle cells are significantly smaller than neighboring control cells, whereas in endoreplicative stages, this difference is more pronounced (Fig. 5), demonstrating that Tor controls not only follicle cell number, but also size.
Fig. 5.
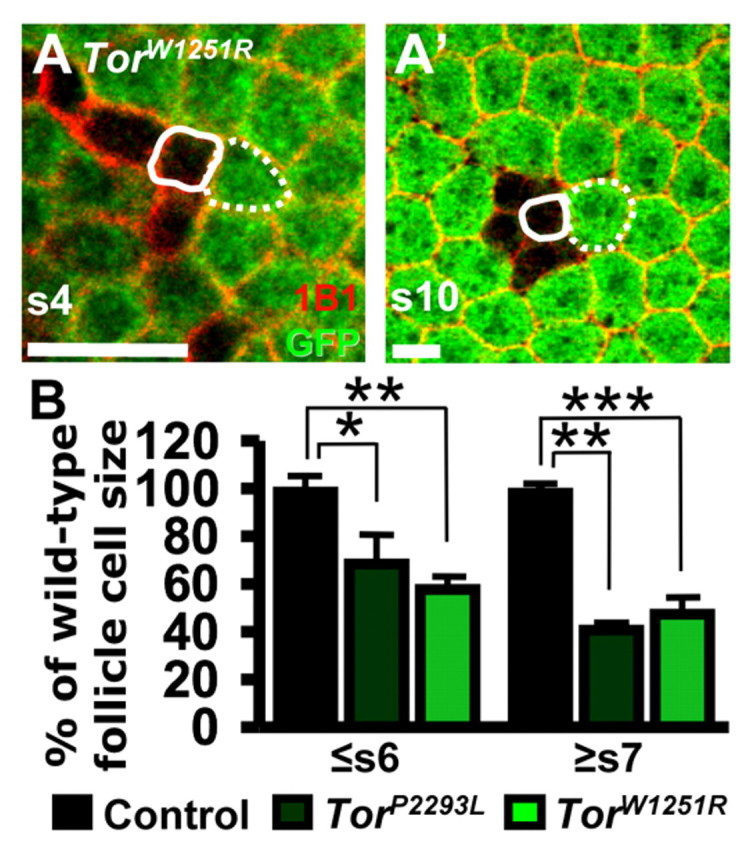
TOR controls follicle cell growth. (A,A′) TorW1251R follicle cells in stage-4 (s4) and stage-10 (s10) mosaic follicles. GFP (green), control cells; 1B1 (red), cell membranes. Solid and dotted outlines indicate a TorW1251R or control follicle cell, respectively. (B) GFP-negative TorP2293L or TorW1251R follicle cell size as a percentage of GFP-positive neighboring control follicle cell size in stages 6 and younger (≤s6) or stages 7 and older (≥s7). Error bars, s.d. *, P<0.01; **, P<0.002; ***, P<0.0001. Scale bars: 10 μm.
The more pronounced difference in Tor mutant follicle cell size in endoreplicative stages led us to hypothesize that Tor might control the mitosis-to-endoreplication transition. Mitotic follicle cells go through G1, S, G2 and M, whereas endoreplicating follicle cells alternate between G1 and S (Lee and Orr-Weaver, 2003; Wu et al., 2008). To directly determine whether Tor mutant follicle cells continue to divide mitotically beyond stage 6, we examined the PHH3 (M) and CycB (G2 and M) markers in Tor mutant follicle cells (Fig. 6A-C). We analyzed BrdU-incorporation as a control (S phase present in both programs) and no significant difference was observed between control and TorW1251R follicle cells (Fig. 6C). As expected, neighboring control follicle cells at stages 7 and 8 were all negative for PHH3 and CycB (Fig. 6A-C), unlike earlier mitotic follicle cells (see Fig. 4F). By contrast, some of the TorW1251R follicle cells at stages 7 and 8 were positive for PHH3 (4.4%) and CycB (26%; Fig. 6A-C), suggesting that TorW1251R follicle cells divide mitotically past stage 6.
Fig. 6.
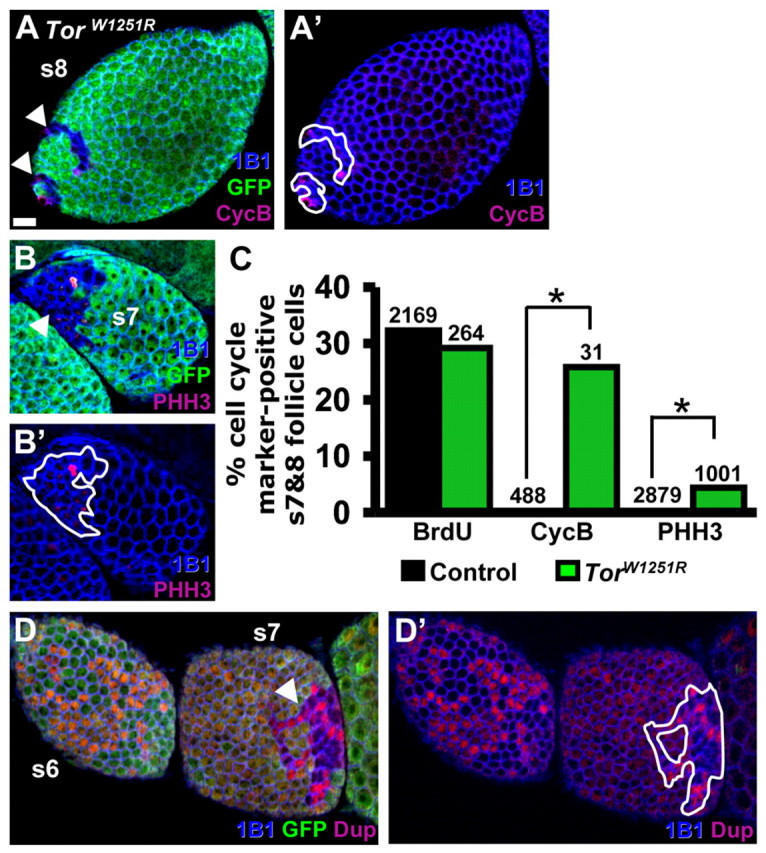
Tor promotes timely follicle cell mitosis-to-endoreplication transition. (A-B′) TorW1251R follicle cells in stage 7 and 8 mosaic follicles. GFP (green), control cells; 1B1 (blue), cell membranes; CycB (red), G2 or M; PHH3 (red), M. TorW1251R follicle cell clones are indicated by arrowheads (A,B) and outlined A′ and B′. (C) Frequencies of BrdU-, CycB- or PHH3-positive TorW1251R follicle cells and neighboring control cells in stages 7 and 8. The total number of control or TorW1251R follicle cells analyzed is indicated above the bars. (D,D′) Double parked (DUP, red) expression in stage 6 and 7 TorW1251R mosaic follicles. The TorW1251R follicle cell clone is indicated by an arrowhead (D) and outlined (D′). *, P<0.0001. Scale bar: 10 μm.
The occurrence of PHH3- and CycB-positive TorW1251R follicle cells at stages 7 and 8 could reflect a consistent defect of TorW1251R follicle cell mitotic exit, or a defect in a subset of TorW1251R follicle cells. We therefore analyzed expression of DUP, a conserved pre-replicative complex component (Thomer et al., 2004; Whittaker et al., 2000), in mosaic follicle cell layers. Dup has a robust and dynamic G1 and S pattern in mitotic follicle cells but becomes more diffuse during endoreplication, when it is confined to G1 (Thomer et al., 2004). TorW1251R follicle cells in stages 7 and later exhibit the dynamic DUP pattern characteristic of a mitotic cell cycle in contrast to the diffuse pattern of neighboring control follicle cells (Fig. 6D,D′), suggesting that all TorW1251R follicle cells have a defect in endoreplication entry. We could not determine if TorW1251R follicle cells eventually endoreplicate owing to prohibitively low frequencies of Tor mutant follicle cell clones beyond stage 8. Thus, reduced Tor activity leads to either a delay or a block in the mitosis to endoreplication switch.
Follicle cell TOR activity influences underlying cyst growth and vitellogenesis
Germline cyst growth and surrounding follicle cell proliferation are coordinated (LaFever and Drummond-Barbosa, 2005; Maines et al., 2004; Wang and Riechmann, 2007). As Tor intrinsically controls follicle cell number, we asked whether Tor mutant follicle cells influence underlying wild-type cyst growth. If TorP2293L or TorW1251R follicle cells cover at least one-third of a wild-type cyst, there is a significant growth delay, evident by larger wild-type follicles positioned anteriorly (Fig. 7A-C; see Table S3 in the supplementary material). Conversely, wild-type cysts surrounded by Tsc1Q87X follicle cells have accelerated growth (Fig. 7D; see Table S3 in the supplementary material). These results indicate that, although Tor does not control follicle cell proliferation, follicle cell TOR activity affects growth of the underlying germline, presumably via effects on follicle cell number and/or growth.
Fig. 7.
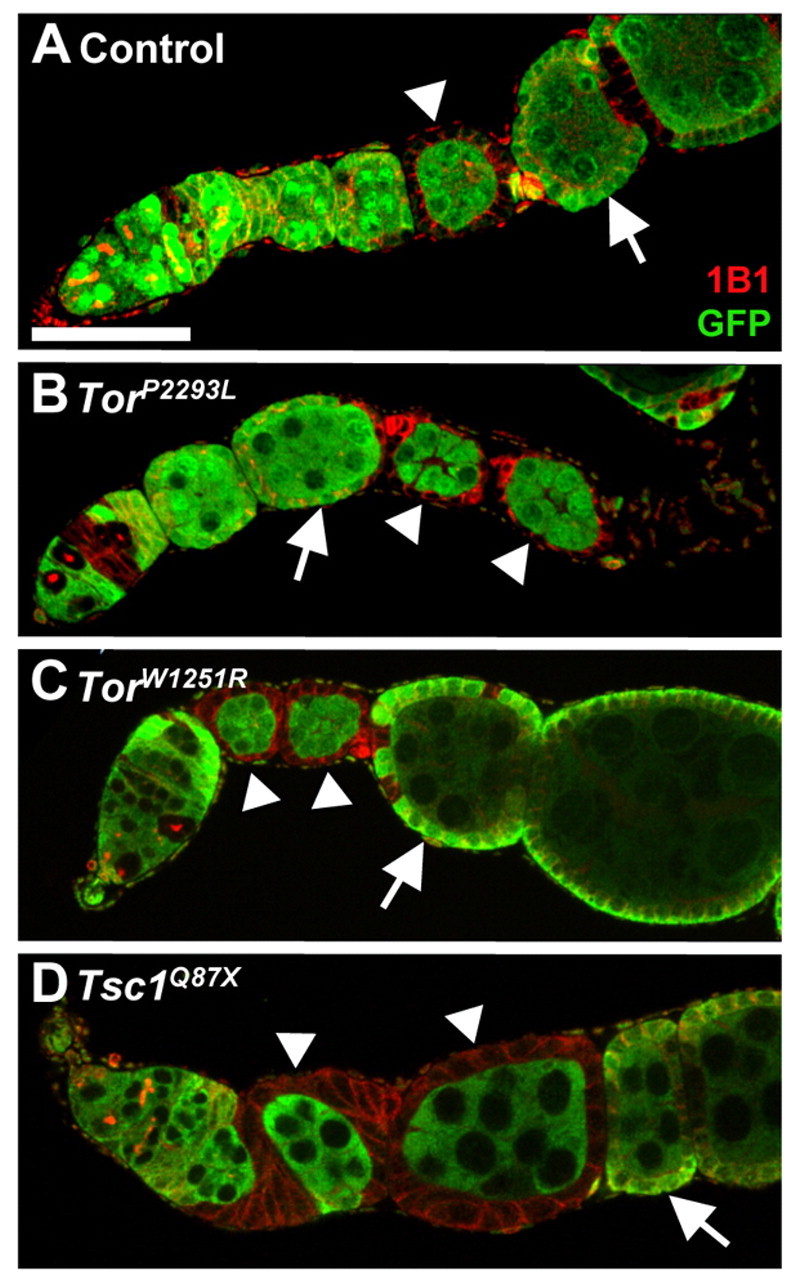
Follicle cell TOR activity influences germline growth. (A-D) Wild-type germline cysts completely surrounded by control, TorP2293L, TorW1251R and Tsc1Q87X GFP-negative follicle cells (arrowheads). Arrows, neighboring control follicles; GFP (green), heterozygous cells; 1B1 (red), follicle cell membranes. Scale bar: 50 μm.
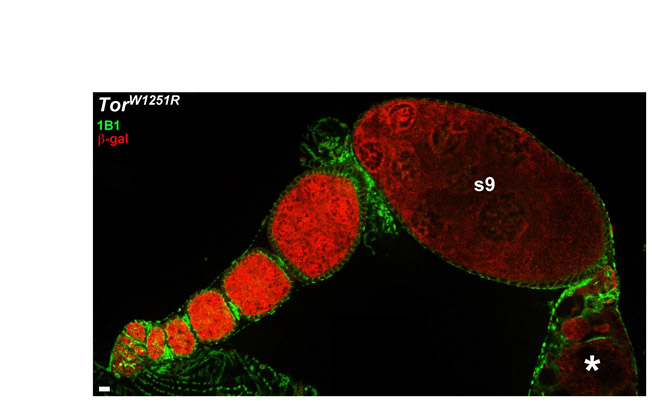
Follicle cell Tor activity also influences vitellogenesis progression of underlying oocytes. We rarely found mosaic ovarioles with a fully Tor mutant follicle cell monolayer and wild-type germline. Vitellogenesis was supported in only 2 out of 12 examples of such ovarioles containing TorW1251R follicle cells, which could reach a small stage-10 follicle before degenerating (see Fig. S2 in the supplementary material). For TorP2293L follicle cells, no vitellogenic follicles were observed in 14 ovarioles examined. These data suggest that follicle cells communicate with germ cells downstream of TOR to regulate vitellogenesis. Among plausible mechanisms would be an effect of Tor on the production of yolk proteins by follicle cells (Hansen et al., 2004; Hansen et al., 2005) or a more indirect effect involving the coordination between follicle cell number and germ cell development.
DISCUSSION
Stem cells support multiple adult tissues, and they also respond to external and physiological inputs (Drummond-Barbosa, 2008). Our recent studies uncovered dietary effects on Drosophila ovarian stem cells (Drummond-Barbosa and Spradling, 2001; Hsu and Drummond-Barbosa, 2009; Hsu et al., 2008; LaFever and Drummond-Barbosa, 2005). Insulin signals control GSCs, their niche and differentiating progeny; however, additional dietary mediators remain obscure. Here, we reveal strikingly specific effects of Tor on GSCs, FSCs and their progeny. Coupled to studies showing the conserved role of TOR as a nutrient sensor (Wang and Proud, 2009), these results address how specific effects of a nutrient-responsive factor might contribute to the coordination between different stem cell populations and their descendents.
G2 is a major point of GSC proliferation control by diet-dependent pathways
Both insulin signals and TOR are nutrient-sensing factors (Wang and Proud, 2009) that converge on G2 to regulate Drosophila GSC proliferation (Hsu et al., 2008) (this study). G2 regulation in response to diet/insulin signals also occurs in Drosophila male GSCs and in Caenorhabditis elegans germline precursors (Narbonne and Roy, 2006; Ueishi et al., 2009). Starvation promotes deleterious mutations during Saccharomyces cerevisae division (Marini et al., 1999), and cancer cells form repair foci during a delayed G2 upon DNA damage (Kao et al., 2001). The multitude of GSC G2 regulators might reflect a mechanism to ensure genomic integrity under poor dietary conditions.
Although TOR regulates the G1–S transition, it also modulates G2–M in S. cerevisae, Schizosaccharomyces pombe and mammalian cells (Wang and Proud, 2009). Combined with the Tor role in GSC G2, the increased phosphorylation of 4E-BP specifically during M suggests that a TOR activity increase might precede the G2–M transition. Interestingly, activated TOR is highly enriched at the mitotic spindles of rat ovarian granulosa cells and TOR inhibition by rapamycin impairs their proliferation (Yaba et al., 2008). Marked increases in S6K activity and 4E-BP1 phosphorylation in M occur in HeLa cells (Boyer et al., 2008; Heesom et al., 2001), further suggesting TOR activity cell cycle regulation as part of a conserved mechanism to tie G2–M to nutrient availability.
Specific effects of TOR on stem cell populations
Although both GSCs and FSCs require Tor for normal proliferation, only GSC maintenance requires optimal TOR activity. These distinctions do not reflect a fundamental difference between germline and somatic stem cells because TOR appears to control the maintenance of several, although probably not all, mammalian somatic stem cell types. In hematopoietic stem cells, Tsc1 or PTEN loss results in increased TOR signaling and short-term expansion, but also progressive stem cell depletion (Gan et al., 2008; Yilmaz et al., 2006). TOR activation downstream of Wnt1 overexpression leads to transiently increased hair follicle proliferation followed by stem cell loss (Castilho et al., 2009). By contrast, PTEN mutant ovarian granulosa cells do not become depleted (Fan et al., 2008), despite elevated TOR activity (Adhikari et al., 2010). Because granulosa cells might derive from stem cells (Lavranos et al., 1999), it is tempting to speculate that maintenance of these stem cells might not require precise TOR regulation, similar to Drosophila FSCs.
TOR differentially regulates stem cells and their progeny
Ovarian stem cells and their progeny respond to TOR differently. Reduced Tor activity leads to apoptosis of 8- and 16-cell cysts, but Tor mutant GSCs do not appear to undergo apoptotic or autophagic death. The niche might conceivably prevent GSC death. Indeed, we find no reports of GSC cell death within their in vivo niche. Consistent with the niche promoting GSC survival, GSCs die at higher rates when separated from somatic cells in culture (Niki, 2009). Laser ablation of the single apical niche cell causes death of Locusta migratoria male GSCs (Zahn et al., 2007). This model, however, does not account for a normal number of Tor mutant cystoblasts and 2-cell cysts. Perhaps a combination of niche displacement and growth defects leads to Tor mutant 8- and 16-cell cyst death.
Reduced Tor activity slows FSC proliferation, but has no effect on the cell cycle of follicle cells. This striking difference suggests that follicle cell proliferation might be largely insensitive to direct effects of diet. Follicle cells might instead receive their primary cue to divide from the underlying germline, perhaps via the actomyosin cytoskeleton, as recently suggested (Wang and Riechmann, 2007). Consistent with this idea, when germline cyst growth is slowed down by InR or Myc mutation, surrounding wild-type follicle cells adjust their numbers accordingly (LaFever and Drummond-Barbosa, 2005; Maines et al., 2004), although it remains to be determined if this reflects changes in follicle cell proliferation per se.
Tor mutant follicle cells are extruded in a competitive environment
Cell competition can occur when cell populations with different growth capacities coexist. It has been proposed that a cell senses the translational capacity of their neighbors and thus distinguishes `winner' versus `loser' cells. The `losers' undergo apoptosis and secrete factors that stimulate `winner' proliferation (Johnston, 2009). Although Tor regulates growth and translation (Wang and Proud, 2009), Tor mutant follicle cells do not exhibit apoptosis, but are instead extruded from mosaic monolayers. Apoptosis-independent extrusion of cells with compromised Decapentaplegic (DPP, a bone morphogenetic protein family member) signaling has been reported in mosaic Drosophila wing disc epithelia (Shen and Dahmann, 2005; Gibson and Perrimon, 2005). This similarity suggests a possible connection between DPP signaling and TOR.
Insulin-dependent and independent roles of TOR in cell growth and proliferation
TOR can be activated downstream of insulin signaling but also receives additional inputs (Grewal, 2009). Insulin signaling controls germline growth via TOR, whereas insulin (via FOXO) and TOR signaling regulate GSC proliferation in parallel. Tor-null ovarian cell defects are also more severe than InR-null defects (see also LaFever and Drummond-Barbosa, 2005), implying that TOR receives additional inputs during oogenesis.
Amino acid transport activates TOR signaling in Drosophila and mammals (Avruch et al., 2009; Hietakangas and Cohen, 2009). The Drosophila genome predicts approximately 40 amino acid transporters (http://flybase.org) and recent evidence suggests that methionine is a key dietary amino acid for oogenesis in Drosophila (Grandison et al., 2009). Further studies should investigate how various classes of amino acid transporters affect ovarian TOR signaling and amino acid requirements for specific oogenesis processes.
4E-BP and translational control downstream of TOR
4E-BP, encoded by Thor, represses cap-dependent translation via eIF4E inhibition. TOR phosphorylates and inhibits 4E-BP, leading to translation de-repression (Fingar et al., 2002). 4E-BP, however, does not mediate Tor ovarian phenotypes, suggesting that TOR probably acts through S6K or MYC (Grewal, 2009; Hay and Sonenberg, 2004; Li et al. 2010). Indeed, S6K overexpression partially restores Tor mutant growth, viability and fertility (Zhang et al., 2000), whereas MYC loss causes germline growth phenotypes similar to Tor defects (Maines et al., 2004).
Whether or not 4E-BP is required in any other tissues to mediate the effects of reduced TOR activity remains unclear. Although overexpression of eIF4E increases cell growth rates and overexpression of 4E-BP results in smaller cell size, loss of 4E-BP does not phenocopy eIF4E overexpression (Fingar et al., 2002; Teleman et al., 2005). Furthermore, Thor mutation has no obvious phenotype in Drosophila except for increased sensitivity to stress and impaired innate immunity (Bernal and Kimbrell, 2000; Teleman et al., 2005). Although Thor is required for dietary restriction effects on lifespan (Zid et al., 2009), we found no reports of Tor Thor double mutants in the literature.
Parallels between the role of TOR in Drosophila and mammalian ovaries
Our results bring to light interesting parallels between the role of TOR in Drosophila and mammalian ovaries. Insulin and TOR signaling are active in mammalian ovaries (Adhikari et al., 2010; Yaba et al., 2008) and rapamycin inhibits follicle growth in cultured mouse ovaries (Yaba, 2008), suggesting similar regulation of oocyte growth and follicle cell numbers between Drosophila and mammals. Although adult mammalian ovaries do not contain GSCs, overexpression of either insulin or TOR signaling in mouse primordial germ cells leads to premature ovarian failure caused by the hyperactivation and subsequent depletion of the primordial germ cell pool (Adhikari et al., 2010; Reddy et al., 2008), a phenotype that is arguably reminiscent of the rapid loss of Tsc1 mutant GSCs.
Supplementary Material
Acknowledgments
L.L., A.F., H.-J.H. and D.D.-B. designed and interpreted the experiments. L.L. and D.D.-B. wrote the paper. L.L., A.F. and H.-J.H. performed the experiments: L.L. contributed to all figures and tables; A.F. contributed to Figs 3, 4, 5 and 7, and Tables S1 and S3 in the supplementary material; H.-J.H. contributed to Fig. S1 in the supplementary material. We thank J. Von Stetina for her initial observations. We are grateful to E. Ables and M.-Y. Kim for valuable comments on this manuscript. We thank T. Neufeld, T. Orr-Weaver, J. Bateman, I. Hariharan, E. Matunis, Flybase, Cell Signaling Technology (anti-p4E-BP sample) and the Bloomington and Kyoto Stock Centers for stocks and reagents. This work was supported by National Institutes of Health R01 GM069875 and American Cancer Society RSG-DDC-112316, and training grants T32 HD007502 and T32HD007043 (support for L.L.). Deposited in PMC for release after 12 months.
Competing interests statement
The authors declare no competing financial interests.
Supplementary material
Supplementary material for this article is available at http://dev.biologists.org/lookup/suppl/doi:10.1242/dev.050351/-/DC1
References
- Adhikari D., Zheng W., Shen Y., Gorre N., Hamalainen T., Cooney A. J., Huhtaniemi I., Lan Z. J., Liu K. (2010). Tsc/mTORC1 signaling in oocytes governs the quiescence and activation of primordial follicles. Hum. Mol. Genet. 19, 397-410 [DOI] [PMC free article] [PubMed] [Google Scholar]
- Amcheslavsky A., Jiang J., Ip Y. T. (2009). Tissue damage-induced intestinal stem cell division in Drosophila. Cell Stem Cell 4, 49-61 [DOI] [PMC free article] [PubMed] [Google Scholar]
- Ashburner M., Drysdale R. (1994). FlyBase-the Drosophila genetic database. Development 120, 2077-2079 [DOI] [PubMed] [Google Scholar]
- Avruch J., Long X., Ortiz-Vega S., Rapley J., Papageorgiou A., Dai N. (2009). Amino acid regulation of TOR complex 1. Am. J. Physiol. Endocrinol. Metab. 296, E592-E602 [DOI] [PMC free article] [PubMed] [Google Scholar]
- Bernal A., Kimbrell D. A. (2000). Drosophila Thor participates in host immune defense and connects a translational regulator with innate immunity. Proc. Natl. Acad. Sci. USA 97, 6019-6024 [DOI] [PMC free article] [PubMed] [Google Scholar]
- Boyer D., Quintanilla R., Lee-Fruman K. K. (2008). Regulation of catalytic activity of S6 kinase 2 during cell cycle. Mol. Cell. Biochem. 307, 59-64 [DOI] [PMC free article] [PubMed] [Google Scholar]
- Castilho R. M., Squarize C. H., Chodosh L. A., Williams B. O., Gutkind J. S. (2009). mTOR mediates Wnt-induced epidermal stem cell exhaustion and aging. Cell Stem Cell 5, 279-289 [DOI] [PMC free article] [PubMed] [Google Scholar]
- Chang Y. Y., Juhasz G., Goraksha-Hicks P., Arsham A. M., Mallin D. R., Muller L. K., Neufeld T. P. (2009). Nutrient-dependent regulation of autophagy through the target of rapamycin pathway. Biochem. Soc. Trans. 37, 232-236 [DOI] [PubMed] [Google Scholar]
- de Cuevas M., Spradling A. C. (1998). Morphogenesis of the Drosophila fusome and its implications for oocyte specification. Development 125, 2781-2789 [DOI] [PubMed] [Google Scholar]
- Diaz-Troya S., Perez-Perez M. E., Florencio F. J., Crespo J. L. (2008). The role of TOR in autophagy regulation from yeast to plants and mammals. Autophagy 4, 851-865 [DOI] [PubMed] [Google Scholar]
- Drummond-Barbosa D. (2008). Stem cells, their niches and the systemic environment: an aging network. Genetics 180, 1787-1797 [DOI] [PMC free article] [PubMed] [Google Scholar]
- Drummond-Barbosa D., Spradling A. C. (2001). Stem cells and their progeny respond to nutritional changes during Drosophila oogenesis. Dev. Biol. 231, 265-278 [DOI] [PubMed] [Google Scholar]
- Fan H. Y., Liu Z., Cahill N., Richards J. S. (2008). Targeted disruption of Pten in ovarian granulosa cells enhances ovulation and extends the life span of luteal cells. Mol. Endocrinol. 22, 2128-2140 [DOI] [PMC free article] [PubMed] [Google Scholar]
- Fingar D. C., Salama S., Tsou C., Harlow E., Blenis J. (2002). Mammalian cell size is controlled by mTOR and its downstream targets S6K1 and 4EBP1/eIF4E. Genes Dev. 16, 1472-1487 [DOI] [PMC free article] [PubMed] [Google Scholar]
- Gan B., Sahin E., Jiang S., Sanchez-Aguilera A., Scott K. L., Chin L., Williams D. A., Kwiatkowski D. J., DePinho R. A. (2008). mTORC1-dependent and -independent regulation of stem cell renewal, differentiation, and mobilization. Proc. Natl. Acad. Sci. USA 105, 19384-19389 [DOI] [PMC free article] [PubMed] [Google Scholar]
- Gao X., Zhang Y., Arrazola P., Hino O., Kobayashi T., Yeung R. S., Ru B., Pan D. (2002). Tsc tumour suppressor proteins antagonize amino-acid-TOR signalling. Nat. Cell. Biol. 4, 699-704 [DOI] [PubMed] [Google Scholar]
- Grandison R. C., Piper M. D., Partridge L. (2009). Amino-acid imbalance explains extension of lifespan by dietary restriction in Drosophila. Nature 462, 1061-1064 [DOI] [PMC free article] [PubMed] [Google Scholar]
- Grewal S. S. (2009). Insulin/TOR signaling in growth and homeostasis: a view from the fly world. Int. J. Biochem. Cell Biol. 41, 1006-1010 [DOI] [PubMed] [Google Scholar]
- Grewal S. S., Saucedo L. J. (2004). Chewing the fat; regulating autophagy in Drosophila. Dev. Cell 7, 148-150 [DOI] [PubMed] [Google Scholar]
- Hansen I. A., Attardo G. M., Park J. H., Peng Q., Raikhel A. S. (2004). Target of rapamycin-mediated amino acid signaling in mosquito anautogeny. Proc. Natl. Acad. Sci. USA 101, 10626-10631 [DOI] [PMC free article] [PubMed] [Google Scholar]
- Hansen I. A., Attardo G. M., Roy S. G., Raikhel A. S. (2005). Target of rapamycin-dependent activation of S6 kinase is a central step in the transduction of nutritional signals during egg development in a mosquito. J. Biol. Chem. 280, 20565-20572 [DOI] [PubMed] [Google Scholar]
- Hay N., Sonenberg N. (2004). Upstream and downstream of mTOR. Genes Dev. 18, 1926-1945 [DOI] [PubMed] [Google Scholar]
- Heesom K. J., Gampel A., Mellor H., Denton R. M. (2001). Cell cycle-dependent phosphorylation of the translational repressor eIF-4E binding protein-1 (4E-BP1). Curr. Biol. 11, 1374-1379 [DOI] [PubMed] [Google Scholar]
- Hietakangas V., Cohen S. M. (2009). Regulation of tissue growth through nutrient sensing. Annu. Rev. Genet. 43, 389-410 [DOI] [PubMed] [Google Scholar]
- Hinge A., Bajaj M., Limaye L., Surolia A., Kale V. P. (2009). Oral administration of insulin receptor-interacting lectins leads to an enhancement in the hematopoietic stem and progenitor cell pool of mice. Stem Cells Dev. 19, 163-174 [DOI] [PubMed] [Google Scholar]
- Hou Y. C., Chittaranjan S., Barbosa S. G., McCall K., Gorski S. M. (2008). Effector caspase Dcp-1 and IAP protein Bruce regulate starvation-induced autophagy during Drosophila melanogaster oogenesis. J. Cell Biol. 182, 1127-1139 [DOI] [PMC free article] [PubMed] [Google Scholar]
- Hsu H. J., Drummond-Barbosa D. (2009). Insulin levels control female germline stem cell maintenance via the niche in Drosophila. Proc. Natl. Acad. Sci. USA 106, 1117-1121 [DOI] [PMC free article] [PubMed] [Google Scholar]
- Hsu H. J., LaFever L., Drummond-Barbosa D. (2008). Diet controls normal and tumorous germline stem cells via insulin-dependent and -independent mechanisms in Drosophila. Dev. Biol. 313, 700-712 [DOI] [PMC free article] [PubMed] [Google Scholar]
- Johnston L. A. (2009). Competitive interactions between cells: death, growth, and geography. Science 324, 1679-1682 [DOI] [PMC free article] [PubMed] [Google Scholar]
- Juhasz G., Neufeld T. P. (2008). Drosophila Atg7: required for stress resistance, longevity and neuronal homeostasis, but not for metamorphosis. Autophagy 4, 357-358 [DOI] [PubMed] [Google Scholar]
- Juhasz G., Erdi B., Sass M., Neufeld T. P. (2007). Atg7-dependent autophagy promotes neuronal health, stress tolerance, and longevity but is dispensable for metamorphosis in Drosophila. Genes Dev. 21, 3061-3066 [DOI] [PMC free article] [PubMed] [Google Scholar]
- Kao G. D., McKenna W. G., Yen T. J. (2001). Detection of repair activity during the DNA damage-induced G2 delay in human cancer cells. Oncogene 20, 3486-3496 [DOI] [PubMed] [Google Scholar]
- Kim M. H., Kim M. O., Kim Y. H., Kim J. S., Han H. J. (2009). Linoleic acid induces mouse embryonic stem cell proliferation via Ca2+/PKC, PI3K/Akt, and MAPKs. Cell Physiol. Biochem. 23, 53-64 [DOI] [PubMed] [Google Scholar]
- Lachance P. E., Miron M., Raught B., Sonenberg N., Lasko P. (2002). Phosphorylation of eukaryotic translation initiation factor 4E is critical for growth. Mol. Cell. Biol. 22, 1656-1663 [DOI] [PMC free article] [PubMed] [Google Scholar]
- LaFever L., Drummond-Barbosa D. (2005). Direct control of germline stem cell division and cyst growth by neural insulin in Drosophila. Science 309, 1071-1073 [DOI] [PubMed] [Google Scholar]
- LaMarca H. L., Rosen J. M. (2008). Minireview: hormones and mammary cell fate-what will I become when I grow up? Endocrinology 149, 4317-4321 [DOI] [PMC free article] [PubMed] [Google Scholar]
- Lazaris-Karatzas A., Montine K. S., Sonenberg N. (1990). Malignant transformation by a eukaryotic initiation factor subunit that binds to mRNA 5′ cap. Nature 345, 544-547 [DOI] [PubMed] [Google Scholar]
- Lee L. A., Orr-Weaver T. L. (2003). Regulation of cell cycles in Drosophila development: intrinsic and extrinsic cues. Annu. Rev. Genet. 37, 545-578 [DOI] [PubMed] [Google Scholar]
- Li L., Xie T. (2005). Stem cell niche: structure and function. Annu. Rev. Cell Dev. Biol. 21, 605-631 [DOI] [PubMed] [Google Scholar]
- Li L., Edgar B. A., Grewal S. S. (2010). Nutritional control of gene expression in Drosophila larvae via TOR, Myc and a novel cis-regulatory element. BMC Cell Biol. 11, 7 [DOI] [PMC free article] [PubMed] [Google Scholar]
- Lilly M. A., Spradling A. C. (1996). The Drosophila endocycle is controlled by Cyclin E and lacks a checkpoint ensuring S-phase completion. Genes Dev. 10, 2514-2526 [DOI] [PubMed] [Google Scholar]
- Maines J. Z., Stevens L. M., Tong X., Stein D. (2004). Drosophila dMyc is required for ovary cell growth and endoreplication. Development 131, 775-786 [DOI] [PubMed] [Google Scholar]
- Margolis J., Spradling A. (1995). Identification and behavior of epithelial stem cells in the Drosophila ovary. Development 121, 3797-3807 [DOI] [PubMed] [Google Scholar]
- Marini A., Matmati N., Morpurgo G. (1999). Starvation in yeast increases non-adaptive mutation. Curr. Genet. 35, 77-81 [DOI] [PubMed] [Google Scholar]
- Miron M., Sonenberg N. (2001). Regulation of translation via TOR signaling: insights from Drosophila melanogaster. J. Nutr. 131, 2988S-2993S [DOI] [PubMed] [Google Scholar]
- Miron M., Lasko P., Sonenberg N. (2003). Signaling from Akt to FRAP/TOR targets both 4E-BP and S6K in Drosophila melanogaster. Mol. Cell. Biol. 23, 9117-9126 [DOI] [PMC free article] [PubMed] [Google Scholar]
- Narbonne P., Roy R. (2006). Inhibition of germline proliferation during C. elegans dauer development requires PTEN, LKB1 and AMPK signalling. Development 133, 611-619 [DOI] [PubMed] [Google Scholar]
- Niki Y. (2009). Culturing ovarian somatic and germline stem cells of Drosophila. Curr. Protoc. Stem Cell Biol. Chapter 2, Unit 2E 1 [DOI] [PubMed] [Google Scholar]
- Nystul T. G., Spradling A. C. (2009). Regulation of epithelial stem cell replacement and follicle formation in the Drosophila ovary. Genetics 184, 503-515 [DOI] [PMC free article] [PubMed] [Google Scholar]
- Pan D., Dong J., Zhang Y., Gao X. (2004). Tuberous sclerosis complex: from Drosophila to human disease. Trends Cell Biol. 14, 78-85 [DOI] [PubMed] [Google Scholar]
- Potten C. S., Loeffler M. (1990). Stem cells: attributes, cycles, spirals, pitfalls and uncertainties. Lessons for and from the crypt. Development 110, 1001-1020 [DOI] [PubMed] [Google Scholar]
- Pritchett T. L., Tanner E. A., McCall K. (2009). Cracking open cell death in the Drosophila ovary. Apoptosis 14, 969-979 [DOI] [PMC free article] [PubMed] [Google Scholar]
- Reddy P., Liu L., Adhikari D., Jagarlamudi K., Rajareddy S., Shen Y., Du C., Tang W., Hamalainen T., Peng S. L., et al. (2008). Oocyte-specific deletion of Pten causes premature activation of the primordial follicle pool. Science 319, 611-613 [DOI] [PubMed] [Google Scholar]
- Royzman I., Orr-Weaver T. L. (1998). S phase and differential DNA replication during Drosophila oogenesis. Genes Cells 3, 767-776 [DOI] [PubMed] [Google Scholar]
- Song X., Xie T. (2003). Wingless signaling regulates the maintenance of ovarian somatic stem cells in Drosophila. Development 130, 3259-3268 [DOI] [PubMed] [Google Scholar]
- Spradling A. C. (1993). Developmental genetics of oogenesis. The Development of Drosophila melanogaster, vol. 1 (ed. M. Bate and A. M. Arias), pp. 1-70, Plainview, NY: Cold Spring Harbor Laboratory Press; [Google Scholar]
- Tapon N., Ito N., Dickson B. J., Treisman J. E., Hariharan I. K. (2001). The Drosophila tuberous sclerosis complex gene homologs restrict cell growth and cell proliferation. Cell 105, 345-355 [DOI] [PubMed] [Google Scholar]
- Teleman A. A., Chen Y. W., Cohen S. M. (2005). 4E-BP functions as a metabolic brake used under stress conditions but not during normal growth. Genes Dev. 19, 1844-1848 [DOI] [PMC free article] [PubMed] [Google Scholar]
- Teleman A. A., Hietakangas V., Sayadian A. C., Cohen S. M. (2008). Nutritional control of protein biosynthetic capacity by insulin via Myc in Drosophila. Cell Metab. 7, 21-32 [DOI] [PubMed] [Google Scholar]
- Thomer M., May N. R., Aggarwal B. D., Kwok G., Calvi B. R. (2004). Drosophila double-parked is sufficient to induce re-replication during development and is regulated by cyclin E/CDK2. Development 131, 4807-4818 [DOI] [PubMed] [Google Scholar]
- Ueishi S., Shimizu H., H. Inoue Y. (2009). Male germline stem cell division and spermatocyte growth require insulin signaling in Drosophila. Cell Struct. Funct. 34, 61-69 [DOI] [PubMed] [Google Scholar]
- Wang X., Proud C. G. (2009). Nutrient control of TORC1, a cell-cycle regulator. Trends Cell Biol. 19, 260-267 [DOI] [PubMed] [Google Scholar]
- Wang Y., Riechmann V. (2007). The role of the actomyosin cytoskeleton in coordination of tissue growth during Drosophila oogenesis. Curr. Biol. 17, 1349-1355 [DOI] [PubMed] [Google Scholar]
- Wang Z., Lin H. (2005). The division of Drosophila germline stem cells and their precursors requires a specific cyclin. Curr. Biol. 15, 328-333 [DOI] [PubMed] [Google Scholar]
- Whittaker A. J., Royzman I., Orr-Weaver T. L. (2000). Drosophila double parked: a conserved, essential replication protein that colocalizes with the origin recognition complex and links DNA replication with mitosis and the down-regulation of S phase transcripts. Genes Dev. 14, 1765-1776 [PMC free article] [PubMed] [Google Scholar]
- Wu X., Tanwar P. S., Raftery L. A. (2008). Drosophila follicle cells: morphogenesis in an eggshell. Semin. Cell Dev. Biol. 19, 271-282 [DOI] [PMC free article] [PubMed] [Google Scholar]
- Xie T., Spradling A. C. (1998). decapentaplegic is essential for the maintenance and division of germline stem cells in the Drosophila ovary. Cell 94, 251-260 [DOI] [PubMed] [Google Scholar]
- Yaba A., Bianchi V., Borini A., Johnson J. (2008). A putative mitotic checkpoint dependent on mTOR function controls cell proliferation and survival in ovarian granulosa cells. Reprod. Sci. 15, 128-138 [DOI] [PubMed] [Google Scholar]
- Yan Y. P., Sailor K. A., Vemuganti R., Dempsey R. J. (2006). Insulin-like growth factor-1 is an endogenous mediator of focal ischemia-induced neural progenitor proliferation. Eur. J. Neurosci. 24, 45-54 [DOI] [PubMed] [Google Scholar]
- Yilmaz O. H., Valdez R., Theisen B. K., Guo W., Ferguson D. O., Wu H., Morrison S. J. (2006). Pten dependence distinguishes haematopoietic stem cells from leukaemia-initiating cells. Nature 441, 475-482 [DOI] [PubMed] [Google Scholar]
- Zahn J., Doormann P., Dorn A., Dorn D. C. (2007). Apoptosis of male germ-line stem cells after laser ablation of their niche. Stem Cell Res. 1, 75-85 [DOI] [PubMed] [Google Scholar]
- Zhang H., Stallock J. P., Ng J. C., Reinhard C., Neufeld T. P. (2000). Regulation of cellular growth by the Drosophila target of rapamycin dTOR. Genes Dev. 14, 2712-2724 [DOI] [PMC free article] [PubMed] [Google Scholar]
- Zhang R. L., Zhang Z. G., Zhang L., Chopp M. (2001). Proliferation and differentiation of progenitor cells in the cortex and the subventricular zone in the adult rat after focal cerebral ischemia. Neuroscience 105, 33-41 [DOI] [PubMed] [Google Scholar]
- Zhang Y., Billington C. J., Jr, Pan D., Neufeld T. P. (2006). Drosophila target of rapamycin kinase functions as a multimer. Genetics 172, 355-362 [DOI] [PMC free article] [PubMed] [Google Scholar]
Associated Data
This section collects any data citations, data availability statements, or supplementary materials included in this article.