Abstract
Purpose
To investigate the release of surface-active agents (surfactants) from unworn soft contact lenses and their influence on the lens surface wettability in vitro.
Methods
Surface tension (ST) of blister pack solutions was measured by pendant-drop technique. STs at the air-aqueous interface and contact angles (CAs) of four conventional and seven silicone hydrogel (SiH) soft contact lenses (SCLs) were evaluated in a dynamic-cycling regime using a modified captive-bubble tensiometer-goniometer. Measurements were performed immediately after removal from blister packs, and after soaking in a glass vial filled with a surfactant-free solution, which was replaced daily for one week. Lens surface wettability was expressed as adhesion energy (AE) according to Young’s equation.
Results
STs of all blister pack solutions were lower than the reference ST of pure water (72.5 mN/m), indicating the presence of surfactants. When lenses were depleted of surfactants by soaking, the STs of all studied lenses and advancing CAs of selected lenses increased (p < 0.001). Receding CAs of all studied lenses were 12° ± 5° and were not affected by the presence of surfactants. For most of the conventional lenses, the surface wettability was largely dependent on surfactants, and reduced significantly after surfactant depletion. In contrast, most SiH lenses exhibited stable and self-sustained surface wettability in vitro.
Conclusions
The manufacturer-added surfactants affected wetting properties of all studied SCLs, although to different degrees.
Keywords: soft contact lenses, surface wettability, dynamic contact angles, aqueous adhesion energy
Stability and uniform coverage of the corneal surface by the tear film are important factors in maintaining good ocular health. The ocular tear film is a highly dynamic and complex biological system operating under stresses induced by eyelid movement during blinking. A model has been proposed to explain the relationships among tear breakup time and fluid-film physical properties such as viscosity, surface tension, meniscus radius, and initial and final film thicknesses.1 This model suggests that the tear film is destined to rupture through evaporative film thinning and/or inherent hydrodynamic instabilities. Insertion of a contact lens onto an eye divides the tear film into two thinner parts — the pre-lens and post-lens tear films. A thinner fluid film is more susceptible to spontaneous rupture;1–4 this has important clinical implications because fast tear-film break-up has been linked to discomfort during contact lens wear.5
Effective and full tear-film recovery is believed to depend on the wettability of the ocular surface6–8 or, in the case of contact lenses, on the lens surface-wetting properties.9–14 As a result, the contact lens industry has invested significant research effort into developing a soft lens surface that is highly wettable in the ocular environment. In general, several approaches can be used to enhance surface wettability. The traditional approach developed first for conventional hydrogels of HEMA copolymers lenses is to add surface-active wetting agents into lens packaging or lens care solutions. Wetting agents adsorbed on the lens surface are expected to improve the wettability of the lens surface. However, these surfactants can also penetrate into a lens matrix, and it is conceivable that they could also leach out during lens wear. Furthermore, the clinical benefits of this approach have not yet been carefully investigated. The techniques used more recently for silicone hydrogel (SiH) lenses are either plasma surface oxidation (e.g., PureVision and Focus Night&Day) or introduction of a hydrophilic co-polymer into the lens material (e.g., Acuvue Advance, Acuvue Oasys).
The most widely used method to characterize the wettability of a solid surface is to measure contact angles (CAs). It is commonly believed that the wetting behavior of a soft contact lens (SCL) surface as assessed by CA measurement can predict the performance of the contact lens in vivo: the lower the CA, the better the wettability of the lens surface, and thus the greater the stability of the tear film spread over the lens surface. The cosine of the CA of a liquid drop resting on a solid surface and in equilibrium with a surrounding vapor (gas phase) is determined by Young’s Equation:15
| (1) |
where θe is the equilibrium CA, and γsv, γsl, are the interfacial tensions between the solid and the vapor, and the solid and the liquid, respectively, and γlv is the surface tension of the liquid. The expression in parenthesis, (γsv − γ sl), is a specific property of a solid-liquid interface and is usually referred to as adhesion tension or adhesion energy; it characterizes the propensity of a liquid attraction toward a solid. When the liquid wets the solid surface completely (i.e., spreads spontaneously over the solid surface and forms a thermodynamically stable film with zero CA), the adhesion energy is numerically equal to the surface tension of the spreading liquid, which is 72.4 mN/m for pure water at the room temperature. CAs alone, as one can see from Young’s Equation (1), do not provide a true estimate of surface wettability unless the surface tension of the liquid is taken into account. Lack of surface tension measurements has led to controversial and inconsistent claims about the CAs of SCLs in the literature. Furthermore, the resolution of the controversies in CA measurements is further complicated by different measurement techniques and/or different media in which measurements were made.11–14, 16–18
In contrast to most published studies in which static CA measurements (i.e., measurements taken at rest, using the sessile drop technique for advancing, and the captive bubble technique for both advancing and receding CAs) 11–14, 16–18 were taken on a small portion of a SCL surface, this study focused on wettability dynamics when CA measurements were taken over a relatively large surface (up to 3/4 of the total area of a soft contact lens). We modified the captive-bubble method19,20 to systematically study the advancing (corresponding to a film recovery process) and receding (corresponding to a film break-up) CAs on conventional hydrogels and SiH lenses under dynamic-cycling conditions mimicking blinking cycles. In our experiments, the three-phase contact line, that is, the boundary among lens, air bubble, and aqueous phase, was repeatedly moved along most of the lens surface.19,21 We also employed the modified captive-bubble technique to concurrently measure the surface tension at the aqueous-air interface. With this new experimental approach of simultaneous CA and surface tension measurements, we aimed to systematically characterize the surface wettability of several conventional hydrogels and SiH lenses using adhesion energy as a universal, physically meaningful measure of surface wettability. The knowledge gained from these experiments will provide new insights into the mechanisms that determine contact lens surface wettability under dynamic conditions in vitro.
MATERIALS AND METHODS
Lens Materials
The brands of contact lenses and their specifications as listed by manufacturers are shown in Table 1.
Table 1.
Soft contact lens materials and specifications; surface tension of packaging solutions.
| Lens Brand Name (Abbreviation) |
Material (Manufacturer) |
Surface Treatment |
% H2O | Lens Specifications Power (D)/Diameter (mm)/Base Curve Radius (mm) |
Surface Tension of Packaging Solutions Mean ± SD (mN/m) |
|---|---|---|---|---|---|
| Acuvue 2 | Etafilcon A (Vistakon) |
None | 58 | −1.00/8.7/14.0 | 53.5 ± 1.8 |
| Biomedics 55 Premier | Ocufilcon D (Cooper Vision) |
None | 55 | −1.00/8.6/14.2 | 41.6 ± 1.5 |
| Extreme H2O | Hioxifilcon D (Hydrogel Vision) |
None | 54 | −1.00/8.6/14.2 | 37.9 ± 0.7 |
| Proclear | Omafilcon A (Cooper Vision) |
None | 62 | −1.00/8.6/14.2 | 59.8 ± 2.5 |
| AirOptix Night&Day | Lotrafilcon A (Ciba Vision) |
None, (Aqua Moister) | 24 | −1.00/8.6/13.8 | 68.1 ± 1.0 |
| Accuvue Advance | Galyfilcon A (Vistacon) |
None, (Internal PVP) | 47 | −1.00/8.7/14.0 | 58.5 ± 2.3 |
| Accuvue Oasys | Senofilcon A (Vistacon) |
None, (Internal PVP) | 38 | −1.00/8.8/14.0 | 46.5 ± 1.5 |
| Biofinity | Comfilcon A (Cooper Vision) |
None | 48 | −1.00/8.6/14.0 | 44.5 ± 0.4 |
| Focus Night&Day | Lotrafilcon A (Ciba Vision) |
Plasma coating | 24 | −1.00/8.6/13.8 | 66.5 ± 0.6 |
| O2Optix | Lotrafilcon B (Ciba Vision) |
Plasma coating | 33 | −1.00/8.6/14.2 | 70.3 ± 0.6 |
| PureVision | Balafilcon A (Bausch&Lomb) |
Plasma oxidation | 36 | −1.00/8.6/14.0 | 70.0 ± 0.2 |
Surface Tension Measurements
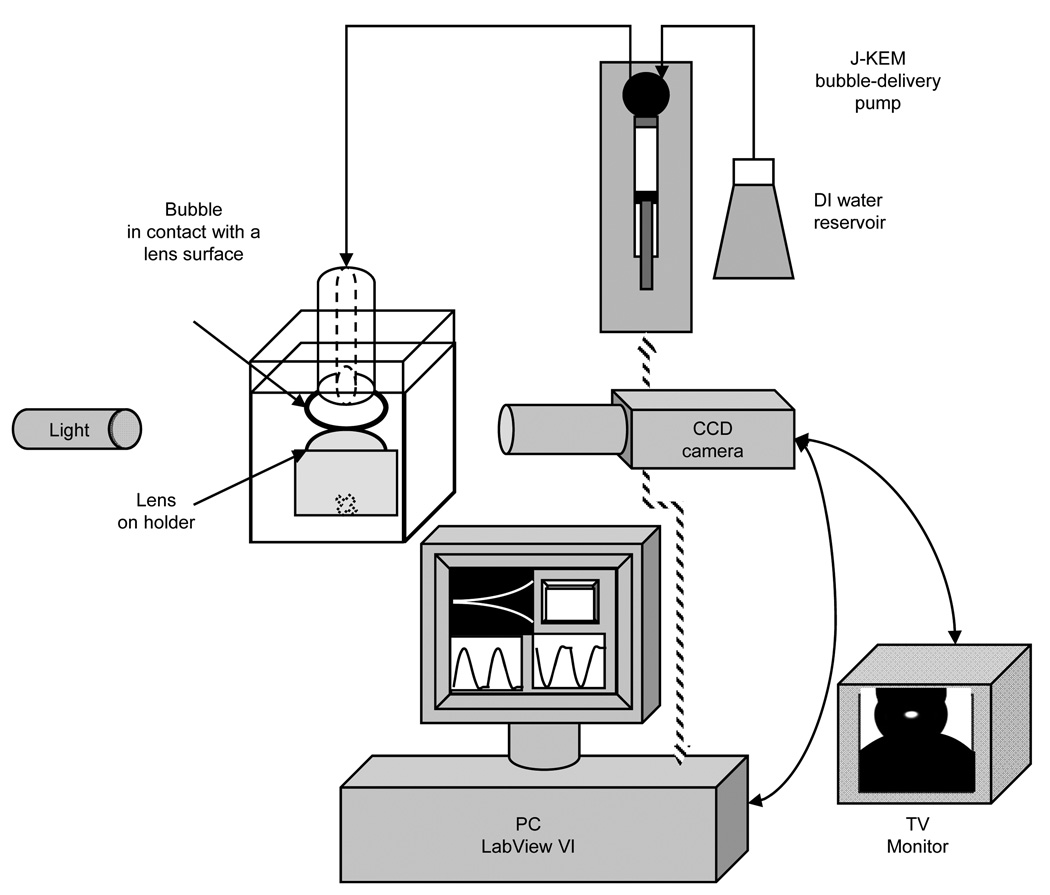
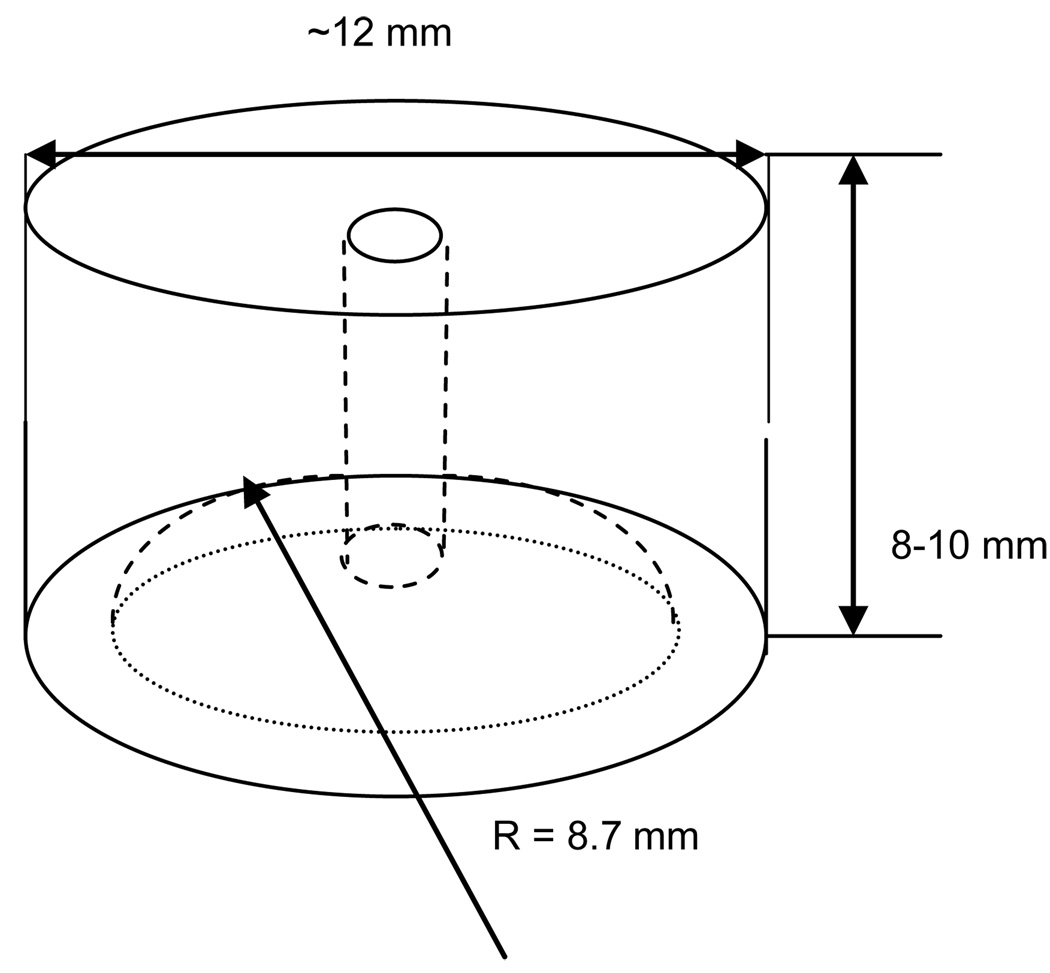
Surface tension measurements were performed using Krüss DSA100 tensiometer (Krüss GmbH, Hamburg, Germany). A J-KEM (SYR-1200, J-KEM Scientific, St. Louis, MO, USA) micro-syringe pump was used to dispense the air bubbles. A schematic of the instrument is depicted in Figure 1. The apparatus was mounted on a vibration-isolated table and equipped with manufacturer-supplied programs employing an axy-symmetric drop or bubble shape analysis algorithm to calculate the surface tension between air and aqueous phase from a captured drop or bubble images. The program provided fast (maximum 3 readings per second), accurate, and repeatable (SD = ± 0.1 mN/m) real-time surface tension values. We employed two different configurations for surface tension measurements: a pendant drop configuration and a sessile-bubble configuration. The former configuration was used only for blister pack solutions. A drop of liquid was made at the tip of a stainless steel needle connected to a syringe, then the needle was fixed inside an optical cell containing a small amount of a surfactant-free solution (e.g., OptiFree® or OF) and sealed to reduce drop evaporation. In the sessile-bubble configuration, an air bubble, formed by dispensing air through a hole drilled in the Teflon rod as depicted in Figure A2 (Appendix), was immersed vertically into a cell filled with aqueous media. The details of the sessile bubble configuration have been published elsewhere.22,23 Distilled and deionized water was used as a standard for reference purposes for both pendant drop and sessile bubble configurations. The surface tension of water, which is a constant physical characteristic of pure liquid, measured under both configurations was 72.4 ± 0.15 mN/m, in excellent agreement with the reference value of pure water at 22° C.
Figure 1.
Schematic of the sessile-captive bubble tensiometer-goniometer setup.
Figure A2.
Schematic of the Teflon® bubble holder.
Due to the limited volume of blister pack solutions, typically 1 ml or less, only the pendant drop configuration was used for surface tension measurements. Each individual blister pack solution was tested separately. The measurements were conducted at an ambient temperature of 22 ± 1° C, and repeated 3 to 5 times.
Prior to CA and surface tension measurements, the surface tension of the OF lens care solution from over 30 randomly selected bottles was measured. The mean and standard deviation (SD) of surface tension was 71.5 ± 0.5 mN/m for each bottle and remained constant up to 24 hours, indicating that OF solutions were surfactant free since this value of the surface tension was close to surface tension of pure water, 72.5 mN/m, at the same temperature.
Lens Preparation Protocol
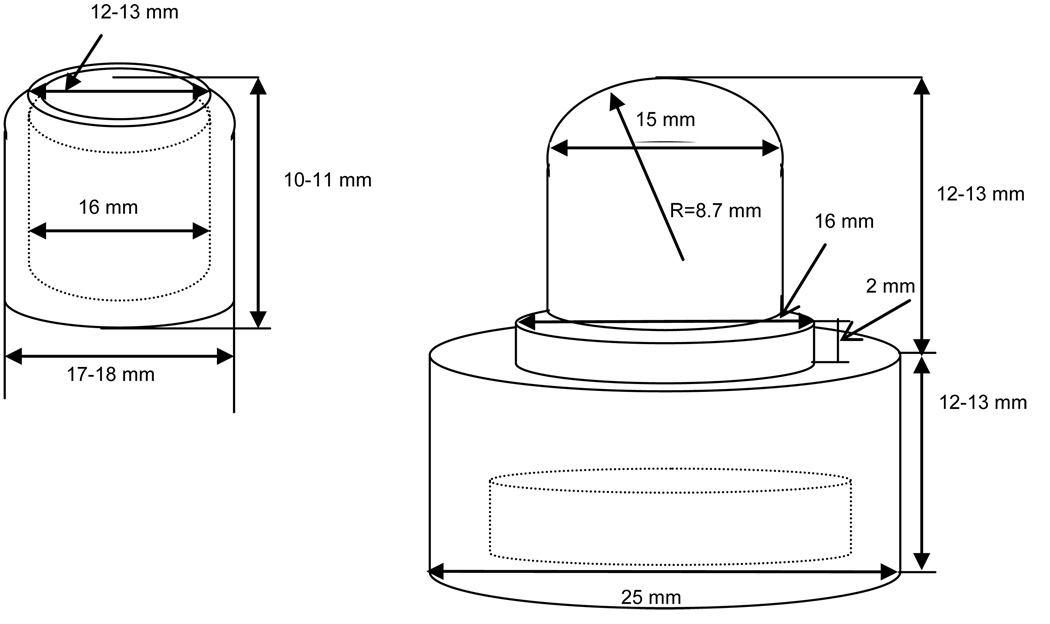
Lenses were removed from their blister packs by gently pulling them out with stainless steel "Duck Bill" flat nose tweezers while holding the lenses at their very edge. Each lens was then rinsed copiously with OF solution. Excess rinsing solution was quickly and gently drained by touching the lens edge with a fresh piece of filter paper (Fisher Scientific, USA). The lens was immediately placed in an optical glass vial, 30×30×40 mm, (Hellma Cells, USA) containing 15–20 ml of OF solution. The entire procedure of lens rinsing and draining took no more than a few seconds, thus ensuring minimal lens dehydration. Once immersed into the cell filled with OF solution, the lens was carefully centered on top of the lens holder with its anterior surface facing up and out toward the aqueous phase. The cylindrical cap of the lens holder was gently lowered on top of the lens and pressed down to hold the lens immobilized in the holder. Special care was taken to retain centering of the lens on the lens holder and to avoid possible air bubble entrapment between the lens and lens holder. A detailed drawing and description of the custom-made lens holder are provided in Appendix, Figure A1. A minimum of 5 lenses of each brand was tested.
Figure A1.
Schematic of the Teflon® lens holder. Left – top part; Right – bottom part.
CA and surface tension were measured immediately after the lens was removed from its blister pack (Baseline or Day 0) and measurements were repeated after soaking (Day 1 or 7). After baseline measurements, each lens was placed into a clean scintillation glass vial containing 20 ml of OF solution. The vials containing the lenses were then placed into a shaker (MaxQ2000, J-KEM Scientific, USA) and were agitated at a speed of 100 rpm overnight, typically for 16–18 hours. This procedure was repeated for 7 consecutive days and each day OF solution was replaced with fresh solution after overnight lens soaking. The soaking of the lenses in surfactant-free OF was performed to remove (leach out) the surface-active ingredients of the blister pack solution accumulated in the lens matrix and thus set apart the effect of these substances on the lens surface wetting properties from the inherent wettability of the lens material itself.
All manipulations of lenses, soaking solutions, and glassware were conducted using powder-free nitrile gloves to avoid contamination. Glassware, lens holders, and bubble holders were cleaned by soaking for 30 minutes, first in 3% HCl solution, then in saturated KOH in 95% ethanol solution, followed by a thorough rinsing with distilled and deionized water.
Contact Angle Measurements
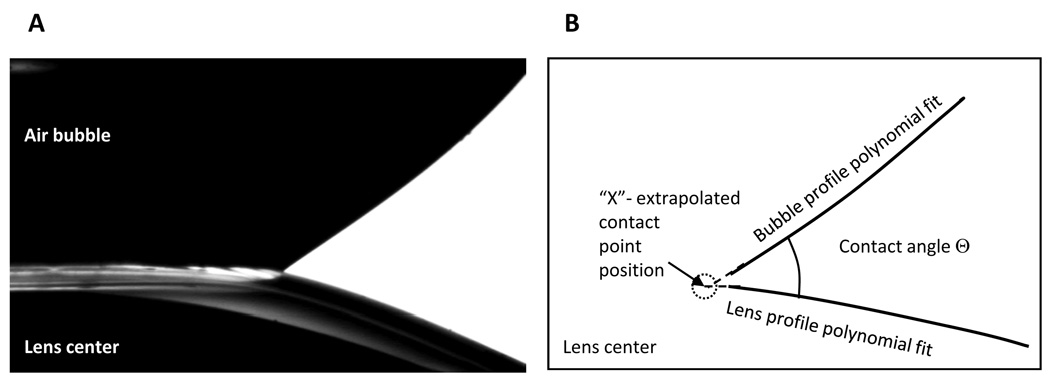
A Kruss tensiometer was equipped with an option for CA measurements employing either sessile drop or captive bubble configurations. With the standard software supplied by the manufacturer, these measurements could be conducted only on flat solid substrates. Customized software was required to measure CAs on a curved lens surface.16,18 In our experiments, an in-house LabView program was developed to perform real-time CA and contact point position data acquisitions.19,20,28–30 The program captured images of an air bubble in contact with a lens (Figure 2a), extracted profiles of both lens and bubble, and then fit these profiles with fourth-order polynomials (Figure 2b). The contact point position, denoted as “X” in Figure 2b, was determined from extrapolation of these fits to the point of intersection, and the CAs were calculated from fit tangents. Thus, data collection and treatment were completely computerized, excluding any kind of operator-dependent manual fit.16,18 At the magnification of 1 mm = 140 pixels used for detection of contact line position and the advancing and receding CA determination, the accuracy was ± 0.01 mm and ± 1.0°, correspondingly.
Figure 2.
(a) Captured image of the air bubble in contact with a soft contact lens. (b) Schematic of the computer-generated lens and bubble profile polynomial fits used for contact angle calculation.
The schematics and details of the bubble and lens holder designs, procedures for bubble-lens apex alignment, and other experimental procedures are described in the Appendix (see Supplemental Digital Content 1 describing wettability thermodynamics, bubble and lens holders and experimental procedures).
Statistical Analysis
Repeated measures analysis of variance was employed to assess the differences in CA, surface tension and adhesion energy between lens groups and across days for conventional hydrogels and SiH lenses. Post-hoc multiple pair-wise comparisons using the Tukey HSD method determined which pairs of lenses differed significantly from each other.
RESULTS
The surface tensions of the blister pack solutions from the different lens brands are reported in Table 1. Most of the blister pack solutions had surface tension lower than that of pure water (72.5 mN/m) or OF solution (71.2 mN/m), indicating that they contained surface-active ingredients. These additives could penetrate into the lens matrix during storage and leach out and subsequently be washed away during lens wear. As a result, the initial wettability of a pristine lens (i.e., a fresh lens removed from its blister pack) might be altered during wear due to the loss of these surfactants. We therefore examined the effect of surface-active ingredients released from SCLs on lens surface wettability after repetitive overnight soaking in surfactant-free media. Soaking in surfactant-free OF was employed to remove surface-active additives from the lenses so that the intrinsic wettability (i.e., the wettability of lens material itself in the absence of surface-active substances) could be evaluated. The means and standard deviations of CA, surface tension and adhesion energy, stratified by Day and lens type, are summarized in Table 2. CA data from Day 1 are also provided in addition to the CAs taken on Day 0 and Day 7. It is apparent that for most lenses, one day of soaking was not sufficient to deplete surfactants.
Table 2.
Summary of CAs, surface tension and adhesion energy values for different lens brands at days 0, and after day 1 and 7 of soaking in surfactant-free solution.
| Lens Brand | Surface Tension [mN/m] Mean ± SD |
Contact Angle [°] Mean ± SD |
Adhesion Energy [mN/m] Mean ± SD |
||||
|---|---|---|---|---|---|---|---|
| Day 0 | Day 7 | Day 0 | Day 1 | Day 7 | Day 0 | Day 7 | |
| Acuvue 2 | 44.43 ± 6.23 | 58.25 ± 3.45 | 10.88 ± 3.06 | 56.58 ± 24.02 | 83.73 ± 4.51 | 43.55 ± 6.41 | 8.68 ± 2.27 |
| Biomedics 55 Premier | 53.17 ± 2.02 | 59.07 ± 6.93 | 35.83 ± 11.27 | 44.90 ± 15.71 | 71.18 ± 6.92 | 43.83 ± 8.32 | 17.77 ± 7.71 |
| Extreme H2O | 60.5 ± 3.80 | 65.1 ± 1.81 | 48.5 ± 7.42 | 51.77 ± 2.94 | 57.6 ± 9.06 | 40.42 ± 8.43 | 34.88 ± 8.78 |
| Proclear | 57.33 ± 7.83 | 63.00 ± 7.42 | 55.60 ± 13.43 | 47.40 ± 7.50 | 79.70 ± 8.13 | 31.70 ± 12.72 | 11.74 ± 9.60 |
| Air Optix Night&Day Aqua | 57.18 ± 5.65 | 63.50 ± 2.71 | 17.00 ± 7.39 | 22.8 ±7.38 | 30.06 ± 3.77 | 54.19 ± 3.87 | 54.80 ± 1.10 |
| Acuvue Advance | 47.75 ± 2.91 | 62.55 ± 3.35 | 34.94 ± 3.53 | 29.90 ± 11.17 | 26.65 ± 13.77 | 39.30 ± 4.27 | 54.00 ± 8.46 |
| Acuvue Oasys | 49.13 ± 4.63 | 62.73 ± 3.72 | 16.43 ± 7.49 | 19.27 ± 9.32 | 27.73 ± 5.31 | 47.68 ± 3.87 | 54.32 ± 4.36 |
| Biofinity | 52.03 ± 5.54 | 63.13 ± 6.93 | 12.80 ± 4.49 | 9.30 ± 4.81 | 20.88 ± 9.33 | 50.38 ± 4.86 | 58.30 ± 5.95 |
| Focus Night&Day | 64.45 ± 2.84 | 67.88 ± 0.64 | 42.78 ± 4.37 | 48.50 ± 4.81 | 42.53 ± 5.22 | 47.15 ± 2.64 | 49.83 ± 3.76 |
| O2Optix | 60.00 ± 6.10 | 66.93 ± 2.11 | 35.93 ± 2.38 | 44.67 ± 2.74 | 48.70 ± 3.75 | 48.53 ± 4.51 | 44.16 ± 4.54 |
| PureVision | 60.13 ± 11.86 | 67.08 ± 0.70 | 82.95 ± 15.08 | 76.70 ± 2.15 | 74.40 ± 9.34 | 14.49 ± 28.49 | 17.79 ± 10.23 |
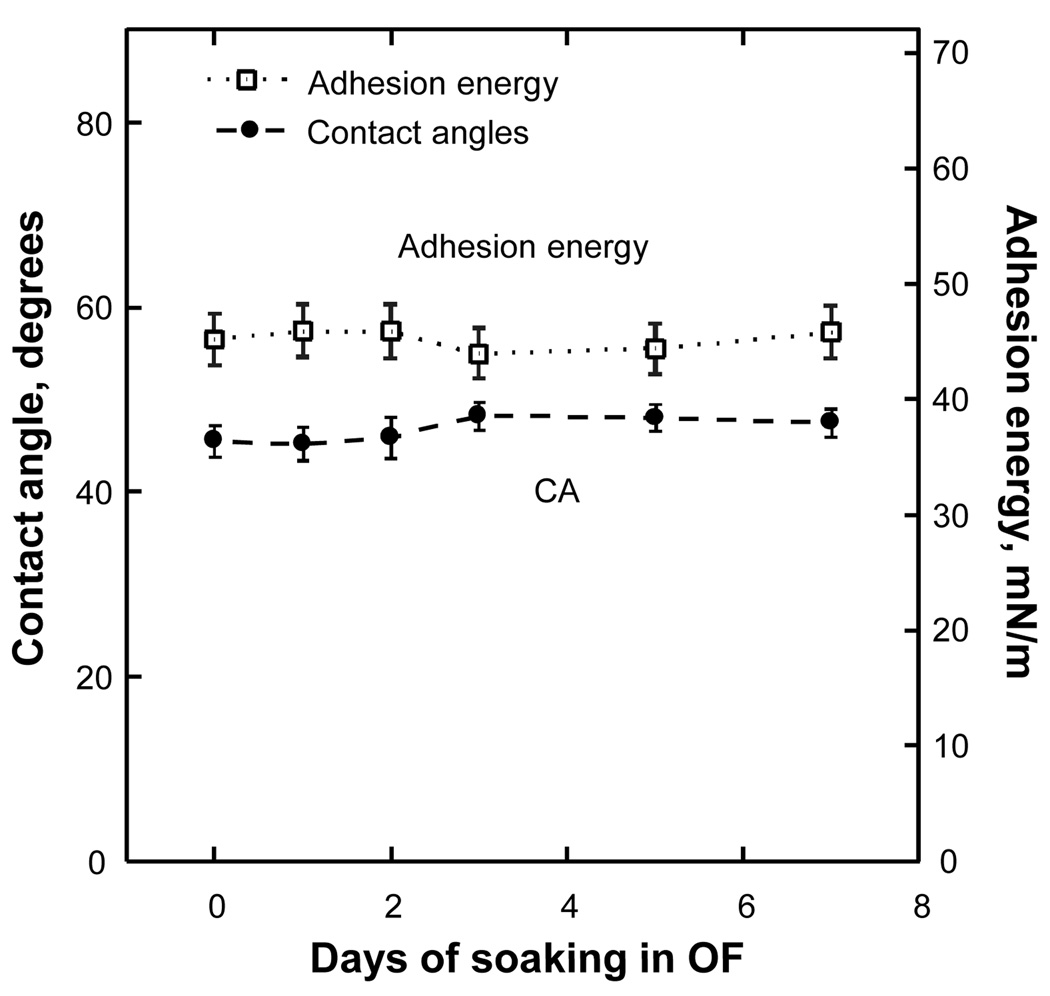
Figures 3 and 4 depict results for two lens types — Focus Night and Day, which has low water content and does not have surfactants in its blister packaging solution, and Acuvue 2, which is made of highly porous material and uses a packaging solution loaded with surface-active substances. Specifically, Figure 3 shows that the wettability of Focus Night & Day (pre-Aqua formulation) lenses remained nearly the same before and after soaking, in accordance with the data of Table 1, confirming that this lens brand had no surfactants in its blister pack solution. The small difference of 6.0 mN/m in surface tension between the Focus Night & Day blister pack solution and a reference liquid (water) is likely due to the presence of some organic impurities, such as hydrogel monomers or oligomers leaching from lens material during prolonged storage in blister pack. In Figure 3, the CAs and adhesion energies, numerically equal to the product of contact angle cosine and surface tension, are plotted as functions of soaking time. Each CA point corresponds to an average value of up to 100 CA measurements, performed according to the procedure described in the Appendix (see Supplemental Digital Content 1 describing wettability thermodynamics, bubble and lens holders and experimental procedures); the vertical bars show standard deviations.
Figure 3.
Contact angle and adhesion energy as functions of soaking time for the Focus Night&Day lens.
Figure 4.
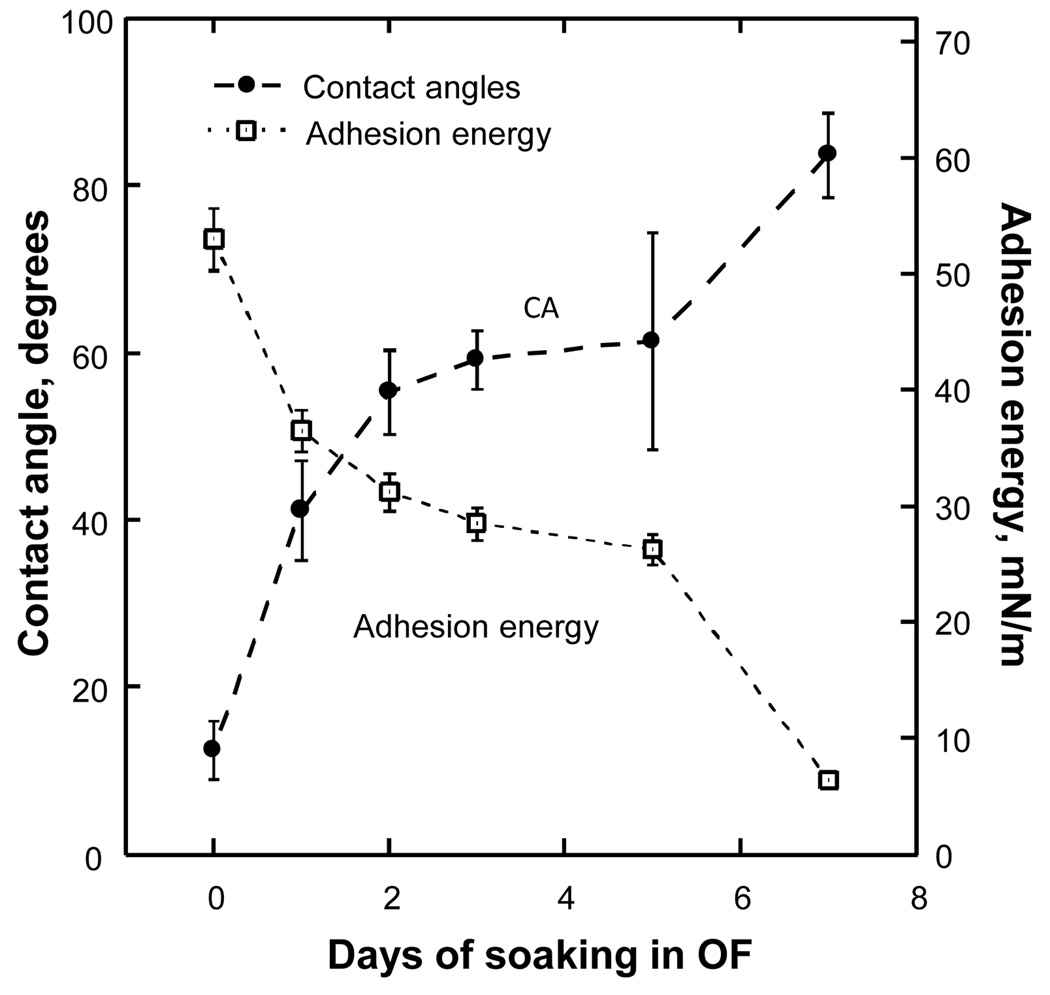
Contact angle and adhesion energy as functions of soaking time for the Acuvue 2 lens.
Figure 4 shows the wettability results for Acuvue 2 lenses measured according to the identical study protocol — CA and surface tension measured at Day 0 and after soaking in OF for up to 7 days. In contrast to Focus Night & Day lenses, the CA of Acuvue 2 lenses grew significantly after each overnight soaking and, correspondingly, the adhesion energy was reduced from 53.0 mN/m at Day 0 to 6.4 mN/m after soaking for 7 days, indicating that lens wettability was reduced by depletion of surface-active agents.
Repeated measures analysis of variance was performed separately for conventional hydrogels and SiH lenses. For conventional hydrogels lenses, the results showed that the overall differences in CA values between lens brands were significant (p < 0.001); after adjusting for multiple comparisons, only the Tukey HSD between Acuvue 2 and Proclear lenses was statistically significant (p < 0.001). The interaction between days of soaking and lens brand was not significant (p = 0.091), although this may be due to small sample sizes, as suggested by the apparent differences between brands listed in Table 2. For pristine Acuvue 2 lenses, the surface tension at Day 0 was low, then increased to a high level at Day 7. For Biomedic 55, Extreme H2O and Proclear lenses, most tested lenses started with mid-range surface tension at Day 0 and increased slightly at Day 7. There was a significant decrease overall in adhesion energy between Day 0 and Day 7 (p < 0.001). There were not significant differences among lens brands overall. There was, however, a significant interaction between Day and lens brand (p = 0.001), indicating that the magnitude and direction of the change in adhesion energy after 7 days of soaking differed among the brands of conventional lenses examined in this study.
The advancing CA on SiH lenses did not increase much after 7 days of soaking. Indeed, there was not a significant overall change in CA between Day 0 and Day 7 (p = 0.092). However, there were significant differences among lens brands overall (p < 0.001), and a significant interaction between Day and lens brand (p < 0.001), indicating that the different lens brands showed different patterns of change over 7 days of soaking in OF solution. Acuvue Oasys, Biofinity and O2 Optix all increased slightly in CA after soaking, while Focus Night & Day lenses remained unchanged. Interestingly, Acuvue Advance, Air Optix Night & Day Aqua and PureVision lenses all decreased slightly in CA after 7 days. PureVision lenses exhibited a very high CA overall, while Acuvue Advance, Acuvue Oasys, Air Optix Night & Day Aqua and Biofinity lenses exhibited a very low CA overall. After adjusting for multiple pair-wise comparisons, the Tukey HSDs showed PureVision to be significantly different from each of these other four lens brands. Focus Night & Day and O2 Optix were intermediate in CA between PureVision and the other SiH lens brands after soaking.
For the SiH lenses there was a significant difference in adhesion energy between Day 0 and Day 7 overall (p = 0.002), although the magnitude of the change in adhesion energy after soaking was much less than for conventional hydrogels lenses. There was a significant difference among lens brands in overall adhesion energy (p < 0.001), and post-hoc pair-wise comparisons show that PureVision lenses exhibited significantly lower adhesion energy than all other SiH brands.
At Day 0 all SiH lenses except Acuvue Advance and PureVision had aqueous adhesion energy higher than that exhibited by conventional hydrogels lenses, and after leaching of surface-active agents by soaking, all SiH lenses except PureVision had aqueous adhesion energy higher than that exhibited by conventional hydrogels lenses, indicating better wettability of SiH lenses. For all SiH lenses except AirOptix Night&Day Aqua and O2Optix lenses, adhesion energy increased slightly after 7 days of soaking in surfactant-free solution. Although of modest magnitude, these changes indicate that the wettability of the SiH lenses was actually enhanced after soaking in OF, as opposed to the aqueous adhesion energy reduction and wettability decline observed for most conventional lenses after depletion of surface-active ingredients.
It is important to note that the receding CAs for all studied lenses were similar in value (mean ± SD = 12° ± 5° for both conventional and SiH lens types) and were not affected by the presence of surfactants.
DISCUSSION
CA values are often reported in the marketing literature (e.g., packaging inserts) as a proof of good (or bad) lens surface wettability. However, it has been recognized that a standard technique for CA measurement has not yet been established, and that the validity of many reported data should be seriously questioned.18 In the scientific literature, one can find great divergence or disagreement between CAs measurements for the same lens brand using different techniques and different aqueous media.16,18,20,30 For instance, measured by the captive bubble technique, advancing CAs for PureVision lenses were reported to be 80°,20 93.6°,28 101°,18 and ~ 110°,31 compared to as high as 120° estimated by the sessile drop method 32. The advancing CA of 120° for the plasma-oxidized surface of PureVision lenses does not appear to be physically plausible. It is only 6° lower than the 126° found for Teflon,26 the most hydrophobic synthetic polymer known. These discrepancies cause substantial confusion and clearly indicate that these measurements were largely dependent on the methods and conditions used. It is worth noting that in all the papers cited above, the surface tension of the aqueous medium brought into contact with a lens surface was not taken into account in the assessment of lens-surface wettability.
The present work focused on modifying the current captive-bubble technique for reliable and physically plausible SCL surface wettability evaluations under dynamic-cycling conditions, mimicking blinking cycles in the eye. In accordance with the modern theory of wetting phenomena, special attention was paid to surface tension variations during the course of the experiments. We argue that CA measurements alone are not sufficient to obtain a physically meaningful surface-wettability evaluation. Only in combination with the surface tension of the aqueous phase in contact and equilibrated with the SCL surface will CA values form a set of parameters satisfying the thermodynamic requirements. In our experiments, all CA measurements were performed in conjunction with concurrent measurements of the surface tension at the air-aqueous interface.
We demonstrated that for most of the conventional SCLs examined in this study, there were surface-active ingredients present in the blister-pack solutions that led to a noticeable and positive effect on their initial wettability as gauged by adhesion energy in vitro. The adhesion energy values of Acuvue 2, Biomedic 55, Extreme H2O and Proclear lenses were found to be higher upon removal from the blister packs than after soaking in OF for 7 days, at which point most of the surface-active agents had leached out from the lens matrix. These data suggest that the wettability of these conventional hydrogels lenses was surfactant-dependent, and that the presence of surface active wetting agents in the blister pack solutions was necessary to improve the initial lens surface wettability.
As gauged by the aqueous adhesion energy, an improvement in surface wettability upon prolonged soaking in surfactant-free media was demonstrated for most of the SiH lenses. For these lenses, small but statistically significant changes in the advancing CAs and the surface tensions were observed during a week of soaking in a surfactant-free solution. Even though the advancing CAs increased slightly in most cases, the aqueous adhesion energy values became higher due to greater surface tension after lens-bubble equilibration. For O2Optix and Air Optix Night&Day Aqua lenses, however, slight increases in the advancing CAs and decreases or no change in the aqueous adhesion energies were observed after prolonged soaking. For these lenses, the loss of surface-active ingredients had a minor negative effect on surface wettability, which was, very small in comparison with that observed for conventional hydrogels lenses. Furthermore, most of the pristine SiH lenses (except PureVision) have relatively high aqueous adhesion energy when compared to conventional SCLs. The wettability of SiH lenses was sustained or even improved after prolonged soaking in OF. These observations suggest that the wettability of the SiH lenses measured in our experiments was a self-sustained property of their surfaces. The high surface wettability of SiH lenses was preconcerted by either lens surface treatment such as plasma oxidation (Focus Night&Day, PureVision) or by built-in lens-matrix surface-modifiers (Acuvue Oasys and Acuvue Advance), rather than being dependent on external (blister pack solution) wetting agents as was found for conventional hydrogels lenses.
We strongly believe that the aqueous adhesion energy values, calculated according to Young’s Equation 1, provide valuable and physically meaningful information regarding the wettability of soft lens surfaces. Often in previous studies, the surface wettability of different lenses was compared using CA measurements conducted in different aqueous media with varying and unknown surface tensions. The aqueous adhesion energy provides a thermodynamically defined scale for the evaluation and comparison of solid-surface wettability measured under different experimental conditions. The other important thermodynamic parameter for gauging the wetting of a solid by a liquid is the spreading parameter, or spreading coefficient S 15 defined as:
| [2] |
, where γsv is the surface tension of a solid surface against a gas phase (liquid vapor), γsl is an interfacial tension between liquid and solid phases, and γlv is the surface tension of a liquid in equilibrium with its vapor. When the spreading coefficient is positive, the liquid wets the solid surface completely, spreading spontaneously over the solid surface with zero CA. When S < 0, the liquid exhibits partial wetting, forming a drop or contact line with a CA defined by Young’s Equation 1. As one can see by comparing Equations 1 and 2, the adhesion energy of a solid surface brought into contact with a liquid has to be higher than the surface tension of that liquid to sustain a positive spreading coefficient for each particular liquid-solid combination. Equation 2 has an important practical implication, namely, that it sets a boundary for the aqueous adhesion energy value above which complete spreading of a liquid over a solid surface should be expected. Thus, the thermodynamics predict that for a contact lens with intrinsic aqueous adhesion energy above the surface tension of human tears, which is approximately 40 mN/m,33,34 one should expect that the tear fluid will wet a lens surface completely when a lens is placed on the eye. Complete wetting and tear-film spontaneous spreading with zero CA should be observed on the lens for at least some period of time during which the lens-surface retains its original adhesion energy. Note that adhesion energy is likely to be changed due to interaction with the tear constituents. There are indications in the literature20 that some model tear proteins, such as lysozyme and mucin, cause substantial reduction of the in vitro advancing CAs on soft contact lenses.
It is important to note that the receding CAs for all lenses studied were similar in value (mean ± SD = 12° ± 5° for both conventional and SiH lens types) and were not affected by the presence of surfactants. That is hardly surprising, because for highly porous contact lens materials, containing at least 25% and up to 75 % water, there is a strong interaction between the water residing in the pore openings on the lens surface and the receding aqueous phase. The hydrophilic parts of a lens surface attract and retain water as the aqueous phase recedes over the lens surface, which inevitably leads to the low values of dynamic receding angle. Contact angle hysteresis on a soft lens surface is related to the chemical heterogeneity of the porous lens surface. In the water advancing process one starts with a lens surface on which the aqueous film has ruptured, causing the lens surface to be in direct contact with the air. The advancing water has to displace the air in order to move over exposed hydrophobic polymeric patches on the lens surface, which resists being covered by water, preferring to remain covered by the air. To move over these water-repelling patches the aqueous front has to form a high advancing angle before the water starts to slide over and form a film covering these hydrophobic patches. Once the water film is ruptured and the hydrophobic surface is exposed to air, it requires extra energy (thus, a higher contact angle) to displace the air and form a continuous aqueous film on the surface.
The question of how in vitro lens-surface wettability is related to clinical contact lens performance, in vivo tear film stability, and subjective comfort ratings remains unanswered. Preliminary results have shown no correlations among these parmameters for asymtomatic soft lens wearers.35 However, a larger sample size is required to confirm this finding. The relationships among lens initial in vitro and ex vivo wettability (advancing CAs), clinically evaluated lens wettability in vivo, and non-invasive tear film stability in conjunction with comfort ratings by contact lens wearers (asymptomatic and symptomatic) will be addressed in forthcoming papers.
Some clinically relevant recommendations can be made based on the in vitro results reported here. It was found that SiH lenses do not significantly change their surface properties upon soaking in a surfactant-free medium. In fact, some of the SiH lenses exhibited better surface wettability after depletion of surfactants. It would be reasonable to suggest that patients with issues of hyper-sensitivity or intolerance to the “soapy” ingredients of the blister pack solutions might benefit from thorough rinsing of the lenses with a surfactant-free saline solution (e.g., Unisol4 or SoftWear) prior to insertion. It is also conceivable that one can remove irritating ingredients by disinfecting and soaking SiH lenses overnight in a surfactant-free lens care solution such as AOSept (CIBA) prior to the first use of a lens, which could be beneficial to patients with sensitive eyes.
ACKNOWLEDGMENTS
We would like to express our gratitude to C.J. Radke (Chemical Engineering Dept., University of Berkeley, California) for his invaluable help and support, K. A. Copley for programming the LabView VI version specifically adapted for contact angles on curved surface measurements, H. Weir for data collection, A.D. Graham for his advice on statistical analysis, and T. Sanders and J. Fiorillo for their assistance in manuscript preparation.
Our special thanks go to E. Granlund in the machine shop of the College of Chemistry, UC Berkeley, for his excellent job in designing and manufacturing lens- and bubble-holders. Grant/Financial Support: The research project was supported in part by NIH K12 EY017269 and UCB-CRC (University of California at Berkeley - Clinical Research Center) unrestricted funds from Cooper Vision, Carl Zeiss Vision, and the Morton Sarver Foundation.
APPENDIX
Thermodynamics of Wettability
According to modern concepts, the thermodynamic equilibrium shape and contact angle (CA) of a liquid drop resting on an ideal solid surface is determined by the balance among gravitational force, liquid cohesion energy (liquid-air surface tension), and adhesion energy between the liquid and underlying solid substrate (difference between solid-air and solid-liquid interfacial tensions).15 Equation 1 [cos θe = (γsv − γ sl)/ γlv] shows that CA is defined in terms of thermodynamic parameters and thus the measured equilibrium CA (θe) should provide information regarding the interfacial energies of the involved surfaces. The surface tension of a liquid (γlv) can easily be measured by separate experiments. Unfortunately, no methods have yet been developed to measure the surface (γsv) and interfacial (γsl) tensions of solids, thus leaving two unknowns in the Equation. However, de Gennes has emphasized that only the difference (γsv − γsl) between these two unknowns is important and relevant for wettability experiments.15,21
It has been found that under static conditions, Young’s Equation is valid for most liquids placed as drops onto the surface of a physically smooth and chemically homogeneous solid substrate. The situation changes when a drop or liquid front is moving along a non-ideal solid substrate. Under ideal conditions, a liquid should advance and recede with the same CA. However, in reality the CA measured with a liquid moving along a solid surface depends on the direction of liquid-solid-gas contact line movement. When a liquid is advancing over a solid surface, it displays an angle called the “liquid advancing angle.” A receding liquid moves along the solid with a typically lower angle called the “liquid receding angle.” The difference between these two angles quantifies the phenomenon known as “CA hysteresis.” CA hysteresis makes the interpretation of CA in the context of Young’s Equation ambiguous. The CA hysteresis phenomenon has been studied from a theoretical point of view as well as in many experimental studies and it was shown that only advancing contact angles can be used in Young’s Equation context..24–26 CA hysteresis can be caused by many different factors, such as physical surface roughness, chemical heterogeneity, absorption of liquid by porous solids, substrate swelling, and rate of liquid flow. On porous conventional hydrogels of HEMA copolymers, increase of water CA was found upon surface dehydration.16,27 The authors suggested that drying of a conventional hydrogel lenses may cause irreversible changes in the orientation of polymer molecules at the surface, and results in significant growth of the water advancing CA.16,27 In this study, we found no evidence of drying-related irreversible changes in lens wettability under our experimental conditions. It was found that the receding CAs of the lenses studied were similar to each other on a non-ideal surface (e.g., a soft lens surface) and only the advancing CAs varied among different lens brands.
Contact Angle Measurement
A schematic of the captive-bubble apparatus is shown in Figure 1. The bubble holder was positioned at some distance above a lens fixed in the lens holder, which was positioned at the bottom of a cell. This setup differed from that used in previously published captive bubble experiments in which the lens was held suspended in a cell from the top with its surface facing down and a rising air bubble was dispensed to it from a needle or capillary placed underneath a lens.8, 20,30–32 We have conducted several dynamic cycling experiments using the conventional rising bubble geometry and have found that bubble-lens alignment was time consuming and cumbersome. Moreover, as the bubble expands, it becomes unstable due to buoyancy and tends to fly away from underneath the lens, especially in the presence of surface-active substances. To eliminate these difficulties, both lens holder and bubble holder were modified and the system geometry was altered in a manner similar to that originally proposed by Ottewill in the late 1950s.21 Another goal of this design was to provide high stability of large bubbles regardless of surface tension. With this design, large air bubbles could be securely confined between the lens surface and a cavity in the Teflon bubble holder, with their edges pinned to the edge of the holder throughout the entire expansion-contraction cycle. We compared advancing CA values for Focus Night&Day lenses immersed in OptiFree® (OF) solution using both geometries (rising-captive bubble and sessile-captive bubble), and found excellent agreement between these values (rising bubble 44.1 ± 1.6°, sessile bubble 44.5 ± 1.0°). These values were also in good agreement with values reported in the literature.20,32 As mentioned previously, the time of lens exposure to the air was reduced to a few seconds during removal of excess rinsing solution, thus minimizing the risk of lens surface dehydration — important for obtaining accurate CA measurements for certain lens materials.
Lens- and Bubble-holder Design for Contact Angle Measurement
Both the cap and bottom parts of the contact lens holder, as well as the bubble holder, were custom made of Teflon® using highly precise tooling. A schematic of the lens holder is shown in Figure A1; all dimensions are in millimeters. The radius of curvature of the bottom part of the lens holder (rounded uppermost mold) was chosen to match a typical contact lens curvature. The cap has a circular opening at the top to expose most of the lens surface to the aqueous phase and to a captive air bubble. A Teflon-coated magnetic stir bar was imbedded into the bottom of the lens holder.
A magnetic stirrer (SCINICS,Co. Ltd., Tokyo, Japan) was used to rotate the lens holder inside a cell, and CAs could be measured along randomly chosen pathways.
A schematic of the Teflon® bubble holder is shown in Figure A2.
The hole drilled through the bubble holder was connected to a JKEM SYR-1200 micro-syringe pump for air bubble formation, contraction, and expansion. A hemispherical cavity 4 mm deep in the center, with a radius of curvature R = 8.7 mm matching the uppermost lens-holder mold, was drilled in the holder side facing downward toward the lens. This specific construction of the bubble holder served several important purposes:
To hold a large air bubble securely confined between the highly hydrophobic Teflon® surface and the lens surface regardless of bubble size or surface tension at the aqueous-air interface.
To provide a uniform thickness of the air-filled space between the Teflon® and a lens. This, in turn, ensured a uniform radial flow of liquid between the lens and the air bubble when it was expanded or compressed. Keeping the bubble edge pinned to the edge of the cavity thus prevented the upper contact line at bubble-Teflon® boundary from moving.
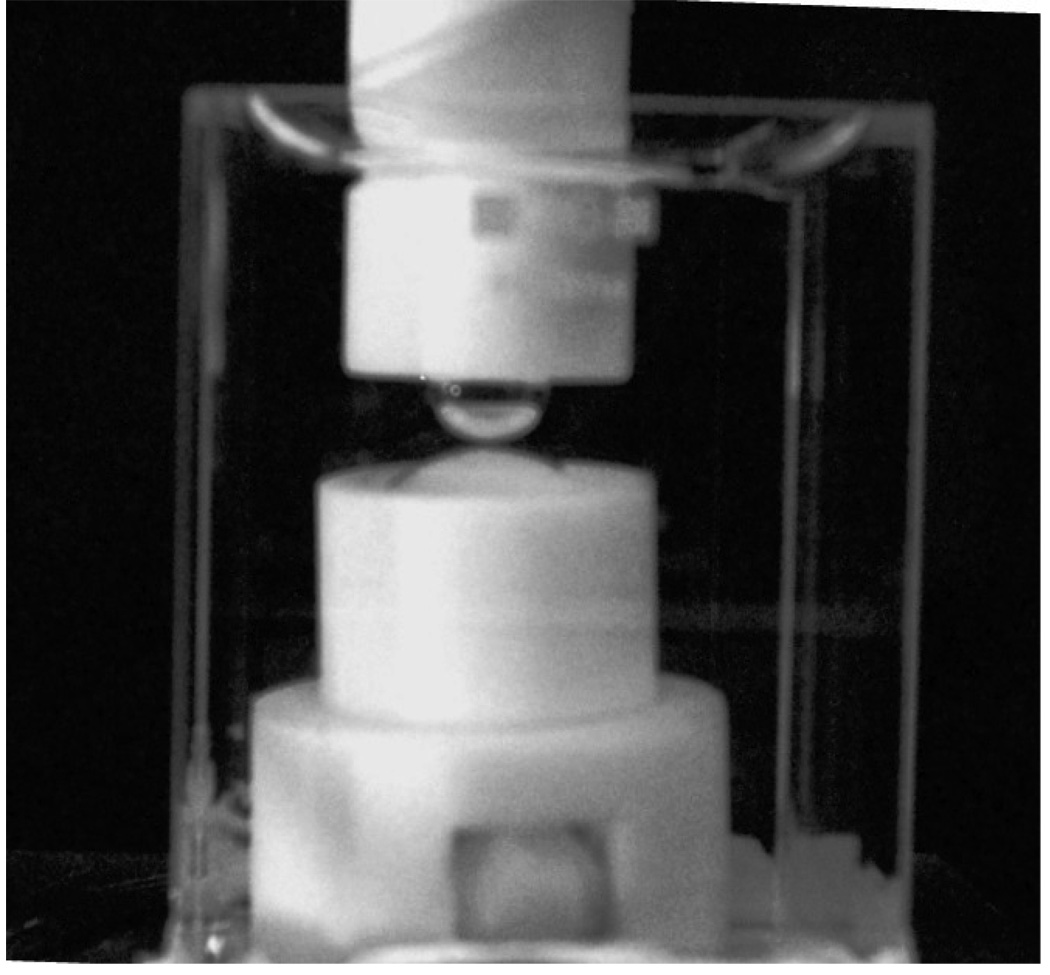
A photograph of the actual lens and bubble assembly in the holders inside an optical cell is shown in Figure A3.
Figure A3.
Photograph of the captive-bubble assembly in an optical cell.
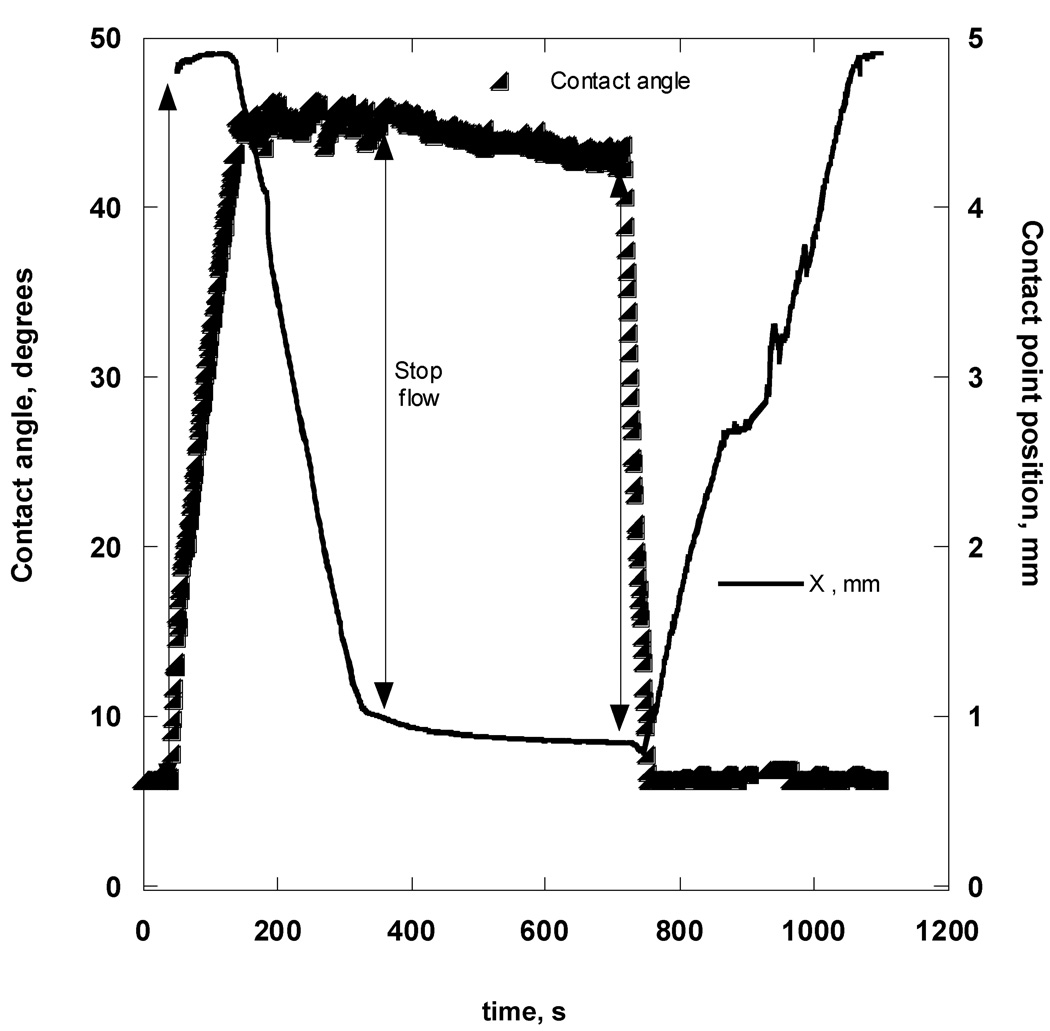
Figure A4 shows typical data obtained in the course of a dynamic-cycling experiment for a Focus Night&Day lens immersed in OF solution. A minimum of 5 cycles was repeated for each bubble; however, only one representative cycle is shown in Figure 5a. The beginning of a cycle corresponded to a fully-blown bubble at rest with the air-OF-lens contact line receded to a position approximately 5 mm away from the lens center.
Figure A4.
CA (triangles) and contact point “X” position (solid line) measurements during one cycle of bubble expansion and contraction while in contact with the Focus Night&Day lens.
The receding CA measurement at this position was 6.2 ± 0.3°. An arrow indicates the moment when the air was first withdrawn from the captive bubble. Shortly after this moment, the CA started to increase, but the contact-line radius did not change until the advancing CA reached 44.5° ± 1.0°. Thereafter, the contact line began to move, and the aqueous phase was advanced toward the lens center with a constant velocity and nearly constant CA. After the contact line had advanced to a distance approximately 1 mm from the lens center, air pumping was stopped, as indicated by the second arrow, and the bubble was left at rest for approximately 5 minutes. No significant changes in the CA were observed during this time. The third arrow indicates the moment when air pumping into the captive bubble resumed; the CA began decreasing until it reached a certain value of 6.5°, at which point the contact line commenced moving toward the lens periphery with a constant speed and a nearly constant receding CA of 6.4 ± 0.6°. After the first 5 cycles, the bubble was detached from the lens surface and the surface tension was measured. The lens holder was then rotated inside the cell and a new bubble was brought into contact with the lens surface; CA and surface tension measurements were repeated to ensure that the same wetting behavior was observed over different areas of the lens surface. The small jumps in advancing CA were a reproducible feature for this particular lens. The lens profiles appeared smooth at 4×-magnification; therefore, we attributed these contact line jumps to microscopic irregularities on the lens surface, due to physical roughness or chemical heterogeneity.
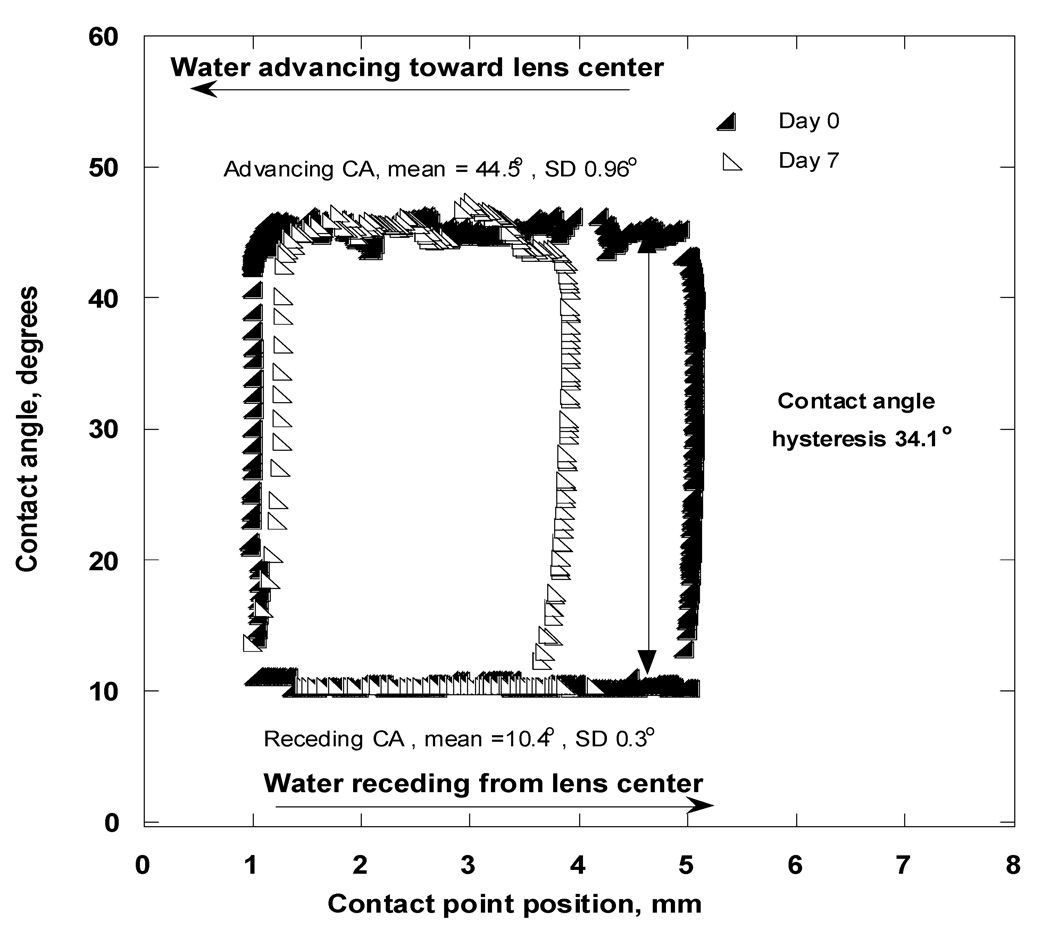
In Figure A5, the measured CAs on a Focus Night&Day lens are plotted as a function of contact-point position X (i.e., the distance of the contact point from the lens center as depicted in Figure 2b). This representation is often used in the literature to show the difference between advancing and receding CAs, that is, CA hysteresis. The Focus Night&Day lens showed a substantial CA hysteresis of 34.1°, which remained the same while the bubble was moving along the lens surface, independent of the contact-point position.
Figure A5.
Contact angles as functions of contact point “X” position (hysteresis loops) for the Focus Night&Day lens immersed in OF at Day 0 (solid triangles) and Day 7 (open triangles).
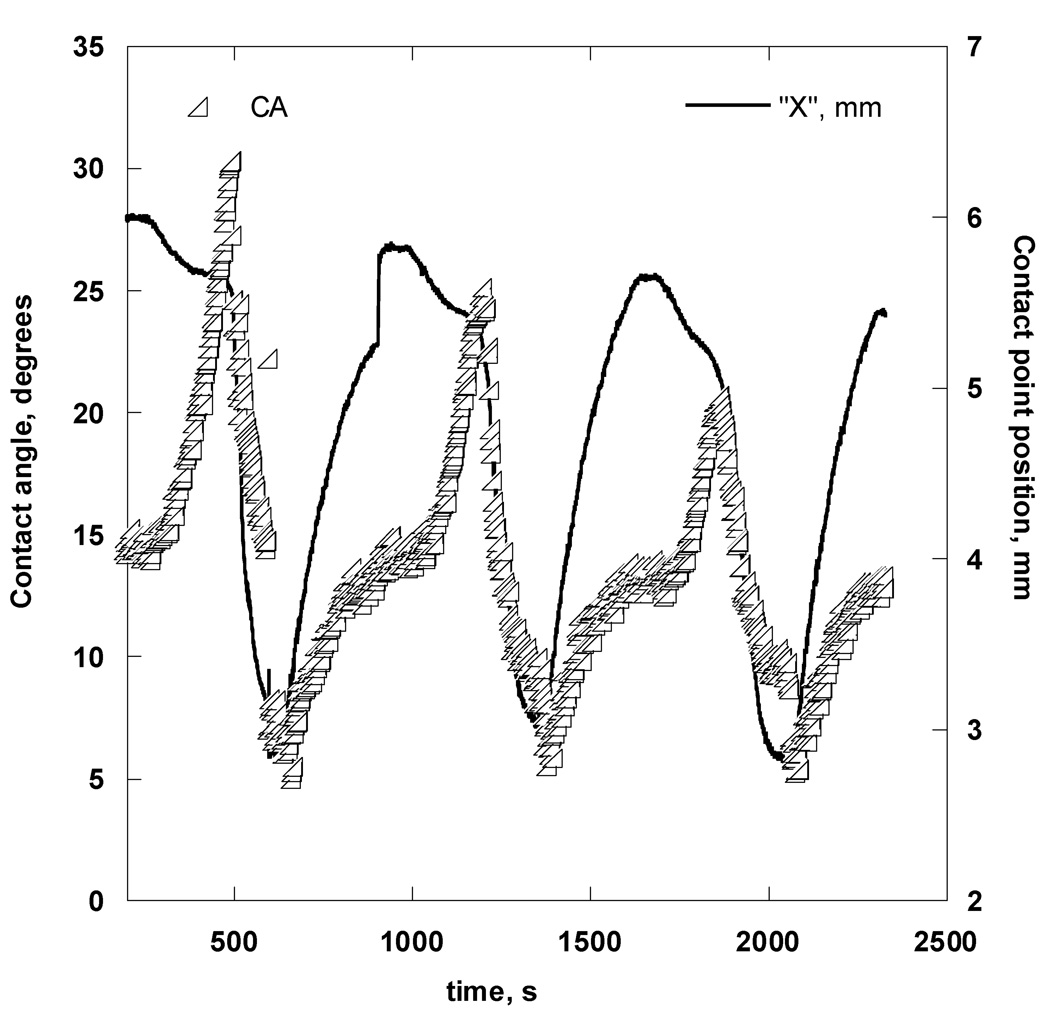
Figure A6 illustrates the CA results obtained for Acuvue 2 lenses during three consecutive advancing-receding cycles. As shown in Table 1, the Acuvue 2 blister pack solution exhibited low surface tension, suggesting the presence of surface-active agents. CAs of a pristine Acuvue 2 lens (Day 0) are depicted as a function of time in Figure A6.
Figure A6.
CA (triangles) and contact point “X” position (solid line) measurements during three cycles of bubble expansion and contraction while in contact with the Acuvue 2 lens immersed in OF at Day 0.
For pristine Acuvue 2 lenses, the advancing CA history was very different from that observed for Focus Night&Day lenses. At the beginning of the first cycle, the angle increased up to 30.6° while the contact line commenced moving slowly almost immediately after air bubble began to contract. Advancing CAs did not stay constant after reaching a maximum value, as was observed for Focus Night&Day lenses, but decreased rather rapidly and reached a value as low as 5° while the aqueous phase was still advancing and the contact line was moving toward the lens center. Likewise, receding CAs were not constant, but increased slightly from 5° to 15° when the contact line propagated from the lens center toward its periphery. In the second and third cycles, the maximum advancing CA was lower than the initial one, but there was no change after the third cycle. The advancing and receding CA values changed continuously as the contact line was in motion, unlike what was observed for Focus Night&Day lenses. These CA dynamics can be attributed to a gradual increase of surface-active agent adsorption at the air bubble surface, which caused surface tension reduction. This was confirmed when the surface tension was measured after the first and last cycles. At the end of the first cycle, the surface tension was reduced to approximately 52 mN/m, whereas after the last cycle, the surface tension was 42.3 mN/m, very close to the equilibrium surface tension of the blister pack solution.
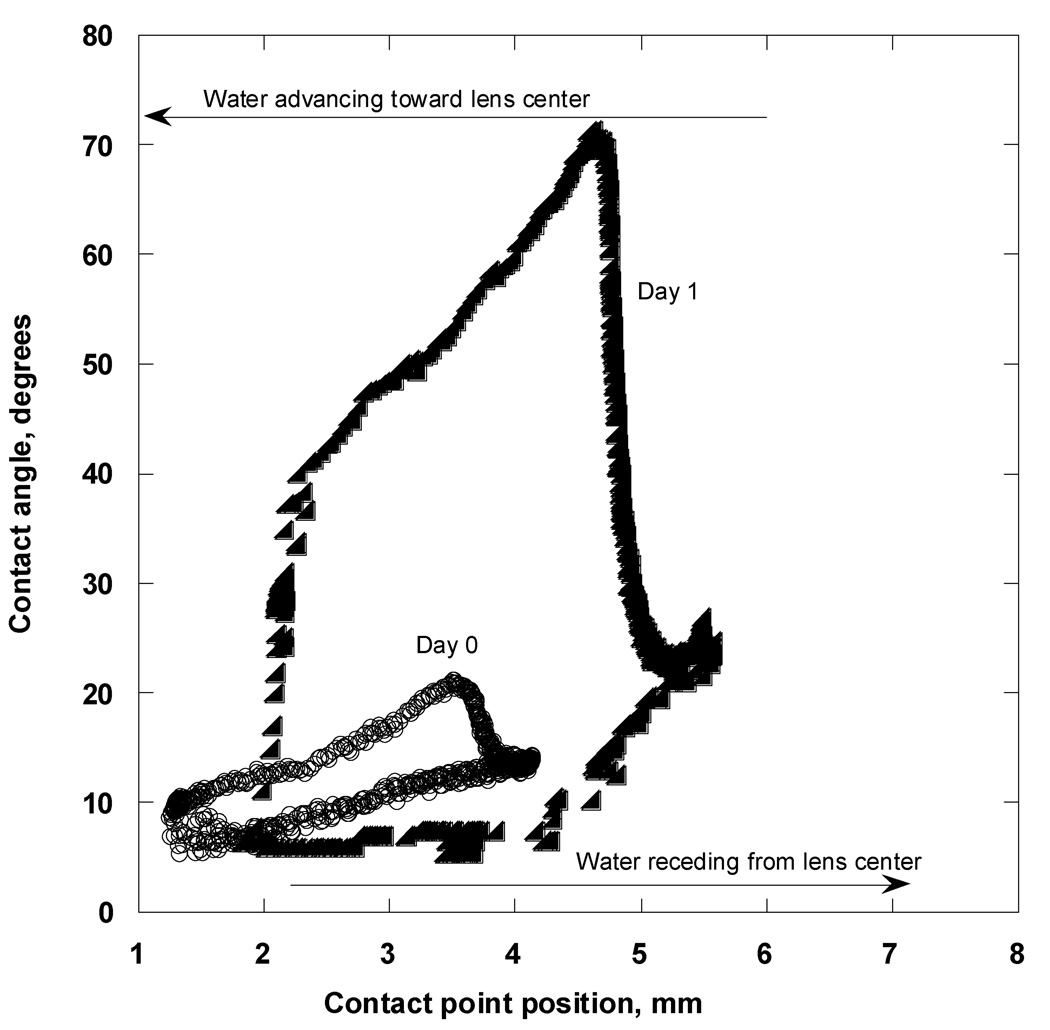
The gradual loss of surface-active ingredients continued while the lens was soaked in OF. Figure A7 illustrates the hysteresis loops for an Acuvue 2 lens soaked in OF for one day and immediately upon removal from the blister pack. Pristine lenses were characterized by low advancing (advancing CA of 21° at maximum) and receding CAs (receding CA of 10.5° at maximum) with small hysteresis values, ranging from 5° to 10°.
Figure A7.
Contact angles as functions of contact point “X” position (hysteresis loops) for the Acuvue 2 lens immersed in OF at Day 0 (open circles) and Day 1 (solid triangles).
After overnight soaking in OF, the advancing CA increased considerably and reached 71° at its maximum; however, it decreased to approximately 40° as the aqueous phase advanced toward the lens center. The receding CA remained low, 6.5 ± 0.8°. The surface tension was reduced to 54 mN/m after the fifth cycle.
A summary of the CA and surface tension measurements for all lenses studied is shown in Table 2.
Footnotes
Publisher's Disclaimer: This is a PDF file of an unedited manuscript that has been accepted for publication. As a service to our customers we are providing this early version of the manuscript. The manuscript will undergo copyediting, typesetting, and review of the resulting proof before it is published in its final citable form. Please note that during the production process errors may be discovered which could affect the content, and all legal disclaimers that apply to the journal pertain.
Commercial relationship interest: None
Supplemental Digital Content 1. Appendix describing wettability thermodynamics, bubble and lens holders and experimental procedures. PDF.
REFERENCES
- 1.Wong H, Fatt II, Radke CJ. Deposition and thinning of the human tear film. J Colloid Interface Sci. 1996;184:44–51. doi: 10.1006/jcis.1996.0595. [DOI] [PubMed] [Google Scholar]
- 2.Korb DR, Baron DF, Herman JP, Finnemore VM, Exford JM, Hermosa JL, Leahy CD, Glonek T, Greiner JV. Tear film lipid layer thickness as a function of blinking. Cornea. 1994;13:354–359. doi: 10.1097/00003226-199407000-00012. [DOI] [PubMed] [Google Scholar]
- 3.Korb DR, Greiner JV. Increase in tear film lipid layer thickness following treatment of meibomian gland dysfunction. Adv Exp Med Biol. 1994;350:293–298. doi: 10.1007/978-1-4615-2417-5_50. [DOI] [PubMed] [Google Scholar]
- 4.Korb DR, Greiner JV, Glonek T, Esbah R, Finnemore VM, Whalen AC. Effect of periocular humidity on the tear film lipid layer. Cornea. 1996;15:129–134. doi: 10.1097/00003226-199603000-00004. [DOI] [PubMed] [Google Scholar]
- 5.Pult H, Murphy PJ, Purslow C. A novel method to predict the dry eye symptoms in new contact lens wearers. Optom Vis Sci. 2009;86:1042–1050. doi: 10.1097/OPX.0b013e3181b598cd. [DOI] [PubMed] [Google Scholar]
- 6.Holly FJ, Lemp MA. Wettability and wetting of corneal epithelium. Exp Eye Res. 1971;11:239–250. doi: 10.1016/s0014-4835(71)80028-3. [DOI] [PubMed] [Google Scholar]
- 7.Tiffany JM. Measurement of wettability of the corneal epithelium. II. Contact angle method. Acta Ophthalmol (Copenh) 1990;68:182–187. doi: 10.1111/j.1755-3768.1990.tb01901.x. [DOI] [PubMed] [Google Scholar]
- 8.Shanker RM, Ahmed I, Bourassa PA, Carola KV. An in-vitro technique for measuring contact angles on the corneal surface and its application to evaluate corneal wetting properties of water soluble polymers. Int J Pharmac. 1995;119:149–163. [Google Scholar]
- 9.Holly FJ, Refojo MF. Wettability of hydrogels. I. Poly (2-hydroxyethyl methacrylate) J Biomed Mater Res. 1975;9:315–326. doi: 10.1002/jbm.820090307. [DOI] [PubMed] [Google Scholar]
- 10.Sarver M, Bowman L, Bauman F, DiMartino R, Lau D, Umeda W. Wettability of some gas-permiable hard contact lenses. Intern. Contact Lens Clin. 1984;11(8):479–490. [Google Scholar]
- 11.Fatt I. Prentice Medal lecture: contact lens wettability—myths, mysteries, and realities. Am J Optom Physiol Opt. 1984;61:419–430. [PubMed] [Google Scholar]
- 12.Guillon M, Guillon JP. Hydrogel lens wettability during overnight wear. Ophthalmic Physiol Opt. 1989;9:355–359. [PubMed] [Google Scholar]
- 13.Guillon JP, Guillon M, Dwyer S, Mapstone V. Hydrogel lens in vivo wettability. Trans Brit Contact Lens Assoc Conf. 1989;6:44–45. [Google Scholar]
- 14.Zhang J, Herskowitz R. Is there more than one angle to the wetting characteristics of contact lenses? Contact Lens Spectrum. 1992;7(10):26–32. [Google Scholar]
- 15.de Gennes PG. Wetting: statics and dynamics. Rev Mod Phys. 1985;57(3):827–863. [Google Scholar]
- 16.Ketelson HA, Meadows DL, Stone RP. Dynamic wettability properties of a soft contact lens hydrogel. Colloids Surf (B) Biointerfaces. 2005;40:1–9. doi: 10.1016/j.colsurfb.2004.07.010. [DOI] [PubMed] [Google Scholar]
- 17.Tonge S, Jones L, Goodall S, Tighe B. The ex vivo wettability of soft contact lenses. Curr Eye Res. 2001;23:51–59. doi: 10.1076/ceyr.23.1.51.5418. [DOI] [PubMed] [Google Scholar]
- 18.Maldonado-Codina C, Morgan PB. In vitro water wettability of silicone hydrogel contact lenses determined using the sessile drop and captive bubble techniques. J Biomed Mater Res (A) 2007;83:496–502. doi: 10.1002/jbm.a.31260. [DOI] [PubMed] [Google Scholar]
- 19.Svitova T, Theodoly O, Christiano S, Hill RM, Radke CJ. Wetting behavior of silicone oils on solid substrates immersed in aqueous electrolyte solutions. Langmuir. 2002;18:6821–6829. [Google Scholar]
- 20.Cheng L, Muller SJ, Radke CJ. Wettability of silicone-hydrogel contact lenses in the presence of tear-film components. Curr Eye Res. 2004;28:93–108. doi: 10.1076/ceyr.28.2.93.26231. [DOI] [PubMed] [Google Scholar]
- 21.Adamson AW, Gast AP. Physical Chemistry of Surfaces. 6th ed. New York: Wiley; 1997. [Google Scholar]
- 22.Svitova TF, Weatherbee MJ, Radke CJ. Dynamics of surfactant sorption at the air/water interface: continuous-flow tensiometry. J Colloid Interf Sci. 2003;261:170–179. doi: 10.1016/s0021-9797(02)00241-2. [DOI] [PubMed] [Google Scholar]
- 23.Svitova TF, Radke CJ. AOT and Pluronic F68 coadsorption at fluid/fluid interface: a continuous flow tensiometry study. Industr Eng Chem Res. 2005;44:1129–1138. [Google Scholar]
- 24.Blake TD. Dynamic contact angles and wetting kinetics. In: Berg JC, editor. Wettability. New York: M. Dekker; 1993. pp. 253–309. [Google Scholar]
- 25.Tanner LH. The spreading of silicone oil drops on horizontal surfaces. J Phys D Appl Phys. 1979;12:1473–1485. [Google Scholar]
- 26.Tavana H, Neumann AW. On the question of rate-dependence of contact angles. Coll Surf A Physicochem Eng Aspects. 2005;282:256–262. [Google Scholar]
- 27.Chen Q, Zhang D, Somorjai G, Bertozzi CR. Probing the surface structural rearrangement of hydrogels by sum-frequency generation spectroscopy. J Am Chem Soc. 1999;121:446–447. [Google Scholar]
- 28.Copley KA, Zhang Y, Radke CJ. Wettability of SCLs assessed in a model blink-cycle cell. Invest Ophthalmol Vis Sci. 2006;47 E-Abstract 2407. [Google Scholar]
- 29.Lin M, Copley KA, Radke CJ. Assessment of pre-lens tear-film stability by slit-lamp examination, placido ring reflection, IBUT, and advancing contacting angles: do they correlate? Invest Ophthalmol Vis Sci. 2006;47 E-Abstract 95. [Google Scholar]
- 30.Copley KA, Wu C, Chen L, Radke CJ. Polymeric-surfactant adsorption onto and absorption into soft contact lenses. Invest Ophthalmol Vis Sci. 2007;48 E-Abstract 5415. [Google Scholar]
- 31.Santos L, Rodrigues D, Lira M, Real Oliveira ME, Oliveira R, Vilar EY, Azeredo J. Bacterial adhesion to worn silicone hydrogel contact lenses. Optom Vis Sci. 2008;85:520–525. doi: 10.1097/OPX.0b013e31817c92f3. [DOI] [PubMed] [Google Scholar]
- 32.Lorentz H, Rogers R, Jones L. The impact of lipid on contact angle wettability. Optom Vis Sci. 2007;84:946–953. doi: 10.1097/OPX.0b013e318157a6c1. [DOI] [PubMed] [Google Scholar]
- 33.Tiffany JM, Winter N, Bliss G. Tear film stability and tear surface tension. Curr Eye Res. 1989;8:507–515. doi: 10.3109/02713688909000031. [DOI] [PubMed] [Google Scholar]
- 34.Nagyova B, Tiffany JM. Components responsible for the surface tension of human tears. Curr Eye Res. 1999;19:4–11. doi: 10.1076/ceyr.19.1.4.5341. [DOI] [PubMed] [Google Scholar]
- 35.Lin MC, Svitova T. Comfort and tear film stability during soft contact lens wear: is lens surface wettability an overrated factor? Invest Ophthalmol Vis Sc. 2009;50 E-Abstract 6342. [Google Scholar]


