

Abstract
Little is known about the relationship between diet and metabolic health in Latino children, a population at increased risk for diabetes. The present study evaluates diet composition and the metabolic syndrome in a cross-sectional sample of 109 overweight Latino children aged 10 to 17 years with a family history of type 2 diabetes. Dietary intake was assessed by two 24-hour recalls. Associations between nutrients and features of the metabolic syndrome were examined using multiple linear regression and analysis of covariance. Log cholesterol intake was positively associated with log systolic blood pressure (β=0.034, P=0.017) and log soluble dietary fiber intake was inversely associated with log waist circumference (β=−0.069, P=0.036). Log soluble fiber intake was significantly higher in participants with 0 features compared to those with 3+ features of the metabolic syndrome (P=0.046), which translates to 5.2 g vs 4.1 g soluble fiber daily. No other significant associations were found between dietary variables and either the individual features of the metabolic syndrome or the clustering of metabolic syndrome components. Increases in soluble fiber through the daily consumption of fruits, vegetables, and beans may improve metabolic health in Latino children.
The Third National Health and Nutrition Examination Survey data showed that 29% of overweight adolescents aged 12 to 19 years and 4% of all US adolescents have the metabolic syndrome, a clustering of risk factors for diabetes and cardiovascular disease (1). The metabolic syndrome is most common in Mexican-American adolescents (5.6%), followed by whites (4.8%) and African Americans (2.0%) (1), making the examination of risk factors particularly warranted in Latino populations.
Studies have identified high intake of total fat and added sugar and low intake of fiber as risk factors for the metabolic syndrome in adults (2,3), but research in youth is limited. In a study of 154 white girls, sweetened beverages were the only dietary component related to the metabolic syndrome (4). A study of 12,441 Korean youth showed that those who ate a more “Western” diet had higher waist circumferences, although they were not more likely to have the metabolic syndrome (5). The present study investigates the associations between dietary intake and prevalence of risk factors for the metabolic syndrome in a sample of overweight Latino children with a family history of diabetes.
METHODS
Subjects
Participants represent a subset of the University of Southern California Study of Latino Adolescents at Risk for Diabetes Project, a longitudinal cohort study aimed to track the incidence of type 2 diabetes in Latino children who were ages 8 to 13 years at baseline in 2001 through 2003. Detailed methods for the longitudinal study have been published previously (6–8). The present, cross-sectional study includes 113 participants for whom dietary and clinical data for the five features of the metabolic syndrome were collected in 2005 through 2006. None of the participants were diabetic. This study was approved by the university Institutional Review Board. Written informed consent was obtained from parents and youth assent from participants.
Protocol
Body mass index (BMI; calculated as kg/m2) and BMI percentiles for age were determined based upon established Centers for Disease Control and Prevention normative curves (9). Sitting blood pressure was measured in triplicate using the right arm after the participant rested for 5 minutes (10). Waist circumference was measured at the umbilicus and recorded to the nearest 0.1 cm. Body composition was measured by whole-body dual-energy x-ray absorptiometry. Tanner stage was assessed by a licensed pediatric health care provider (11). Fasting blood samples were measured for triglycerides and high-density lipoprotein (HDL) cholesterol. Impaired glucose tolerance was defined as a 2-hour postchallenge plasma glucose value of at least 140 and <200 mg/dL (≥7.77 and <11.1 mmol/L) (12).
Definition of the Metabolic Syndrome
The validity of the use of the metabolic syndrome as a clinical measure is still debated and no standard definition exists for children and adolescents. For the current analysis, the metabolic syndrome was categorized using a definition we have proposed previously (6), which applies pediatric cutoffs to the Adult Treatment Panel III definition (13). To classify as having the metabolic syndrome, participants had to have three or more of the following: abdominal obesity (waist circumference ≥90th percentile for age, sex, and Hispanic ethnicity from Third National Health and Nutrition Examination Survey data) (14), hypertriglyceridemia (triglycerides ≥90th percentile of age and sex) (15), low HDL cholesterol (HDL cholesterol ≤10th percentile for age and sex) (15), elevated blood pressure (systolic or diastolic blood pressure >90th percentile adjusted for height, age, and sex) (10), and impaired glucose tolerance, as described here.
Dietary Intake
Dietary intake was assessed with two 24-hour recalls from each participant using the multiple-pass technique, which has been validated against the doubly labeled water method in children (16). One recall was administered in person by a bilingual dietary technician with the use of three-dimensional food models, and the second recall was administered via an unscheduled phone call by the same technician in the following week. Nutrition data were analyzed using the Nutrition Data System for Research (version 5.0_35), a software program developed by the University of Minnesota, and all entries were checked for accuracy by a second technician. This study focuses on macronutrients and does not investigate micronutrients or dietary patterns. The Nutrition Data System program defines added sugars as sugars/syrups added to foods during preparation or processing, such as high fructose corn syrup, but not including naturally occurring sugars like lactose and fructose.
During the collection of the 24-hour recalls, when a participant’s intake seemed excessively low or high, the technician asked if he or she considered the day’s intake to be usual. When a participant indicated that the day’s intake was not usual, the recall was not included in the analysis. Of 113 participants, three were excluded from the sample because both days of intake were said to not be usual. Of the remaining 110 participants, 21 commented that 1 day of intake was not usual. This left 89 participants with two recalls and 21 with one recall. There were no statistically significant differences in clinical characteristics, dietary characteristics, or metabolic syndrome status between participants with one vs two recalls. Subsequently, the dietary data were examined for plausibility of caloric intake by assessing the residuals of the linear regression of caloric intake and body weight. One participant was excluded due to a residual that was >3 standard deviations from the mean, leaving 109 participants in the sample.
Statistical Analyses
For the preliminary analyses, participants were dichotomized into those with and those without the metabolic syndrome. Independent t tests or Wilcoxon rank sum tests were used to compare clinical and dietary variables between the two groups, and a χ2 test was performed to compare sex distributions. Effect sizes of trends were calculated by (μΔ)/(SDpooled), where μΔ is the difference in the two means and SDpooled is the pooled standard deviation.
Relationships between nutrients and the separate features of the metabolic syndrome were assessed with simple Pearson correlations, and significant correlations were further explored with multiple linear regression. Variables that were not normally distributed were log-transformed for the multiple regression analyses. To examine differences in dietary intake across the number of features of the metabolic syndrome, analysis of covariance (ANCOVA) was used with a Tukey adjustment for multiple comparisons.
In the multiple regression and ANCOVA models, sex, age, Tanner stage, and total energy intake were added as covariates. In addition to energy intake, noncarbohydrate macronutrient intake (grams of protein and fat) was controlled for in the fiber models and nonfat macronutrient intake (grams of carbohydrate and protein) and body composition were controlled for in the dietary cholesterol models. Data were analyzed with SAS (version 9.1, 2003, SAS Institute, Cary, NC) and type 1 error was set at P<0.05.
RESULTS AND DISCUSSION
The most prevalent components of the metabolic syndrome were low HDL cholesterol (52%) and high waist circumference (48%), and the prevalence of the metabolic syndrome was 22%.
Clinical and dietary characteristics by metabolic syndrome status are shown in the Table. The metabolic syndrome was more prevalent in males than females (29% vs 13%; P=0.042). Participants with the metabolic syndrome were significantly younger (13.7 vs 14.5 years, P=0.040) and less sexually mature (Tanner stage 3.2 vs 3.8, P=0.032). Participants with the metabolic syndrome had a higher BMI (33.0 vs 30.7; P=0.010) and more fat mass (33.9 vs 27.1 kg; P=0.004). There were no statistically significant differences in dietary intake between those with and those without the metabolic syndrome. However, there was a trend toward significance for those who did not have the metabolic syndrome to eat more grams of total fiber per 1,000 calories (P=0.096). This trend showed a small effect size of 0.3 (17).
Table.
Clinical and dietary data of overweight Latino children (n=109) with and without the metabolic syndromea
| Children without the metabolic syndrome (n=85) | Children with the metabolic syndrome (n=24) | P value | |
|---|---|---|---|
| Sex (male/female) | 44/41 | 18/6 | 0.042 |
| ←mean±standard deviation→ | |||
| Age (y) | 14.5±1.8 | 13.7±1.4 | 0.040 |
| Tanner stage | 3.8±1.2 | 3.2±1.3 | 0.032 |
| Weight (kg) | 81.5±20.4 | 90.9±17.8 | 0.044 |
| BMIb | 30.7±6.2 | 33.0±4.5 | 0.010 |
| Total fat mass (kg) (n=103)c | 27.1±10.5 | 33.9±7.7 | 0.004 |
| Waist circumference (cm) | 90.8±13.2 | 98.1±7.8 | 0.002 |
| Systolic blood pressure (mm Hg) | 112.6±8.4 | 122.8±9.8 | <0.0001 |
| Diastolic blood pressure (mm Hg) | 63.8±5.5 | 66.9±7.7 | 0.080 |
| HDLd cholesterol (mg/dL) | 38.6±8.1 | 32.4±4.7 | 0.0002 |
| Triglycerides (mg/dL) | 92.9±41.8 | 147.5±68.0 | 0.0001 |
| 2-hour glucose (mg/dL) | 117.8±20.6 | 131.0±20.9 | 0.007 |
| Energy (kcal) | 1,776.6±513.9 | 1,839.9±566.3 | 0.735 |
| Protein (% of kcal) | 16.2±4.2 | 15.5±3.5 | 0.423 |
| Total dietary fat (% of kcal) | 31.8±5.5 | 32.6±7.4 | 0.563 |
| Saturated fat (% of kcal) | 11.0±2.4 | 11.2±2.7 | 0.798 |
| Polyunsaturated fat (% of kcal) | 6.6±2.2 | 6.5±2.0 | 0.927 |
| Cholesterol (% of kcal) | 0.11±0.07 | 0.14±0.11 | 0.318 |
| Carbohydrate (% of kcal) | 53.2±6.7 | 53.1±8.4 | 0.909 |
| Added sugar (% of kcal) | 15.0±7.4 | 16.2±7.7 | 0.491 |
| Total dietary fiber per 1,000 kcal | 8.4±3.1 | 7.5±2.8 | 0.096 |
| Soluble fiber per 1,000 kcal | 2.6±0.9 | 2.3±0.7 | 0.118 |
| Insoluble fiber per 1,000 kcal | 5.7±2.4 | 5.1±2.3 | 0.187 |
The five features of the metabolic syndrome are waist circumference, systolic or diastolic blood pressure, high-density lipoprotein cholesterol, triglycerides, and 2-hour glucose. Independent t tests used to compare means. Wilcoxon rank sum test used for variables that were not normally distributed but mean±standard deviation are presented for ease of interpretation. χ2 test ran for sex.
BMI=body mass index; calculated as kg/m2.
Six participants were unable to complete dual-energy x-ray absorptiometry scan due to upper weight limit.
HDL=high-density lipoprotein.
There were significant inverse Pearson correlations between the three measures of dietary fiber (total, soluble, and insoluble) and waist circumference (r=−0.21 to −0.27, P<0.05). There was also a positive correlation between dietary cholesterol and systolic blood pressure (r=0.22, P=0.022). None of the other features of the metabolic syndrome were correlated with any of the dietary variables. Multiple linear regression confirmed that log dietary cholesterol was positively associated with log systolic blood pressure (β=0.034, P=0.017). This is equivalent to a 0.020-mm Hg increase in systolic blood pressure for a 1 SD increase in cholesterol intake (129.68 mg). Multiple regression models of fiber intake and waist circumference revealed a trend toward significance for an inverse association with total dietary fiber (β=−0.060, P=0.071), a nonsignificant association with insoluble fiber (β=−0.047, P=0.109), and a significant inverse association with soluble dietary fiber (β=−0.069, P=0.036). In the soluble fiber model, each standard deviation increase in soluble fiber (1.91 g) equates to a 0.022-cm decrease in waist circumference. Although the coefficients for dietary cholesterol and soluble fiber are small, they are nonetheless significant, perhaps considering how many factors contribute to blood pressure and to waist circumference.
Using ANCOVA, dietary variables were examined across participants grouped by number of features of the metabolic syndrome. Log cholesterol intake did not differ between groups (P=0.105 for comparison between 0 and 3+ features). However, log soluble fiber intake was significantly higher in those with 0 features as compared to those with 3+ features after controlling for covariates P=0.046). The untransformed values amount to a 1.1 g difference in soluble fiber intake between groups; those with 3+ features ate 5.2 g per day as compared to those with 0 features who ate 4.1 g per day (Figure). No significant differences were found in ANCOVA models examining the other dietary variables, listed in the Table (energy, protein, total fat, saturated fat, polyunsaturated fat, carbohydrate, added sugar, total dietary fiber, or insoluble fiber).
Figure.
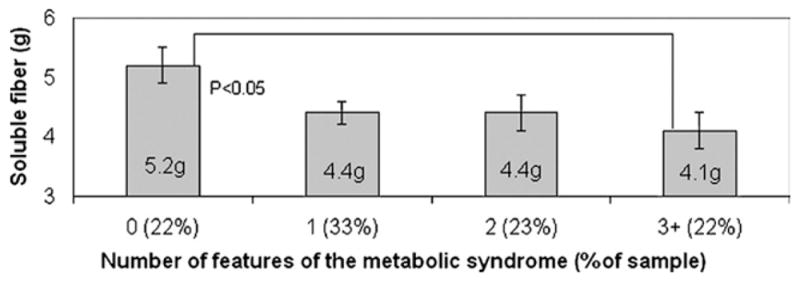
Mean soluble fiber intake by number of features of the metabolic syndrome. Analysis of covariance (ANCOVA) is adjusted for age, sex, Tanner stage, noncarbohydrate macronutrient intake, and energy intake.
To our knowledge, this study is the first to show an association between soluble fiber and the metabolic syndrome in children. Results from studies in adults also link low fiber intake with the metabolic syndrome (18,19). Studies in youth and young adults have found relationships between fiber intake and individual components of metabolic risk. Ludwig and colleagues (20) found that fiber consumption was a better predictor of fasting and 2-hour insulin levels and waist-to-hip ratio than total or saturated fat consumption in young adults. Steffen and colleagues (21) showed that increased dietary fiber from whole grains was associated with lower body mass and greater insulin sensitivity among adolescents. However, few studies isolate the effects of soluble fiber, which can decrease adiposity by delaying gastric emptying and promoting satiety (22,23).
Boys in the United States, aged 12 to 15 years, eat 15 g fiber per day, and girls of the same age eat 13 g per day, whereas the Adequate Intake reference values for boys and girls are 31 g and 26 g, respectively (24,25). Participants in the present study without the metabolic syndrome ate 14.8 g fiber per day and those with the metabolic syndrome ate 13.6 g. This equates to 8.2 g fiber per 1,000 calories, which is only 58% of the Institute of Medicine’s recommendation of 14 g fiber per 1,000 calories (26).
Participants with zero features of the metabolic syndrome ate 27% more soluble fiber than those who had the metabolic syndrome. This represents a relatively small, yet substantial difference of only 1.1 g/day, or the equivalent of one apple or one serving of beans. The five most common sources of 1 g or more of soluble fiber consumed by this cohort were: whole fresh fruit (orange, apple, mango, and pear), beans (boiled and refried), potatoes (including french fries), bread products, and chocolate milk (carageenan stabilizers are added to chocolate milk and add 1.45 g soluble fiber per 8 fluid ounces). Considering that not all of these are considered healthful foods, the quantity and frequency of consumption as well as the combination of different sources of soluble fiber can be important.
There are several limitations that should be considered regarding this study. The small sample size limits statistical power and can hinder the ability to detect associations between diet and the metabolic syndrome. In addition, the cross-sectional nature of the study prevents conclusions about causality. There might be a cohort effect, as participants had been retained in the study for 3 to 6 years. Potential contributors to measurement error include the age of participants, the use of 24-hour recalls, the availability of only one recall for 21 subjects, and the focus on macronutrients as opposed to dietary patterns. Finally, overweight participants can be especially prone to underreporting dietary data (27). The impact of measurement error would be to attenuate the observed relationships and to contribute to weak or null findings.
CONCLUSIONS
The only dietary variable that was associated with the overall metabolic syndrome in this cohort of overweight Hispanic children was soluble fiber. Dietary interventions aimed at increasing soluble fiber, by including one extra serving of fruit, vegetables, or legumes daily, could reduce central adiposity and improve metabolic health in Latino adolescents. Therefore, a targeted, positive message focusing on adding soluble fiber to the daily diet is suggested.
Acknowledgments
This work is supported by National Institute of Diabetes and Digestive and Kidney Diseases grant 3R01DK59211, General Clinical Research Center for Health Resources grant MO1 RR 00043, and National Cancer Institute grant U54 CA116848.
We would like to thank study coordinators Christina Ayala, MPH, and Quintilia Avila, MPA, and the SOLAR team for the facilitation of the study visits as well as the nursing staff at the General Clinical Research Center. In addition, we are grateful for Lourdes Acosta, who assisted with data collection and entry. Finally, we are grateful for our study participants and their families for their involvement.
References
- 1.Cook S, Weitzman M, Auinger P, Nguyen M, Dietz WH. Prevalence of a metabolic syndrome phenotype in adolescents: Findings from the third National Health and Nutrition Examination Survey, 1988–1994. Arch Pediatr Adolesc Med. 2003;157:821–827. doi: 10.1001/archpedi.157.8.821. [DOI] [PubMed] [Google Scholar]
- 2.Sonnenberg L, Pencina M, Kimokoti R, Quatromoni P, Nam BH, D’Agostino R, Meigs JB, Ordovas J, Cobain M, Millen B. Dietary patterns and the metabolic syndrome in obese and non-obese Framingham women. Obes Res. 2005;13:153–162. doi: 10.1038/oby.2005.20. [DOI] [PubMed] [Google Scholar]
- 3.Wirfalt E, Hedblad B, Gullberg B, Mattisson I, Andren C, Rosander U, Janzon L, Berglund G. Food patterns and components of the metabolic syndrome in men and women: A cross-sectional study within the Malmo Diet and Cancer cohort. Am J Epidemiol. 2001;154:1150–1159. doi: 10.1093/aje/154.12.1150. [DOI] [PubMed] [Google Scholar]
- 4.Ventura AK, Loken E, Birch LL. Risk profiles for metabolic syndrome in a nonclinical sample of adolescent girls. Pediatrics. 2006;118:2434–2442. doi: 10.1542/peds.2006-1527. [DOI] [PMC free article] [PubMed] [Google Scholar]
- 5.Kim JA, Kim SM, Lee JS, Oh HJ, Han JH, Song Y, Joung H, Park HS. Dietary patterns and the metabolic syndrome in Korean adolescents: 2001 Korean National Health and Nutrition Survey. Diabetes Care. 2007;30:1904–1905. doi: 10.2337/dc06-2591. [DOI] [PubMed] [Google Scholar]
- 6.Cruz ML, Weigensberg MJ, Huang TT, Ball G, Shaibi GQ, Goran MI. The metabolic syndrome in overweight Hispanic youth and the role of insulin sensitivity. J Clin Endocrinol Metab. 2004;89:108–113. doi: 10.1210/jc.2003-031188. [DOI] [PubMed] [Google Scholar]
- 7.Goran M, Bergman R, Avilla Q, Watkins M, Ball G, Shaibi G, Weigensberg M, Cruz M. Impaired glucose tolerance and reduced beta-cell function in overweight Latino children with a positive family history of type 2 diabetes. J Clin Endocrinol Metab. 2004;89:207–212. doi: 10.1210/jc.2003-031402. [DOI] [PubMed] [Google Scholar]
- 8.Weigensberg MJ, Ball GD, Shaibi GQ, Cruz ML, Goran MI. Decreased beta-cell function in overweight Latino children with impaired fasting glucose. Diabetes Care. 2005;28:2519–2524. doi: 10.2337/diacare.28.10.2519. [DOI] [PubMed] [Google Scholar]
- 9.Centers for Disease Control and Prevention. . CDC Growth Charts. Atlanta, GA: US Department of Health and Human Services, Centers for Disease Control and Prevention, National Center for Health Statistics; 2000. (US publ. no. 314). [Google Scholar]
- 10.The fourth report on the diagnosis, evaluation, and treatment of high blood pressure in children and adolescents. Pediatrics. 2004;114(suppl 4th rep):555–576. [PubMed] [Google Scholar]
- 11.Tanner JM. Growth and maturation during adolescence. Nutr Rev. 1981;39:43–55. doi: 10.1111/j.1753-4887.1981.tb06734.x. [DOI] [PubMed] [Google Scholar]
- 12.American Diabetes Association. Clinical practice recommendations 2002. Diabetes Care. 2002;25(suppl 1):S1–S147. doi: 10.2337/diacare.25.2007.s1. [DOI] [PubMed] [Google Scholar]
- 13.Executive Summary of The Third Report of The National Cholesterol Education Program (NCEP) Expert Panel on Detection, Evaluation And Treatment of High Blood Cholesterol In Adults (Adult Treatment Panel III) JAMA. 2001;285:2486–2497. doi: 10.1001/jama.285.19.2486. [DOI] [PubMed] [Google Scholar]
- 14.Fernandez JR, Redden DT, Pietrobelli A, Allison DB. Waist circumference percentiles in nationally representative samples of African-American, European-American, and Mexican-American children and adolescents. J Pediatr. 2004;145:439–444. doi: 10.1016/j.jpeds.2004.06.044. [DOI] [PubMed] [Google Scholar]
- 15.Hickman TB, Briefel RR, Carroll MD, Rifkind BM, Cleeman JI, Maurer KR, Johnson CL. Distributions and trends of serum lipid levels among United States children and adolescents ages 4–19 years: Data from the Third National Health and Nutrition Examination Survey. Prev Med. 1998;27:879–890. doi: 10.1006/pmed.1998.0376. [DOI] [PubMed] [Google Scholar]
- 16.Johnson RK, Driscoll P, Goran MI. Comparison of multiple-pass 24-hour recall estimates of energy intake with total energy expenditure determined by the doubly labeled water method in young children. J Am Diet Assoc. 1996;96:1140–1144. doi: 10.1016/S0002-8223(96)00293-3. [DOI] [PubMed] [Google Scholar]
- 17.Cohen J. Statistical Power Analysis for the Behavioral Sciences. New York, NY: Academic Press; 1977. Rev. [Google Scholar]
- 18.Millen BE, Pencina MJ, Kimokoti RW, Zhu L, Meigs JB, Ordovas JM, D’Agostino RB. Nutritional risk and the metabolic syndrome in women: Opportunities for preventive intervention from the Framingham Nutrition Study. Am J Clin Nutr. 2006;84:434–441. doi: 10.1093/ajcn/84.1.434. [DOI] [PubMed] [Google Scholar]
- 19.McKeown NM, Meigs JB, Lui S, Saltzman E, Wilson PWF, Jacques PF. Carbohydrate nutrition, insulin resistance, and the prevalence of the metabolic syndrome in the Framingham Offspring Cohort. Diabetes Care. 2004;27:538–546. doi: 10.2337/diacare.27.2.538. [DOI] [PubMed] [Google Scholar]
- 20.Ludwig D, Pereira M, Kroenke C, Hilner J, Van Horn L, Slattery M, Jacobs D. Dietary fiber, weight gain, and cardiovascular disease risk factors in young adults. JAMA. 1999;282:1539–1546. doi: 10.1001/jama.282.16.1539. [DOI] [PubMed] [Google Scholar]
- 21.Steffen L, Jacobs D, Stevens J, Shahar E, Carithers T, Folsom A. Associations of whole-grain, refined grain, and fruit and vegetable consumption with risks of all-cause mortality and incident coronary artery disease and ischemic stroke: The Atherosclerosis Risk in Communities (ARIC) Study. Am J Clin Nutr. 2003;78:383–390. doi: 10.1093/ajcn/78.3.383. [DOI] [PubMed] [Google Scholar]
- 22.Anderson JW, Hanna TJ. Impact of nondigestible carbohydrates on serum lipoproteins and risk for cardiovascular disease. J Nutr. 1999;129(suppl):1457S–1466S. doi: 10.1093/jn/129.7.1457S. [DOI] [PubMed] [Google Scholar]
- 23.Slavin JL. Dietary fiber and body weight. Nutrition. 2005;21:411–418. doi: 10.1016/j.nut.2004.08.018. [DOI] [PubMed] [Google Scholar]
- 24.Alaimo KMM, Briefel RR, Bischof AM, Caughman CR, Loria CM, Johnson CL. Advance Data from Vital and Health Statistics. Hyattsville, MD: National Center for Health Statistics; 1994. Dietary intake of vitamins, minerals, and fiber of persons ages 2 months and over in the United States: Third National Health and Nutrition Examination Survey, Phase 1, 1988–91. [PubMed] [Google Scholar]
- 25.Dietary Reference Intakes for Energy, Carbohydrate, Fiber, Fat, Fatty Acids, Cholesterol, Protein and Amino Acids. Washington, DC: Institute of Medicine of the National Academies; 2003. [DOI] [PubMed] [Google Scholar]
- 26.Institute of Medicine, Food and Nutrition Board. Dietary Reference Intakes for Energy, Carbohydrates, Fiber, Fat, Fatty Acid, Cholesterol, Protein, Amino Acids. Washington, DC: The National Academies Press; 2002. [Google Scholar]
- 27.Huang TT, Howarth NC, Lin BH, Roberts SB, McCrory MA. Energy intake and meal portions: Associations with BMI percentile in U.S. children. Obes Res. 2004;12:1875–1885. doi: 10.1038/oby.2004.233. [DOI] [PubMed] [Google Scholar]