

Abstract
Epidermal cells adhere to the basement membrane zone through cell–matrix junctions termed hemidesmosomes. During wound healing, hemidesmosomes are disassembled to allow keratinocytes to move over wound sites. Such movement is mediated by both hemidesmosome protein complexes (HPCs) and focal contacts (FCs). In this study, we analyzed the interaction between HPCs and FCs in live HaCat cells expressing yellow fluorescent protein (YFP)-tagged β4 integrin and cyan fluorescent protein (CFP)-tagged α-actinin as markers of HPCs and FCs, respectively. In HaCat cells migrating to repopulate wounds, FC proteins cluster rapidly in the direction of the wound. HPC assembly then follows and the newly formed HPCs occupy sites vacated by the disassembled FCs. HPC dynamics are dramatically reduced, and HaCat cells cease migration upon treatment with reagents that affect FC integrity/function. Upon treatment with reagents that destabilize HPCs, the dynamics of FCs in HaCat cells at the edges of wounds are enhanced, although FC assembly is irregular and the migration of the cells is aberrant. We also show that the complex interaction between hemidesmosomes and FCs in keratinocytes is myosin dependent and requires energy. In summary, we suggest that HPCs and FCs dynamics are tightly co-regulated in keratinocytes undergoing migration during wound healing.
INTRODUCTION
Cell–extracellular matrix interaction at the site of the basement membrane zone is crucial for the maintenance of epidermal–dermal integrity. In keratinocytes (KCs), this interaction is known to be facilitated mainly by cell–matrix junctions termed hemidesmosomes, composed of α6α4 integrin, CD151, plectin, the bullous pemphigoid proteins BP180 and BP230, and lamnin-332 (Jones et al., 1998). Within each hemidesmosome, α6β4 integrin mediates stable anchorage to the underlying matrix through binding to laminin-332. α6β4 integrin differs from other integrins in two major aspects (Jones et al., 1998). First, although other integrins connect to actin filaments, α6β4 integrin interacts with keratin intermediate filaments. Second, the intracellular domain of β4 integrin is much longer than all other β subunits (Jones et al., 1998).
In intact tissue, hemidesmosomes have been likened to spot welds (Tsuruta et al., 2003). Most cultured cells fail to assemble bona fide hemidesmosomes in vitro but keratinocytes possess hemidesmosome-enriched protein complexes (HPCs) that one group has termed stable anchoring complexes (Carter et al., 1990). Both hemidesmosomes and HPCs (or stable anchoring complexes) show dynamic properties during healing wound, cell division, and chemical reagent treatment (Tsuruta et al., 2003). Indeed, it has already been shown that HPCs, enriched in β4 integrin and BP180, are dynamic structures; they are assembled and disassembled in the plane of the membrane in a relatively short time frame and also move in the plane of membrane (Geuijen and Sonnenberg, 2002).
Hemidesmosomes have major roles in the attachment of KCs to the basement membrane zone in vivo (Edlund et al., 2001). In addition, components of focal contacts (FCs) expressed by KCs in intact tissue also have roles in adhesion (Nguyen et al., 2000). In vitro, KCs assemble FCs that tether actin filaments to the cell surface (Yamada and Geiger, 1997). The major integrins found in the FCs of KCs are α3β1 and α2β1 integrin whose ligands are laminin-332 and collagen I, respectively (Fleischmajer et al., 1998). FCs are considered to be “dynamic” attachment devices, because they move comparatively fast in the plane of the membrane in vitro (Zlatanov et al., 2005). Tsuruta et al. (2002) found that such movements of FCs depend on acto-myosin-dependent systems. Moreover, FCs are considered to exert an effect as a biochemical signaling hubs to concentrate and direct numerous signals after integrin binding and clustering (Zamir and Geiger, 2001).
α6β4 Integrin, a major molecular component of hemidesmosomes, and α3β1 integrin, a major component of FCs in KCs, share the same ligand, namely laminin-332. This supports the notion that HPCs and FCs show complex interactions. Thus, we sought to analyze the molecular basis of the interplay between FCs and HPCs in KCs using live cell imaging techniques. There are a number of candidate molecules that could mediate such interplay. Plectin is an obvious candidate as it has binding sites for both F-actin and keratin intermediate filament (Geerts et al., 1999; Litjens et al., 2006). The tetraspanin CD151 may also have a role as it interacts with, and regulates the activity of, both α6β4 and α3β1 integrin (Penas et al., 2000; Sterk et al., 2000; Winterwood et al., 2006). In this study, we followed the fate of yellow fluorescent protein (EYFP)-tagged β4 integrin and enhanced cyan fluorescent protein (ECFP)-tagged α-actinin by using time-lapse video microscopy in KCs in non-migrating cells, motile cells, and under conditions in which the expression and/or activities of various hemidesmosome-and FC-associated proteins have been modulated.
RESULTS
HPCs and FCs are dynamic in subconfluent HaCat cells, and show interaction at the leading edge of migrating HaCat cells
HPCs and FCs were visualized after their incorporation of YFP-β4 integrin (pseudo-colored in red) and CFP-α-actinin (pseudo-colored in green), respectively. First, we followed YFP-β4 integrin and CFP-α-actinin dynamics in 10 HaCat cells in subconfluent cultures for 100 minutes (Edlund et al., 2001; Geuijen and Sonnenberg, 2002; Tsuruta et al., 2003). In such cells at time zero, YFP-β4 integrin is organized in a bow at the substratum-attached surface of the cells, toward the cell margin but mostly behind individual and groups of FCs, rich in CFP-α-actinin, distributed at the ruffling edge of cellular protrusions (Figure 1). However, in some instances, YFP-β4 integrin-rich HPCs are contained within groupings of FCs (Figure 1). During the subsequent 100 minutes, assembly and disassembly of both HPCs and FCs is observed (Figure 1) (see Supplementary Movie S1 online).
Figure 1. The dynamics of hemidesmosome protein complexes (HPCs) and focal contacts (FCs) in live subconfluent HaCat cells.

HPCs were visualized using yellow fluorescent protein (YFP)-β4 integrin (pseudo-colored in red), and FC protein components were visualized using cyan fluorescent protein (CFP)-α-actinin (pseudo-colored in green). The dynamics of these tagged proteins were observed using confocal microscopy. Images of cells in subconfluent culture were captured over 100 minutes, and images at five different time points are presented. α-Actinin-rich FCs disassemble (dotted triangle in upper left-hand panel) and assemble (dotted circle in second upper panel from the left) during the observation period. β4 Integrin-rich HPCs disassemble (arrowhead in left-hand panel in second row) and assemble (arrow in second panel from the right, second row) during the observation period. Scale bar = 10 μm (Supplementary Movie S1).
Next, we followed the fate of HPCs and FCs in migrating cells covering a scratch wound in vitro (Figure 2). We observed HPC and FC proteins at the cells at the leading edge of the wound for approximately 110 minutes at 8 to 10 hours after the initial scratch wound. During this time period, FCs assemble rapidly and are enriched at the leading front of the wound at the cell edge in which lamellipodia and filopodia are formed (Figure 2a). HPCs are found immediately behind this area (Figure 2a). In addition, toward the center of the migrating cells, FCs and patches of HPCs appear to assemble and disassemble in no obvious pattern (Figure 2a) (Supplementary Movie S2). To analyze this phenomenon more precisely, confocal microscope images of migrating cells expressing YFP-β4 integrin and CFP-α-actinin were individually color coded and merged. This reveals that FCs appear to both assemble and move continuously forward at the leading front of the motile cell (Figure 2b). FCs undergo disassembly at the tail of the migrating cell. HPCs are either assembled or move immediately behind groupings of FCs at the leading front of the cell (Figure 2b). To summarize, as the cell moves over the wound site, FC proteins remain concentrated at the leading front with HPCs moving or assembling in concert with the advancing front of FCs. In other words, HPCs appear to assemble at and/or move into areas of cell-substratum interaction previously occupied by FCs.
Figure 2. The dynamics of hemidesmosome protein complexes and focal contacts at the leading edge of migrating HaCat cells.

(a) HPCs were pseudo-colored in red, and FC protein components were in green. A typical cell was viewed for 120 minutes, and images at five different time points are indicated. HaCat cells moved left to cover a scrape wound as indicated by the arrow. α-Actinin-rich FCs assemble at the leading front of the wound (box). Subsequently, β4 integrin-rich HPCs fill the “FC-rich” region (circle). Scale bar = 10 μm (Supplementary Movie S2). (b) Images at 0, 30, and 60 minutes in (a) were colorized (green, blue, and red, respectively) and merged. The direction of cell movement is to the left. Scale bar = 10 μm.
Under conditions in which HPC assembly is inhibited, the direction, velocity, and the size of FCs is perturbed at the leading edge of migrating HaCat cells
To analyze the possible interdependence of HPCs and FCs in migrating HaCat cells, we first treated the cells with an anti-α6 integrin function blocking antibody (GoH3) to induce HPC disassembly. We followed the fate of HPCs and FCs in cells at the leading edge of the wound at 8 to 9 hours after an initial scratch wound. After confirming that cells had begun to migrate into the wound, GoH3 was added to the culture medium and the fate of HPCs and FCs was then assessed. Between 40 and 60 minutes after addition of GoH3, HPCs disappear (Figure 3). At this stage, immunocytochemistry of anti-α6 integrin antibody revealed the disappearance of α6 integrin in HPCs (data not shown). In addition, GoH3 antibody induces cell rounding and FC proteins become concentrated in patches. Under these conditions, the direction of the migration in HaCat cells was incorrect and random (Figure 3a) (Supplementary Movie S3). After GoH3 treatment, some FCs remain as finger-like projections and these FCs show faster movement in the plane of the membrane (Figure 4). Similar results were observed in keratinocytes treated with either the anti-β4 integrin function blocking antibody 3E1 (data not shown) or bullous pemphigoid antigen 180-IgG (BP-IgG; data not shown).
Figure 3. The dynamics of hemidesmosome protein complexes (HPCs) and focal contacts (FCs) in live HaCat cells at the leading edge under conditions in which HPC assembly is inhibited.

(a) The dynamics of β4 integrin-rich hemidesmosome protein complexes (HPCs; red) and α-actinin focal contacts (FCs; green) in cells at the leading edge of HaCat migrating into a wound upon treatment with anti-α6 integrin function blocking antibody (GoH3: 10 mg ml−1). A typical cell was viewed for 60 minutes from the time the cell was exposed to GoH3, and images at four different time points are indicated. The cells were moving to the left as indicated by the arrow. The images at the left were obtained immediately before antibody administration. Scale bar = 10 μm (Supplementary Movie S3). (b) The dynamics of β4 integrin-rich HPCs (red) and α-actinin-rich FCs (green) in the leading edge of migrating HaCat cells under the condition in which the cells were transfected with red fluorescent protein (RFP) human keratin14 deletional mutant plasmid. A typical cell was viewed for 120 minutes, and images at five different time points are presented. The cells move to the left to cover a scrape wound as indicated by the arrow. The expression of β4 integrin was not detectable. Scale bar = 10 μm.
Figure 4. Analyses of the velocity of α-actinin-rich focal contacts (FCs) in HaCat cells under different conditions.
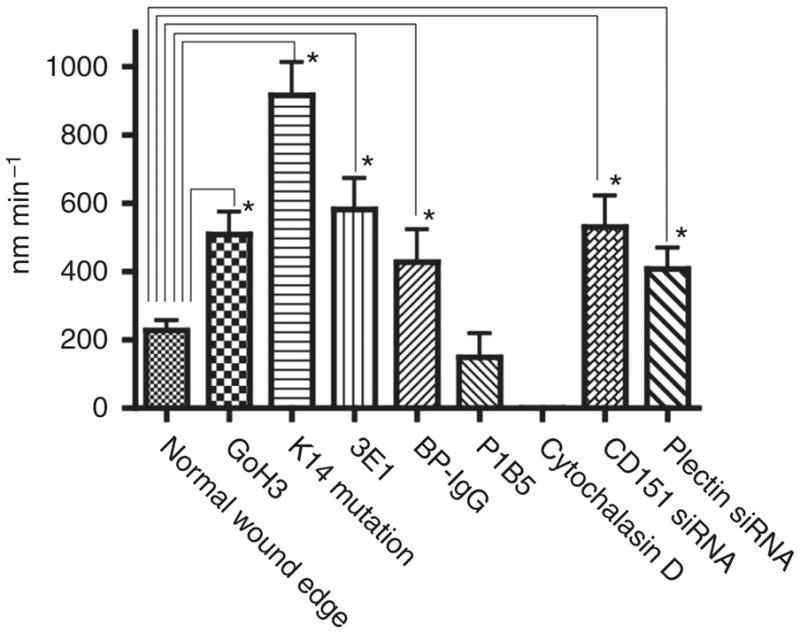
To calculate the velocity of individual FCs, the images at three time points were overlaid and visualized with different false colors using Adobe Photoshop 7.0. We measured the distance between the moving front of each FC over a period of 15 minutes, and the velocity was determined and expressed in nm min−1. Data shown are the average and SD, and an asterisk indicates a significant difference, P< 0.05; Student’s t-test.
Next, to perturb the keratin filament network, we transfected a keratin 14 deletional mutant plasmid into HaCat cells. Under these conditions, keratin filaments accumulate around the nucleus and no obvious HPCs are assembled by the transfected cells. After scratch wounding, the direction of the migration of the treated cells appears random (Albers and Fuchs, 1987, 1989) (Figure 3b). Consistent with this, the cells appear non-polarized, possess multiple lamellipoidia, and do not have a clear leading front. In addition, FCs are found toward the edges of each of the multiple lamellipodia. FCs also move faster in the plane of the membrane than do FCs in untreated HaCat cells (Figure 4). These results suggested that under conditions in which HPC assembly is inhibited, the direction, velocity, and the size of FCs was perturbed at the leading edge of migrating HaCat cells.
When FCs are perturbed, the size and assembly of HPCs is modulated in migrating HaCat cells
We followed the fate of HPCs and FCs at the cells at the leading edge of the wound for 60 minutes at 8 hours after scratch wounding. After confirming that cells had successfully begun to migrate into the wound sites, anti-α3 integrin function blocking (P1B5) antibody was added to the culture medium to perturb FC integrity. Under these conditions, the migration of HaCat cells is inhibited. We then followed the fate of both HPCs and FCs. After 100 minutes of incubation of cells with the α3 integrin-function inhibitory antibody, FCs movement is inhibited and HPCs appear stabilized (Figures 4 and 5a) (Supplementary Movie S4).
Figure 5. The dynamics of hemidesmosome protein complexes (HPCs) and focal contacts (FCs) in live HaCat cells at the leading edge under conditions in which FCs are perturbed.

(a) The dynamics of β4 integrin-rich hemidesmosome protein complexes (HPCs) and α-actinin-rich focal contacts (FCs) at the leading edge of migrating HaCat cells under the exposure of anti-α3 integrin function blocking antibody (P1B5: 10 μg ml−1). A typical cell was viewed for 60 minutes from the time the cell was exposed to P1B5, and images at four different time points are indicated. The cells moved to the left to cover a scrape wound as indicated by the arrow. The image labeled “before” shows cells immediately before antibody exposure (Supplementary Movie S4). (b) The dynamics of β4 integrin-rich HPCs and α-actinin-rich FCs at the leading edge of migrating HaCat cells after treatment with the actin filament severing drug cytochalasin D. A typical cell was viewed for 90 minutes from the time the cell was treated with cytochalasin D. The cells move toward the left to cover a scrape wound as indicated by the arrow. Cells at the left were imaged before antibody exposure. Scale bar = 10 μm (Supplementary Movie S5).
Next, to disrupt the microfilament network, we first determined the minimum concentration of cytochalasin D necessary to perturb the microfilaments arrays in HaCat cells. The organizational state of the microfilament system was evaluated by staining fixed, drug-treated cells with rhodamine-conjugated phalloidin (data not shown). The microfilament network appears collapsed in HaCat cells that have been incubated for approximately 5 minutes in medium supplemented with 200 nM cytochalasin D (data not shown). As above, we followed the fate of HPCs and FCs at the cells at the leading edge of the wound for 60 minutes at 8 hours subsequent to scratch wounding. After confirming that the migration of the cells was proceeding normally, cytochalasin D was added to the medium and the fate of HPCs and FCs was then followed. Under these conditions, polarity of the cells is lost and cell movement is inhibited. FC proteins reorganize into patches along the substratum-attached surface of the cell. HPCs are also reorganized and are found concentrated toward the center of the cell, localized in between the FC protein patches. In some instances, the HPCs appear in a more leopard spot pattern than in untreated cells, indicating the possibility that the treatment induces formation of a more mature HPC. In support of this, HPCs show less dynamic properties in the plane of the membrane (Figure 5b) (Supplementary Movie S5).
CD 151 knockdown affects HPC and FCs at the leading edge of migrating HaCat cells
CD151 is a putative regulator of both α6β4 integrin and α3β1 integrin (Penas et al., 2000; Winterwood et al., 2006; Sterk et al., 2000). To analyze the effect of CD151 on the interaction of HPCs and FCs, we first induced HaCat cells to express YFP-β4 integrin and CFP-α-actinin. After 24 hours, we next transfected the cells with CD151 small interfering RNA (siRNA), allowed the cells to reach confluence (approximately 48 hours), and then scratch wounded the culture. We first confirmed by immunoblotting that, under these conditions, CD151 levels were reduced to 63% of that detected in control cells (Figure 6a and b). Scrambled control siRNA did not affect CD151 protein levels under the same condition (data not shown).
Figure 6. HaCat cells were transfected with CD151 small interfering RNA (siRNA) oligonucleotides.

(a) Knockdown efficiency was evaluated using western blotting of untransfected and CD151 siRNA-transfected cell extracts with CD151 antibody using actin as a loading control. CD151 levels were reduced to 63% of the original amount. (b) Transfected cells were stained 80 hours after transfection with CD151 antibody (green). Scale bar = 10 μm. (c) The dynamics of β4 integrin-rich hemidesmosome protein complexes (HPCs) and α-actinin-rich focal contacts (FCs) at the leading edge of migrating HaCat cells transfected with CD151 siRNA were analyzed for 60 minutes, and images at five different time points are indicated. The cells were moving to the left to cover a scrape wound as indicated by the arrow. Scale bar = 10 μm (Supplementary Movie S6).
We next followed the fate of HPCs and FCs in the treated cells migrating to cover a scratch wound in vitro. Decrease in CD151 expression leads to an absence of HPCs. The velocity of FCs became faster and the migration of HaCat cells into scratch wounds is enhanced when CD151 expression is reduced (Figures 4 and 6c) (Supplementary Movie S6). HPCs and FCs in RNA interference scrambled negative control transfected cells showed the same dynamics as those in untreated HaCat cells (data not shown).
Plectin knockdown affects stable anchoring complexes and FCs at the leading edge of migrating HaCat cells
As plectin can associate with both keratin and actin and interacts with α6β4 integrin, we hypothesized that it might be an important regulator of the crosstalk between HPCs and FCs. To test this hypothesis, plectin siRNA was transfected into HaCat cells, following the strategy we used for CD151 knockdown (see above). Transfection of HaCat cells with a plectin siRNA resulted in an approximately 42% knockdown in plectin expression (Figure 7a and b). Scrambled control siRNA did not affect plectin protein levels under the same condition (data not shown).
Figure 7. HaCat cells were transfected with plectin small interfering RNA (siRNA) oligonucleotides.

(a) Knockdown efficiency was evaluated using western blotting of untransfected and plectin siRNA-transfected cell extracts using plectin antibody. α-Tubulin antibody labeling was used as a loading control. Plectin levels were reduced to 58% of the original amount. (b) Transfected cells were stained 86 hours after transfection with plectin (green). Scale bar = 10 μm. (c) The dynamics of β4 integrin-rich hemidesmosome protein complexes (HPCs) and α-actinin-rich focal contacts (FCs) at the leading edge of migrating HaCat cells transfected with plectin siRNA were analyzed for 60 minutes, and images at five different time points are shown. The cells moved to the left to cover a scrape wound as indicated by the arrow. Scale bar = 10 μm.
HPCs are barely detectable in KCs showing plectin knockdown. The velocity of FCs became faster and the migration of HaCat cells showing plectin knockdown is also enhanced compared with untreated control (Figures 4 and 7c). HPCs and FCs in cells transfected with scrambled control siRNA showed comparable dynamics to that in untreated HaCat cells (data not shown).
The interaction between HPCs and FCs depends on adenosine triphosphate and myosin
We next analyzed the energy requirements necessary for the interaction of HPCs and FCs. To deplete cellular stores of adenosine triphosphate, we changed DMEM supplemented with 10% fetal bovine serum (FBS) and penicillin to glucose-free DMEM supplemented with 10% FBS, 0.05% sodium azide, and 50 mM 2-deoxy-D-glucose (Tsuruta et al., 2002). Under these conditions HaCat cells fail to migrate. FCs at the leading front of the cells appear maintained, although there is an increase in FC formation behind the leading front. HPC dynamics are compromised (Figure 8a).
Figure 8. The dynamics of β4 integrin-rich hemidesmosome protein complexes (HPCs) and α-actinin-rich focal contacts (FCs) at the leading edge of migrating HaCat cells after treatment with 2-deoxy-D-glucose (2DDG) (a) or ML-7 (b).

A typical cell was viewed for 60 minutes and imaged at four different time points as indicated. The cells moved left to cover a scrape wound as indicated by the arrow. The image labeled “before” shows the cells before drug treatment. Scale bar = 10 μm.
Next, to analyze the influence of myosin on the interaction between HPCs and FCs, we treated the transfected HaCat cells with myosin light chain kinase inhibitor ML-7 (Tsuruta et al., 2002). Under these conditions, migration of HaCat cells is inhibited. After drug administration, FCs immediately disappear whereas HPCs are reduced in size (Figure 8b).
DISCUSSION
We have used live cell imaging to observe directly the dynamics of FCs and HPCs in HaCat cells undergoing migration to fill in a wound made in a confluent monolayer maintained in vitro. Our results indicate that: (1) FCs assemble and/or move rapidly and regularly in the direction of migration of HaCat cells, (2) in migrating HaCat cells, HPCs assemble and/or move just behind FCs at the leading front of the cells, and (3) drug, antibody blocking, and protein knockdown studies all indicate that the assembly and maintenance of FCs and HPCs is intricately connected.
Upon treatment with anti-α3 integrin antibodies and the actin filament depolymerizing drug, cytochalasin D, all of which destabilize FCs, the dynamics of HPCs are reduced, assembly of HPCs is perturbed, and HPCs become smaller. Taken together, these results suggest that FCs strongly influence HPC structure and function. Our data also indicate that HPCs influence FC function and structure. In HaCat cells that have been allowed to begin to migrate into wounds and were then treated with the α6 integrin blocking antibody GoH3 to induce HPC perturbation, FCs move more rapidly. Similarly, in HaCat cells showing keratin perturbation, or in which plectin or CD151 are knocked down, HPCs are absent or reduced in number and FCs move more rapidly. These results suggest that the movement of FCs is regulated by HPCs. There are a number of potential explanations for this. Under normal conditions, HPCs may inhibit FC movement sterically by taking up space along the cell substratum-attached surface of the migrating HaCat cells. Upon HPC loss, FCs may have more space in which to move. Alternatively, HPCs are generated behind groupings of FCs to which they are physically anchored in some way. In this model, HPCs, through their FC connection, would maintain the direction of cell movement and regulated the migration. In this occasion, actin filaments possibly have an important role in the interaction of FCs and HPDs, through plectin, because plectin has domains for binding to both intermediate filaments and microfilaments (Steinbock and Wiche, 1999).
The results that we detail under conditions in which CD151 expression is knocked down are consistent with those from Chometon et al. (2006) and Garcia-Lopez et al. (2005) who showed that CD151 increases the stability of HPCs in HaCat cells and who showed that CD151-siRNA-treated melanocytes show enhanced cell motility, respectively. However, our results are inconsistent with other studies. Specifically, Cowin et al. (2006) showed impairment of wound healing in CD151-deficient mice. In addition, CD151 silencing in A431 cells has also been reported to impair cell motility (Winterwood et al., 2006). These discrepancies may be explained by differences in the cell types used or, in the case of skin wound healing in CD151 knockout mice, it is possible that wound closure is impaired because of non-epithelial effects resulting from CD151 deficiency. Further study is required to reconcile these conflicting results.
Our data also suggest that the interplay of FCs and HPCs has an energy requirement and is dependent on myosin. This emphasizes the complexity of interactions between the cytoskeleton and substrate adhesion devices in keratinocytes and how these are central to both adhesion and regulation of cell migration. The ability to view this interplay in live cells opens up the possibility of detailed investigations of the relative dynamics of the distinct cytoskeleton and adhesive molecular entities present in keratinocytes.
MATERIALS AND METHODS
Cells and culture conditions
Human keratinocyte cells (HaCat cells kindly provided by Dr Nobert Fusenig) were cultured in DMEM (Invitrogen, Carlsbad, CA), supplemented with 10% FBS (Invitrogen) and 50 U ml−1 penicillin at 37 °C in a humidified atmosphere containing 5% CO2. The medical ethical committee of Osaka City University approved all described studies. The study was conducted according to the Declaration of Helsinki Principles.
Antibodies and lmmunofluorescent probes
Mouse mAb against green fluorescent protein (GFP; clone 7.1) was obtained from Roche (Roche Diagnostics, Tokyo, Japan). Function-blocking mouse mAb, α3 integrin (P1B5), was purchased from Chemicon (Temecula, CA). Function-blocking mouse mAb, β4 integrin (3E1), was purchased from Millipore (Bedford, MA). The rat mAb GoH3, a blocking antibody directed against the extra-cellular portion of the α6 integrin, and the mouse anti-CD151 were obtained from BD Biosciences (San Diego, CA). Goat polyclonal plectin antibody and mouse anti-goat IgG-horseradish peroxidase were purchased from Santa Cruz Biotechnology (Santa Cruz, CA). The mouse anti-α-tubulin mAbs and rabbit anti-mouse IgG-horse-radish peroxidase were purchased from Sigma-Aldrich (St Louis, MO). The characterization of bullous pemphigoid antigen 180 (BP180) IgG (BP-IgG) are described elsewhere (Iwata et al., 2009). Alexa Fluor 488 and Rhodamine-conjugated phalloidin were obtained from Invitrogen (Eugene, OR). The mouse anti-β-actin was purchased from Abcam (Cambridge, UK).
Immunofluorescence microscopy
Cells on glass coverslips were fixed in 3.7% formaldehyde in phosphate-buffered saline (PBS) for 8 minutes, washed thoroughly in PBS, and permeabilized in 0.1% (vol vol−1) Triton X-100 in PBS for 10 minutes. Primary antibodies were overlaid onto the cells, and the preparations were incubated at 37 °C for 1 hour. Cells on coverslips were washed in three changes of PBS and conjugated secondary antibody was applied for a further 1 hour. After washing three times with PBS, coverslips were mounted onto slides. All preparations were viewed on a TCS SP5 confocal microscope (Leica Microsystems, Mannheim, Germany). Microscope images were exported as TIF files, and figures were generated using Adobe Photoshop 7.0 (Adobe Systems, San Jose, CA).
Western blotting analyses
Cells were lysed in radioimmunoprecipitation assay buffer, incubated on ice for 5 minutes, and then scraped with a rubber policeman. The lysates were clarified by centrifugation at 13,000 × g for 5 minutes at 4 °C, and 20 μg samples were processed for SDS-PAGE on 4 or 12.5% gels (Bio-Rad, Marne la Coquette, France) and then transferred to Hybond-P polyvinylidene difluoride membrane (GE Healthcare Bio-Sciences, Little Chalfont, UK). Membranes were probed either overnight at 4 °C or for 1 hour at room temperature. Washed membranes were incubated for 1 hour in horseradish peroxidase-conjugated secondary antibody, and subsequently visualized with chemiluminescence SuperSignal West Dura Extended Duration Substrate (Pierce Chemical, Rockford, IL). Signals were acquired in a LAS 3000 DarkBox (Fuji Photo Film Europe GMBH, Düsseldorf, Germany).
Plasmid constructs
We substituted YFP for GFP in the GFP-β4 integrin cassette that was described previously (Tsuruta et al., 2003). In brief, the GFP-β4 integrin plasmid and PEYFP-N1 (CLONTECH Laboratories, Palo Alto, CA) were treated by restriction digestion with NheI and XhoI. After gel purification, the shorter fragment of the former and the longer fragment of the latter were ligated using a DNA Ligation kit (Takara Biomedical, Shiga, Japan). The construct was sequenced to ensure that the YFP-β4 integrin complementary DNA was in frame and did not contain mutations using an ABI Prism Automated sequencer (Applied Biosystems, Foster City, CA). CFP-α-actinin vector was kindly provided by Dr Carol Otey (University of North Carolina, NC, USA). To knock down expression of keratin 14, a red fluorescent protein-conjugated deletional plasmid was used as described previously (Albers and Fuchs, 1989).
YFP-β4 integrin and CFP-α-actinin transfection procedure
At 24 hours before transfection, the medium was changed to DMEM supplemented with 10% FBS without antibiotics. Transfections were performed using the lipofectamine 2000 reagent (Invitrogen) in OPTI-MEM + GlutaMAX (Gibco, Grand Island, NY, USA). After 6 hours, the medium was changed into DMEM supplemented with 10% FBS and antibiotics. At 48 hours after transfection, cells were seeded onto 35-mm glass coverslips. Finally, at 32 hours after seeding, cells were processed for live cell imaging.
Drug treatment
To induce disassembly of the microfilament network, cytochalasin D (Sigma Chemical) was added from a stock solution to the medium to a final concentration of 200 nM. The myosin light chain kinase inhibitor ML-7 (CN Biosciences, La Jolla, CA) was added to the medium to a final concentration of 100 μM. To deplete energy stores, cells were incubated in glucose-free DMEM (Gibco BRL, Rockville, MD) supplemented with 10% FBS, 0.05% sodium azide, and 50 mM 2-deoxy-D-glucose (Sigma).
RNA interference inhibition of CD151 and plectin expression
Stealth siRNAs against CD151 and plectin and an RNA interference scrambled negative control were obtained from Invitrogen (Boczonadi et al., 2007). These were transfected into HaCat cells as above.
Live cell imaging
Time-lapse microscopy was performed with a confocal laser scanning microscope type TCS SP5 (Leica Microsystems), equipped with thermostatic chamber type FCS2 Closed Chamber System (Bioptechs, Butler, PA). The latter was fitted to the microscope stage. The 60 mm round glass slides and the attached silicon chamber were placed inside. The temperature at the bottom of the sample was precisely adjusted to 37 °C by a calibrated thermocouple. Single cells were scanned every 5 minutes.
In vitro scrape wound assays
HaCat cells were grown to confluence on glass coverslips. Medium was aspirated, and the cell-coated surface was scraped with a pipette tip in a single stripe. The surface of the scrape wound was washed with PBS and incubated in trypsin at 37 °C for 30 seconds to remove debris from the wound area and wound edges. The cells were washed again twice with serum-containing medium to quench any residual trypsin. The wounds in the cultures were allowed to heal for various times and cells at the wound edges were observed.
Analyses of the velocity of focal contacts
Analyses of the movement of CFP-α–actinin containing FCs in transfected HaCat cells were performed using TCS SP5 confocal microscope. To calculate the velocity of each FC, images at three time points were colorized and then overlaid using Adobe Photoshop 7.0. We measured the distance moved over a 15-minute period. At least 20 FCs were analyzed in this way per treatment.
Statistics
To determine significance between two groups, comparisons were made using Student’s t-test using Prism 4.0 software (GraphPad Prism Program, GraphPad, San Diego, CA). For all statistical tests, a P-value of < 0.05 was accepted for significance.
Supplementary Material
Acknowledgments
This work was made possible in part by a grant from the National Institutes of Health (RO1 AR054184) to JCRJ.
Abbreviations
- CFP
cyan fluorescent protein
- FC
focal contact
- KC
keratinocyte
- YFP
yellow fluorescent protein
Footnotes
CONFLICT OF INTEREST
The authors state no conflict of interest.
Supplementary material is linked to the online version of the paper at http://www.nature.com/jid
References
- Albers K, Fuchs E. The expression of mutant epidermal keratin cDNAs transfected in simple epithelial and squamous cell carcinoma lines. J Cell Biol. 1987;105:791–806. doi: 10.1083/jcb.105.2.791. [DOI] [PMC free article] [PubMed] [Google Scholar]
- Albers K, Fuchs E. Expression of mutant keratin cDNAs in epithelial cells reveals possible mechanisms for initiation and assembly of intermediate filaments. J Cell Biol. 1989;108:1477–93. doi: 10.1083/jcb.108.4.1477. [DOI] [PMC free article] [PubMed] [Google Scholar]
- Boczonadi V, McInroy L, Määttä A. Cytolinker cross-talk: periplakin N-terminus interacts with plectin to regulate keratin organisation and epithelial migration. Exp Cell Res. 2007;313:3579–91. doi: 10.1016/j.yexcr.2007.07.005. [DOI] [PubMed] [Google Scholar]
- Carter WG, Wayner EA, Bouchard TS, et al. The role of integrins alpha 2 beta 1 and alpha 3 beta 1 in cell-cell and cell-substrate adhesion of human epidermal cells. J Cell Biol. 1990;110:1387–404. doi: 10.1083/jcb.110.4.1387. [DOI] [PMC free article] [PubMed] [Google Scholar]
- Chometon G, Zhang ZG, Rubinstein E, et al. Dissociation of the complex between CD151 and laminin-binding integrins permits migration of epithelial cells. Exp Cell Res. 2006;312:983–95. doi: 10.1016/j.yexcr.2005.12.034. [DOI] [PubMed] [Google Scholar]
- Cowin AJ, Adams D, Geary SM, et al. Wound healing is defective in mice lacking tetraspanin CD151. J Invest Dermatol. 2006;126:680–9. doi: 10.1038/sj.jid.5700142. [DOI] [PMC free article] [PubMed] [Google Scholar]
- Edlund M, Lotano MA, Otey CA. Dynamics of alpha-actinin in focal adhesions and stress fibers visualized with alpha-actinin-green fluorescent protein. Cell Motil Cytoskeleton. 2001;48:190–200. doi: 10.1002/1097-0169(200103)48:3<190::AID-CM1008>3.0.CO;2-C. [DOI] [PubMed] [Google Scholar]
- Fleischmajer R, Utani A, MacDonald ED, et al. Initiation of skin basement membrane formation at the epidermo-dermal interface involves assembly of laminins through binding to cell membrane receptors. J Cell Sci. 1998;111(Part 14):1929–40. doi: 10.1242/jcs.111.14.1929. [DOI] [PubMed] [Google Scholar]
- García-López MA, Barreiro O, Garcia-Diez A, et al. Role of tetraspanins CD9 and CD151 in primary melanocyte motility. J Invest Dermatol. 2005;125:1001–9. doi: 10.1111/j.0022-202X.2005.23882.x. [DOI] [PubMed] [Google Scholar]
- Geerts D, Fontao L, Nievers MG, et al. Binding of integrin alpha6beta4 to plectin prevents plectin association with F-actin but does not interfere with intermediate filament binding. J Cell Biol. 1999;147:417–34. doi: 10.1083/jcb.147.2.417. [DOI] [PMC free article] [PubMed] [Google Scholar]
- Geuijen CA, Sonnenberg A. Dynamics of the alpha6beta4 integrin in keratinocytes. Mol Biol Cell. 2002;13:3845–58. doi: 10.1091/mbc.02-01-0601. [DOI] [PMC free article] [PubMed] [Google Scholar]
- Iwata H, Kamio N, Aoyama Y, et al. IgG from patients with bullous pemphigoid depletes cultured keratinocytes of the 180-kDa bullous pemphigoid antigen (type XVII collagen) and weakens cell attachment. J Invest Dermatol. 2009;129:919–26. doi: 10.1038/jid.2008.305. [DOI] [PubMed] [Google Scholar]
- Jones JC, Hopkinson SB, Goldfinger LE. Structure and assembly of hemidesmosomes. Bioessays. 1998;20:488–94. doi: 10.1002/(SICI)1521-1878(199806)20:6<488::AID-BIES7>3.0.CO;2-I. [DOI] [PubMed] [Google Scholar]
- Litjens SH, de Pereda JM, Sonnenberg A. Current insights into the formation and breakdown of hemidesmosomes. Trends Cell Biol. 2006;16:376–83. doi: 10.1016/j.tcb.2006.05.004. [DOI] [PubMed] [Google Scholar]
- Nguyen BP, Gil SG, Carter WG. Deposition of laminin 5 by keratinocytes regulates integrin adhesion and signaling. J Biol Chem. 2000;275:31896–907. doi: 10.1074/jbc.M006379200. [DOI] [PubMed] [Google Scholar]
- Penas PF, García-Díez A, Sanchez-Madrid F, et al. Tetraspanins are localized at motility-related structures and involved in normal human keratinocyte wound healing migration. J Invest Dermatol. 2000;114:1126–35. doi: 10.1046/j.1523-1747.2000.00998.x. [DOI] [PubMed] [Google Scholar]
- Steinböck FA, Wiche G. Plectin: a cytolinker by design. J Biol Chem. 1999;380:151–8. doi: 10.1515/BC.1999.023. [DOI] [PubMed] [Google Scholar]
- Sterk LM, Geuijen CA, Oomen LC, et al. The tetraspan molecule CD151, a novel constituent of hemidesmosomes, associates with the integrin alpha6beta4 and may regulate the spatial organization of hemidesmosomes. J Cell Biol. 2000;149:969–82. doi: 10.1083/jcb.149.4.969. [DOI] [PMC free article] [PubMed] [Google Scholar]
- Tsuruta D, Gonzales M, Hopkinson SB, et al. Microfilament-dependent movement of the beta3 integrin subunit within focal contacts of endothelial cells. FASEB J. 2002;16:866–8. doi: 10.1096/fj.01-0878fje. [DOI] [PubMed] [Google Scholar]
- Tsuruta D, Hopkinson SB, Jones JC. Hemidesmosome protein dynamics in live epithelial cells. Cell Motil Cytoskeleton. 2003;54:122–34. doi: 10.1002/cm.10089. [DOI] [PubMed] [Google Scholar]
- Winterwood NE, Varzavand A, Meland MN, et al. A critical role for tetraspanin CD151 in alpha3beta1 and alpha6beta4 integrin-dependent tumor cell functions on laminin-5. Mol Biol Cell. 2006;17:2707–21. doi: 10.1091/mbc.E05-11-1042. [DOI] [PMC free article] [PubMed] [Google Scholar]
- Yamada KM, Geiger B. Molecular interactions in cell adhesion complexes. Curr Opin Cell Biol. 1997;9:76–85. doi: 10.1016/s0955-0674(97)80155-x. [DOI] [PubMed] [Google Scholar]
- Zamir E, Geiger B. Molecular complexity and dynamics of cell-matrix adhesions. J Cell Sci. 2001;114:3583–90. doi: 10.1242/jcs.114.20.3583. [DOI] [PubMed] [Google Scholar]
- Zlatanov I, Groth T, Lendlein A, et al. Dynamics of beta1-integrins in living fibroblasts–effect of substratum wettability. Biophys J. 2005;89:3555–62. doi: 10.1529/biophysj.105.061119. [DOI] [PMC free article] [PubMed] [Google Scholar]
Associated Data
This section collects any data citations, data availability statements, or supplementary materials included in this article.