Abstract
The absolute pKa values of 24 representative amine compounds, including cocaine, nicotine, 10 neurotransmitters, and 12 anilines, in aqueous solution were calculated by performing first-principles electronic structure calculations that account for the solvent effects using four different solvation models, i.e. the surface and volume polarization for electrostatic interaction (SVPE) model, the standard polarizable continuum model (PCM), the integral equation formalism for the polarizable continuum model (IEFPCM), and the conductor-like screening solvation model (COSMO). Within the examined computational methods, the calculations using the SVPE model lead to the absolute pKa values with the smallest root-mean-square-deviation (RMSD) value (1.18). When the SVPE model was replaced by the PCM, IEFPCM, and COSMO, the RMSD value of the calculated absolute pKa values became 3.21, 2.72, and 3.08, respectively. All types of calculated pKa values linearly correlate with the experimental pKa values very well. With the empirical corrections using the linear correlation relationships, the theoretical pKa values are much closer to the corresponding experimental data and the RMSD values become 0.51 to 0.83. The smallest RMSD value (0.51) is also associated with the SVPE model. All of the results suggest that the first-principles electronic structure calculations using the SVPE model are a reliable approach to the pKa prediction for the amine compounds.
Introduction
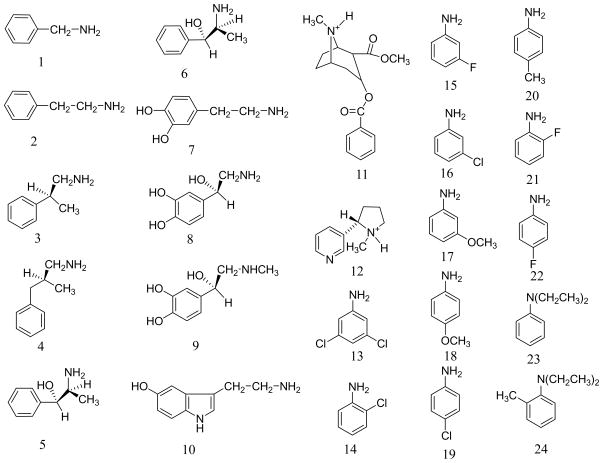
Amine compounds play a crucial role in numerous chemical and biological processes. Many biomolecules are amine compounds, e.g. neurotransmitters benzylamine (1), phenylethylamine (2), norephedrine (5), ephedrine (6), dopamine (7), norepinephrine (8), epinephrine (9), and serotonin (10) depicted in Figure 1. Cocaine (11) is also an amine compound and this widely abused drug can potently bind to various neuronal binding sites, including dopamine transporter (DAT), to block the neurotransmitter dopamine (7) reuptake. Cocaine is the most reinforcing of all drugs of abuse.1,2,3 The disastrous medical and social consequences of cocaine addiction have made the development of an anti-cocaine medication a high priority.4,5,6,7,8,9,10,11,12,13,14 The alkaloid nicotine (12), initially found in tobacco leaves, is the addictive amine compound that maintains tobacco smoking behavior.15,16,17 More than any other abused psychostimulant, nicotine addiction is the number one cause of preventable mortality and is responsible for over 4 million smoking-related deaths each year.18,19 Nicotine produces its effects on the central nervous system (CNS) by interacting with nicotinic acetylcholine receptors (nAChRs) that are essential for synaptic transmission. Neuronal nAChRs are members of a superfamily of ligand-gated ion channels, which modulate the function of many major neurotransmitter systems and thereby influence a broad range of brain functions, such as cognition, learning, and memory.19,20,21,22,23 A variety of agonists and antagonists of nAChRs have been reported in literature. Majority of the nAChR agonists and antagonists reported so far are also amine compounds.24,25 Many amine compounds that could be used as the nAChR agonists/antagonists are structural analogs of nicotine or cocaine. Selective nAChR agonists/antagonists have therapeutic potential in the treatment of Alzheimer’s disease, Parkinson’s disease, dyskinesias, Tourette’s syndrome, schizophrenia, attention deficit disorder, anxiety, and pain, as well as tobacco-use cessation agents.19,23,26,27,28,29,30,31,32,33
Figure 1.
Structures of 24 representative amine compounds
Each of these biologically important amine compounds has a protonable amine moiety and, therefore, has both the protonated and deprotonated molecular species in aqueous solution. It has been known that both the protonated and deprotonated molecular species could bind with a protein.34 Evaluation of the phenomenological binding of a protein with an amine compound should account for the microscopic binding of the protein with both the protonated and deprotonated molecular species. The phenomenological binding affinity is dependent on not only the microscopic binding affinities of the protonated and deprotonated molecular species, but also the pKa of the amine compound and the pH of the solution. Therefore, it is essential for determining the phenomenological binding affinity to reliably measure or predict pKa of the amine compounds.35
The pKa values of a wide variety of organic and inorganic compounds have been measured by different experimental methods,36,37 such as spectroscopy, potentiometry, conductimetry, and competitive reactions. Yet, the experimental pKa measurements of those classes of compounds always involve some artifice and approximations. A priori knowledge of pKa’s can be crucially important in situations such as those encountered in the development of biologically active molecules.37 Thus, it is of considerable interest to develop reliable computational protocols that can be used to calculate this property and complement the experimental techniques. In general, the computational modeling not only provides an alternative way38,39,40 to obtain pKa values beyond the experimental technical limitations, but also may help to better understand the relevant chemical/biological processes at molecular level.41–67 It is ambitious and difficult objective to accurately predict absolute pKa based on the first-principles electronic structure calculations. 68, 69 A particular challenge to the pKa prediction is the determination of the solvent effects in the first-principles electronic structure calculation. An additional challenge to the pKa prediction for the neurotransmitters and some other amine compounds is related to the different rotamers (see below) that coexist in solution.70
In order to identify a reliable first-principles approach to the pKa prediction for these types of biologically important amine compounds, we have performed various first-principles electronic structure calculations on both the protonated and deprotonated states of a series of representative amine compounds, including neurotransmitters, cocaine, nicotine, and anilines. In the first-principles electronic structure calculations, solvent effects on the Gibbs free energies and thus on the pKa values of the amine compounds in aqueous solution were accounted for by using four different solvation models. Comparison of various computational results with the corresponding experimental data allows us to identify the most promising computational approaches to the pKa prediction for the biologically important amine compounds.
Computational Methods
Theoretical model
For convenience, the protonated and deprotonated states of an amine compound are denoted by AH+ and A, respectively. We have the following dissociation process:
| (1) |
The equilibrium dissociation constant (Ka) for reaction (1) is determined by the corresponding change of the standard Gibbs free energy via
i.e.
| (2) |
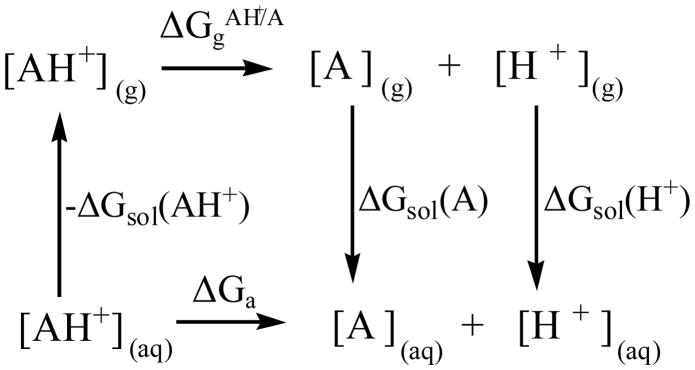
Depicted in Figure 2 is the thermodynamic cycle used to calculate the Gibbs free energy change (ΔGa) associated with reaction (1). According to this thermodynamic cycle, ΔGa is given by the following expression:
| (3) |
in which is the Gibbs free energy change corresponding to reaction (1) in the gas phase. ΔGsol(AH+), ΔGsol(A), and ΔGsol(H+) are the solvation free energies of the protonated state (AH+), the deprotonated state (A), and the proton (H+), respectively.
Figure 2.
Thermodynamic cycle used to calculate the Gibbs free energy change associated with reaction (1)
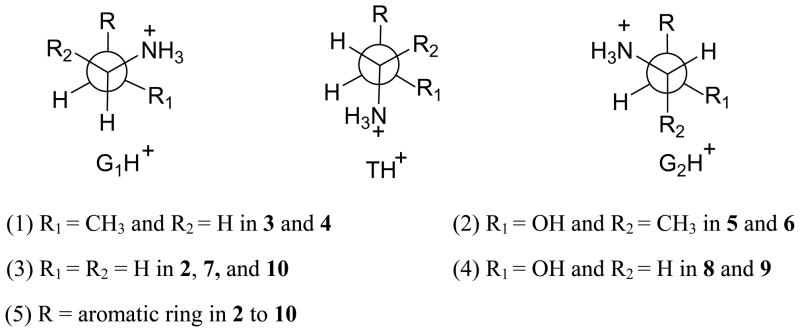
Specially, for each of the neurotransmitters (1 to 10), it has been known that about 95% of the molecular species in the equilibrium mixtures take mono-protonation state in aqueous solution. The first protonation occurs on the amine group of the side chain. For 2 to 10, each neurotransmitter mainly has three stable protonated conformations:71 one trans (TH+) and two gauche (G1H+ and G2H+) rotamers (see Figure 3). So we can presume that the concentration of AH+ (for 2 to 10) consists of all of the stable protonated rotamers in aqueous solution.
Figure 3.
The Newman projections of three staggered conformers about side chain Cα-Cβ bond connecting the amino group. The aromatic ring (R) is perpendicular to the Cα-Cβ axes.
The different rotamers of a neurotransmitter (2, 3, … or 10) have different microscopic dissociation constants (denoted by KTH, KG1H, and KG2H for rotamers TH+, G1H+, and G2H+, respectively) and different concentration ratios in solution:
| (4) |
| (5) |
| (6) |
| (7) |
| (8) |
| (9) |
| (10) |
| (11) |
In Eqs.(8) to (11), ηTH, ηG1H, and ηG2H refer to the fractions of the concentration for rotamers TH+, G1H+, and G2H+, respectively. In order to calculate the total, phenomenological pKa in comparison with available experimental data, we need to know not only microscopic Ka values (i.e. KTH, KG1H, and KG2H) for all of the stable rotamers, but also their fractions of the concentration. ηTH, ηG1H, and ηG2H will be determined by their relative Gibbs free energies in solution. A combined use of Eqs.(4) to (6) gives
| (12) |
Substitution of Eqs.(8) to (10) into Eq.(12) gives
| (13) |
The phenomenological Ka and pKa can be expressed as follows:
| (14) |
| (15) |
In Eq.(15), KTH, KG1H, and KG2H are the microscopic Ka of rotamers TH+, G1H+, and G2H+, respectively.
Computational details
Eq.(15) indicates that, to predict the phenomenological pKa of a neurotransmitter, we first need to determine the microscopic pKa for all of the rotamers and their concentration ratios. The microscopic pKa of all rotamers and their concentration ratios can be determined by using the calculated relative Gibbs free energies of all rotamers and their deprotonated structures in solution. The practical computational task becomes the calculations of Gibbs free energies of all relevant protonated and deprotonated structures of the amine compounds.
Geometries of all molecular species involved in this study were fully optimized by employing density functional theory (DFT) using Becke’s three-parameter hybrid exchange functional and the Lee-Yang-Parr correlation functional (B3LYP)72 with the 6-31+G* basis set.73 Harmonic vibrational frequencies were determined at the same B3LYP/6-31+G* level to confirm that the optimized structures were local minima on the potential energy surfaces and to evaluate the zero-point vibrational energy (ZPVE) and thermal corrections to the Gibbs free energy at T = 298.15 K. The geometries optimized at the B3LYP/6-31+G* level were used to carry out second-order Møller-Plesset (MP2) single-point energy calculations with the 6-311++G** basis set. All these electronic structure calculations in the gas phase were performed by using the Gaussian03 program.74
Four different self-consistent reaction field (SCRF)75 procedures were employed in the solvation calculations on the protonated and neutral states of amine compounds to evaluate their solvent shifts in aqueous solution. All of the solvation calculations were performed at the HF/6-31+G* level by using the geometries optimized at the B3LYP/6-31+G* level in the gas phase. The similar solvation protocol was used to successfully solve other interesting chemical and biological problems.76,77,78,79,80,81 The first SCRF procedure used in the present study is the recently developed surface and volume polarization for electrostatic interaction (SVPE) model 82 implemented in GAMESS program.83 The SVPE is also known as the fully polarizable continuum model (FPCM),76–81 because it fully accounts for both surface and volume polarization effects in the SCRF calculation. Since the solute cavity surface is defined as a solute electron charge isodensity contour determined self-consistently during the SVPE iteration process, the SVPE results (converged to the exact solution of the Poisson’s equation with a given numerical tolerance) depend only on the value of the contour for a given dielectric constant under a given quantum chemical calculation level.82a This single parameter value has been calibrated to be 0.001au.82b
The other three SCRF procedures employed in this study are the standard polarizable continuum model (PCM), 84 the integral equation formalism for the polarizable continuum model (IEFPCM), 85 and the conductor-like screening solvation model (COSMO)86 implemented in the Gaussian03 program. All PCM, IEFPCM, and COSMO calculations in this study were performed by using the default choices of the Gaussian03 program for the recommended standard parameters. The dielectric constant of solvent water used for all of the solvation calculations is 78.5.
The calculated total Gibbs free energy of a molecular species in aqueous solution was taken as the sum of the free energy calculated at the MP2/6-311++G**//B3LYP/6-31+G* (or at the B3LYP/6-31+G*//B3LYP/6-31+G* level) in the gas phase (including the thermal corrections to the Gibbs free energy at the B3LYP/6-31+G* level when T = 298.15 K and P = 1 atm) and the corresponding solvent shift determined by the SCRF calculation at the HF/6-31+G* level. Finally, prediction of the free energy change of reaction (1) also requires knowing the absolute solvation free energy of the proton (H+) in aqueous solution, ΔGsol298(H+), in addition to the free energies calculated for all of the molecular species mentioned above. Due to the inherent difficulty of measuring absolute solvation free energy of an ion, the reported “experimental” ΔGsol298(H+) values have a wide range from −252.6 to −264.1 kcal/mol.87 We recently calculated ΔGsol298(H+) by using a high-level, ab initio method of incorporating a hybrid supermolecule-continuum approach88,89,90,91 based on the same SVPE procedure used in the present study. ΔGsol298(H+) was predicted to be −262.4 kcal/mol88 which was used in the present study. The total Gibbs free energy of the proton is ΔGsol298(H+) plus the gas-phase free energy −6.3 kcal/mol (accounting for contributions from the proton translation to enthalpy and entropy) at 298.15 K.
The computers used to perform the calculations in this study are HP’s Superdome supercomputer (a shared-memory system with 256 processors) at University of Kentucky Center for Computational Sciences and IBM x335 34-processors Linux cluster and SGI multiprocessors Origin computers in our own lab.
Results and Discussion
Absolute pKa values determined by the first-principles calculations
Summarized in Tables 1 and 2 and depicted in Figures 4 to 7 are the pKa values determined by using the Gibbs free energies calculated with various methods, in comparison with the corresponding experimental data. The only difference between the results in Table 1 and those in Table 2 is the level of the gas phase energy calculations, i.e. MP2/6-311++G**//B3LYP/6-31+G* for Table 1 vs. B3LYP/6-31+G*//B3LYP/6-31+G* for Table 2. For the calculated pKa values in a same table, different columns refer to the different solvation models used to determine the solvent shifts of the Gibbs free energies (from the gas phase to the solution). Given in the tables are also values of the root-mean-square-deviation (RMSD) of the calculated absolute pKa values from the corresponding experimental data.
Table 1.
The calculated pKa values of amine compounds in aqueous solution (based on the MP2/6-311++G**//B3LYP/6-31+G* energies) compared with the experimental dataa
| Amine compound | Calc.g | Expt. | |||
|---|---|---|---|---|---|
| COSMO | PCM | IEFPCM | SVPE | ||
| 1 | 7.46(8.64) | 8.64(9.55) | 8.41(8.92) | 11.27(9.83) | 9.43b |
| 2 | 10.73(10.60) | 10.64(10.77) | 11.56(10.79) | 11.69(10.14) | 9.85b |
| 3 | 7.43(8.63) | 7.22(8.68) | 8.14(8.76) | 10.62(9.35) | 9.96b |
| 4 | 8.52(9.28) | 9.26(9.93) | 10.81(10.35) | 11.50(10.00) | 10.21b |
| 5 | 7.24(8.51) | 7.02(8.56) | 7.73(8.51) | 10.05(8.93) | 9.11b |
| 6 | 10.61(10.53) | 7.12(8.62) | 9.54(9.59) | 9.78(8.73) | 9.64b |
| 7 | 7.91(8.91) | 8.32(9.35) | 8.11(8.74) | 11.28(9.84) | 8.96c |
| 8 | 7.77(8.83) | 7.41(8.80) | 8.50(8.97) | 10.91(9.56) | 8.79c |
| 9 | 9.67(9.97) | 9.49(10.07) | 10.28(10.03) | 11.12(9.72) | 9.59c |
| 10 | 6.87(8.29) | 6.74(8.39) | 7.47(8.36) | 11.47(9.97) | 10.20c |
| 11 | 8.20(9.09) | 8.17(9.26) | 8.17(8.78) | 9.17(8.29) | 8.60d |
| 12 | 6.97(8.35) | 6.87(8.47) | 6.87(8.00) | 8.20(7.57) | 8.00e |
| 13 | −1.33(3.39) | −1.33(3.45) | −1.13(3.24) | 2.30(3.24) | 2.37f |
| 14 | −1.30(3.41) | −1.59(3.29) | −0.81(3.43) | 1.55(2.69) | 2.64f |
| 15 | −0.48(3.90) | −0.47(3.98) | 0.00(3.91) | 2.80(3.61) | 3.58f |
| 16 | −0.68(3.78) | −0.74(3.81) | −0.26(3.76) | 3.16(3.87) | 3.52f |
| 17 | 0.75(4.63) | 0.82(4.77) | 1.24(4.65) | 4.53(4.88) | 4.20f |
| 18 | 0.95(4.75) | 0.91(4.82) | 1.36(4.72) | 4.78(5.06) | 5.36f |
| 19 | −0.90(3.65) | −1.01(3.65) | −0.50(3.61) | 3.56(4.16) | 3.99f |
| 20 | −0.16(4.09) | −0.30(4.08) | 0.31(4.09) | 4.36(4.76) | 5.08f |
| 21 | −2.34(2.79) | −2.26(2.88) | −1.88(2.79) | 1.89(2.94) | 3.20f |
| 22 | 1.44(5.04) | 1.32(5.07) | 1.99(5.09) | 3.78(4.32) | 4.65f |
| 23 | 7.47(8.65) | 6.73(8.38) | 7.93(8.63) | 7.92(7.37) | 6.56f |
| 24 | 4.66(6.97) | 2.90(6.04) | 5.07(6.93) | 5.85(5.85) | 7.18f |
| RMSD | 3.08(0.85) | 3.21(0.83) | 2.72(0.78) | 1.18(0.56) | |
The total Gibbs free energy of a molecular species is the gas phase energy calculated at the MP2/6-311++G**//B3LYP/6-31+G* level with the thermal corrections to the Gibbs free energy at the B3LYP/6-31+G* level plus the solvent shift calculated with a solvation model (SVPE, PCM, IEFPCM, or COSMO) at the HF/6-31+G* level.
The experimental data come from ref.71c.
The experimental data come from ref.71d.
The experimental value comes from ref.92.
The experimental values comes from ref.93.
The experimental data come from ref.94.
The pKa/RMSD values in the parentheses refer to the theoretical results with the empirical corrections using the linear correlation relationships.
Table 2.
The calculated pKa values of amine compounds in aqueous solution (based on the B3LYP/6-31+G*//B3LYP/6-31+G* energies) compared with the experimental dataa
| Amine compound | Calc.g | Expt. | |||
|---|---|---|---|---|---|
| COSMO | PCM | IEFPCM | SVPE | ||
| 1 | 7.38(8.96) | 8.55(9.80) | 8.32(9.33) | 11.18(10.16) | 9.43b |
| 2 | 8.95(9.87) | 8.87(9.99) | 9.78(10.20) | 10.37(9.59) | 9.85b |
| 3 | 6.72(8.57) | 6.53(8.61) | 7.44(8.80) | 9.91 (9.27) | 9.96b |
| 4 | 8.96(9.88) | 8.17(9.58) | 9.78(10.20) | 10.50(9.68) | 10.21b |
| 5 | 7.16(8.83) | 6.78(8.76) | 7.67(8.94) | 10.28(9.53) | 9.11b |
| 6 | 10.21(10.61) | 6.71(8.72) | 9.13(9.81) | 9.58 (9.03) | 9.64b |
| 7 | 7.25 (8.88) | 7.72(9.31) | 7.45(8.81) | 10.66(9.79) | 8.96c |
| 8 | 8.31(9.50) | 9.45(10.33) | 8.28(9.30) | 10.51(9.69) | 8.79c |
| 9 | 8.94(9.87) | 8.75(9.92) | 9.55(10.06) | 10.45(9.64) | 9.59c |
| 10 | 5.94(8.12) | 5.78(8.17) | 6.54(8.27) | 10.54(9.71) | 10.20c |
| 11 | 8.04(9.34) | 8.01(9.48) | 8.01(9.14) | 9.00(8.63) | 8.60d |
| 12 | 6.66(8.54) | 6.57(8.64) | 6.57(8.29) | 7.90(7.85) | 8.00e |
| 13 | −2.88(2.97) | −2.88(3.08) | −2.68(2.79) | 0.74(2.83) | 2.37f |
| 14 | −2.53(3.18) | −2.83(3.11) | −2.05(3.16) | 0.32(2.53) | 2.64f |
| 15 | −1.54(3.75) | −1.53(3.87) | −1.06(3.75) | 1.73(3.52) | 3.58f |
| 16 | −1.85(3.57) | −1.90(3.66) | −1.43(3.53) | 1.99(3.70) | 3.52f |
| 17 | −0.05(4.62) | 0.01(4.78) | 0.43(4.64) | 3.73(4.93) | 4.20f |
| 18 | 1.01 (5.24) | 0.97(5.34) | 1.42(5.22) | 4.84(5.71) | 5.36f |
| 19 | −2.08(3.44) | −2.19(3.48) | −1.69(3.38) | 2.37(3.97) | 3.99f |
| 20 | −0.49(4.36) | −0.63(4.40) | −0.03(4.36) | 4.03(5.14) | 5.08f |
| 21 | −2.87(2.98) | −2.80(3.13) | −2.41(2.94) | 1.35(3.26) | 3.20f |
| 22 | 0.70(5.06) | 0.59(5.12) | 1.26(5.13) | 3.04(4.45) | 4.65f |
| 23 | 4.91(7.51) | 4.17(7.23) | 5.37(7.57) | 5.36(6.07) | 6.56f |
| 24 | 4.07(7.03) | 2.30(6.13) | 4.48(7.05) | 5.26(6.00) | 7.18f |
| RMSD | 3.67(0.70) | 3.88(0.79) | 3.30(0.61) | 1.30(0.51) | |
The total Gibbs free energy of a molecular species is the gas phase energy calculated at the B3LYP/6-31+G*//B3LYP/6-31+G* level with the thermal corrections to the Gibbs free energy at the B3LYP/6-31+G* level plus the solvent shift calculated with a solvation model (SVPE, PCM, IEFPCM, or COSMO) at the HF/6-31+G* level.
The experimental data come from ref.71c.
The experimental data come from ref.71d.
The experimental value comes from ref.92.
The experimental values comes from ref.93.
The experimental data come from ref.94.
The pKa/RMSD values in the parentheses refer to the theoretical results with the empirical corrections using the linear correlation relationships.
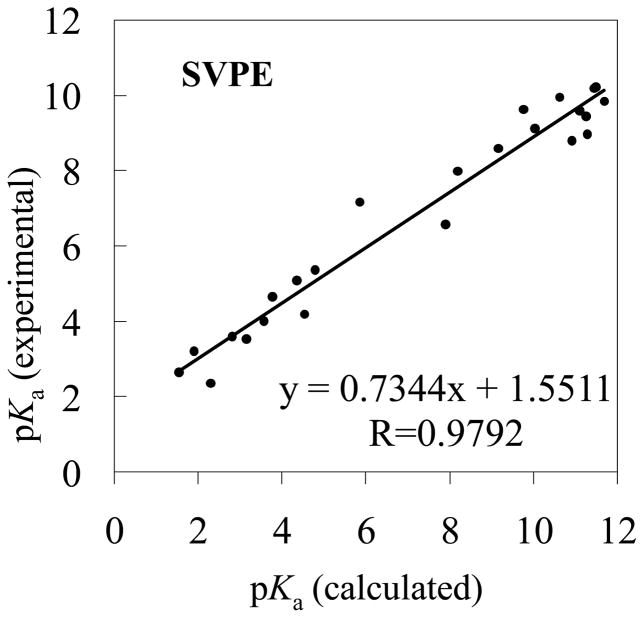
Figure 4.
The experimental pKa values versus the theoretical pKa values determined by using the MP2/6-311++G**//B3LYP/6-31+G* energies and the solvent shifts calculated with the SVPE model
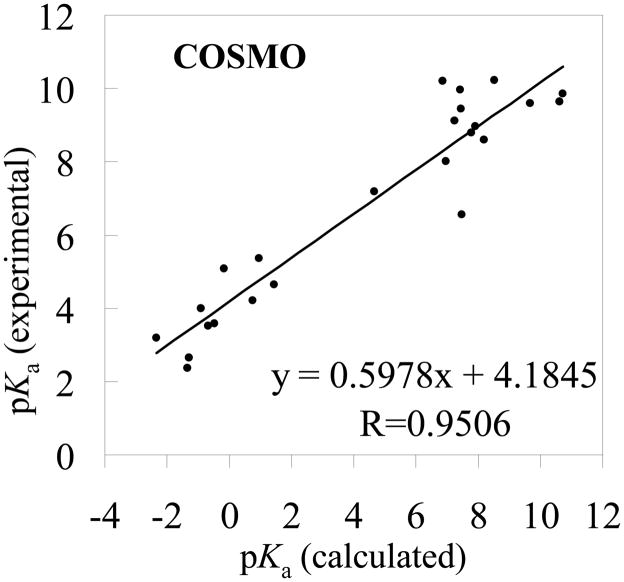
Figure 7.
The experimental pKa values versus the theoretical pKa values determined by using the MP2/6-311++G**//B3LYP/6-31+G* energies and the solvent shifts calculated with the COSMO model
The RMSD values in the tables reveal that the pKa values calculated using the MP2/6-311++G**//B3LYP/6-31+G* energies are slightly better than those using the corresponding B3LYP/6-31+G*//B3LYP/6-31+G* energies. Based on the MP2/6-311++G**//B3LYP/6-31+G* energies, when the SVPE, PCM, IEFPCM, and COSMO models were used, the RMSD values are 1.18, 3.21, 2.72, and 3.08, respectively. The respective RMSD values become 1.30, 3.88, 3.30, and 3.67 when the MP2/6-311++G**//B3LYP/6-31+G* energies are replaced by the corresponding B3LYP/6-31+G*//B3LYP/6-31+G* energies. Further, no matter whether the MP2/6-311++G**//B3LYP/6-31+G* or B3LYP/6-31+G*//B3LYP/6-31+G* energies are used, the qualitative order of the RMSD values is the same, i.e. RMSD(SVPE) < RMSD(IEFPCM) < RMSD(COSMO) < RMSD(PCM). The smallest RMSD value is always associated with the SVPE model.
Linear correlation relationship between the calculated and experimental pKa values
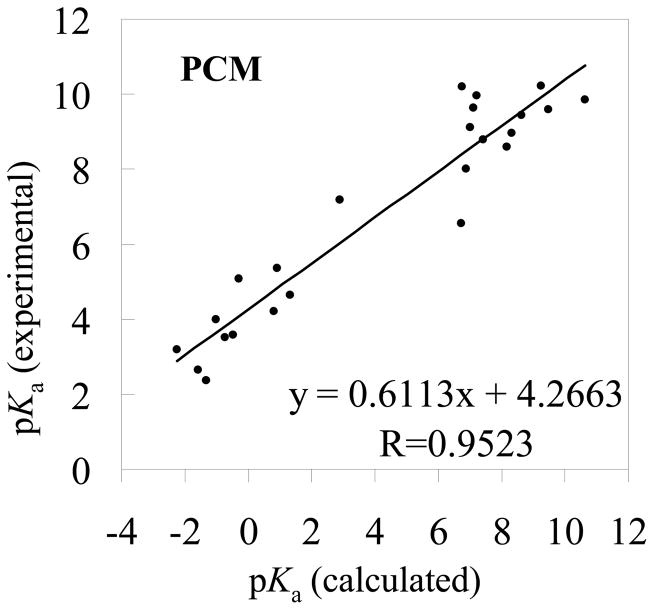
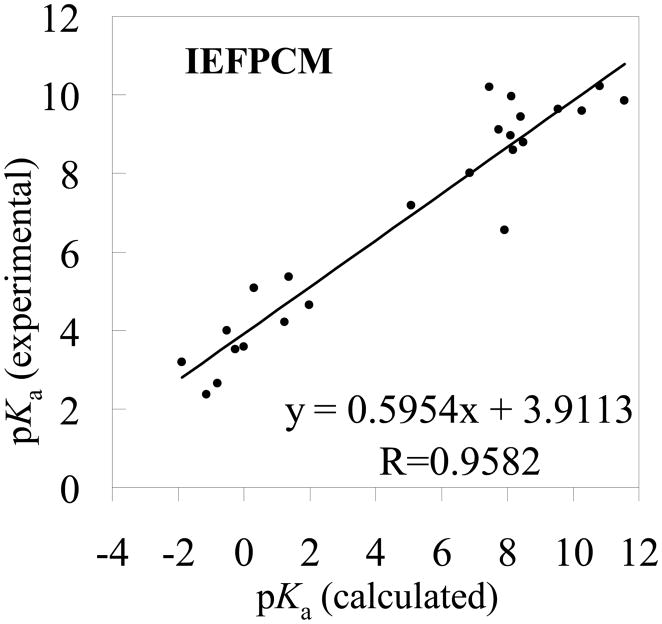
Although the RMSD values of the absolute pKa values calculated by using the PCM, IEFPCM, and COSMO models are as large as 2.72 to 3.88, all types of calculated pKa values linearly correlate with the experimental pKa values very well. When the MP2/6-311++G**//B3LYP/6-31+G* energies were used, we got the following linear correlation relationships:
| (16) |
| (17) |
| (18) |
| (19) |
Eqs. (16) to (19) are also given in Figures 4 to 7. When the B3LYP/6-31+G*//B3LYP/6-31+G* energies were used, we obtained the following linear correlation relationships:
| (20) |
| (21) |
| (22) |
| (23) |
The correlation coefficient (R) ranges from 0.9523 to 0.9824 for these linear correlation relationships. With the empirical corrections using Eqs.(16) to (23), the theoretical pKa values are much closer to the corresponding experimental data, as seen in Tables 1 and 2, and the RMSD values become 0.51 to 0.83. The largest R values (0.9824 or 0.9782) and the smallest RMSD values (0.51 or 0.56) are always associated with the SVPE model.
Conclusion
The absolute pKa values of cocaine, nicotine, 10 neurotransmitters, and 12 anilines in aqueous solution were calculated by performing first-principles electronic structure calculations that account for the solvent effects using four different solvation models. Within the examined computational methods, the first-principles electronic structure calculations using the SVPE model lead to the absolute pKa values with the smallest RMSD value (1.18). When the SVPE model was replaced by the PCM, IEFPCM, and COSMO, the RMSD value of the calculated absolute pKa values became 3.21, 2.72, and 3.08, respectively. All types of calculated pKa values linearly correlate with the experimental pKa values very well. The correlation coefficient (R) ranges from 0.9523 to 0.9824 for these linear correlation relationships. With the empirical corrections using the linear correlation relationships, the theoretical pKa values are much closer to the corresponding experimental data and the RMSD values become 0.51 to 0.83. The largest R value (0.9824) and the smallest RMSD value (0.51) are always associated with the SVPE model.
Figure 5.
The experimental pKa values versus the theoretical pKa values determined by using the MP2/6-311++G**//B3LYP/6-31+G* energies and the solvent shifts calculated with the PCM model
Figure 6.
The experimental pKa values versus the theoretical pKa values determined by using the MP2/6-311++G**//B3LYP/6-31+G* energies and the solvent shifts calculated with the IEFPCM model
Acknowledgments
The research was supported in part by NIH (grant R01DA013930 to C.-G. Zhan), National Natural Science Foundation of China (No.20503008;No.20528201), and the Center for Computational Sciences at University of Kentucky.
References
- 1.Mendelson JH, Mello NK. New Engl J Med. 1996;334:965. doi: 10.1056/NEJM199604113341507. [DOI] [PubMed] [Google Scholar]
- 2.Singh S. Chem Rev. 2000;100:925. doi: 10.1021/cr9700538. [DOI] [PubMed] [Google Scholar]
- 3.Paula S, Tabet MR, Farr CD, Norman AB, Ball WJ., Jr J Med Chem. 2004;47:133. doi: 10.1021/jm030351z. [DOI] [PubMed] [Google Scholar]
- 4.Sparenborg S, Vocci F, Zukin S. Drug Alcohol Depend. 1997;48:149. doi: 10.1016/s0376-8716(97)00072-0. [DOI] [PubMed] [Google Scholar]
- 5.Gorelick DA. Drug Alcohol Depend. 1997;48:159. doi: 10.1016/s0376-8716(97)00119-1. [DOI] [PubMed] [Google Scholar]
- 6.Redish AD. Science. 2004;306:1944. doi: 10.1126/science.1102384. [DOI] [PubMed] [Google Scholar]
- 7.Zhan CG, Zheng F, Landry DW. J Am Chem Soc. 2003;125:2462. doi: 10.1021/ja020850+. [DOI] [PMC free article] [PubMed] [Google Scholar]
- 8.Hamza A, Cho H, Tai HH, Zhan CG. J Phys Chem B. 2005;109:4776. doi: 10.1021/jp0447136. [DOI] [PMC free article] [PubMed] [Google Scholar]
- 9.Gao D, Zhan CG. J Phys Chem B. 2005;109:23070. doi: 10.1021/jp053736x. [DOI] [PubMed] [Google Scholar]
- 10.Zhan CG, Gao D. Biophysical Journal. 2005;89:3863. doi: 10.1529/biophysj.105.070276. [DOI] [PMC free article] [PubMed] [Google Scholar]
- 11.Pan Y, Gao D, Yang W, Cho H, Yang GF, Tai HH, Zhan CG. Proc Natl Acad Sci USA. 2005;102:16656. doi: 10.1073/pnas.0507332102. [DOI] [PMC free article] [PubMed] [Google Scholar]
- 12.Zhan C-G. In: Topics in Heterocyclic Drugs: QSAR and Molecular Modeling Studies in Heterocyclic Drugs. Gupta RR, Gupta SP, editors. Vol. 4. Springer-Verlag; Heidelberg, Germany: 2006. p. 107. [Google Scholar]
- 13.Gao D, Zhan CG. Proteins. 2006;62:99. doi: 10.1002/prot.20713. [DOI] [PMC free article] [PubMed] [Google Scholar]
- 14.Gao D, Cho H, Yang W, Pan Y, Yang GF, Tai HH, Zhan CG. Angew Chem Int Ed. 2006;45:653. doi: 10.1002/anie.200503025. [DOI] [PMC free article] [PubMed] [Google Scholar]
- 15.Gorrod JW, Jacob P III , editors. Analytic Determination of Nicotine and Related Compounds and Their Metabolites. Elsevier; New York: 1999. [Google Scholar]
- 16.Quikk M. Trends Neurosci. 2004;27:561. doi: 10.1016/j.tins.2004.06.008. [DOI] [PubMed] [Google Scholar]
- 17.Hogg RC, Bertrand D. Science. 2004;306:983. doi: 10.1126/science.1106030. [DOI] [PubMed] [Google Scholar]
- 18.Tapper AR, McKinney SL, Nashmi R, Schwarz J, Deshpande P, Labarca C, Whiteaker P, Marks MJ, Collins AC, Lester HA. Science. 2004;306:1029. doi: 10.1126/science.1099420. [DOI] [PubMed] [Google Scholar]
- 19.Wonnacott S, Sidhpura N, Balfour DJK. Curr Opin Pharm. 2005;5:53. doi: 10.1016/j.coph.2004.12.002. [DOI] [PubMed] [Google Scholar]
- 20.Karlin A. Nature Rev Neurosci. 2002;3:102. doi: 10.1038/nrn731. [DOI] [PubMed] [Google Scholar]
- 21.Miyazawa A, Fujiyoshi Y, Unwin N. Nature. 2003;423:949. doi: 10.1038/nature01748. [DOI] [PubMed] [Google Scholar]
- 22.Karlin A. Neuron. 2004;41:841. doi: 10.1016/s0896-6273(04)00151-5. [DOI] [PubMed] [Google Scholar]
- 23.Lester HA, Dibas MI, Dahan DS, Leite JF, Dougherty DA. Trends Neurosci. 2004;27:329. doi: 10.1016/j.tins.2004.04.002. [DOI] [PubMed] [Google Scholar]
- 24.(a) Schmitt JD. Curr Med Chem. 2000;7:749. doi: 10.2174/0929867003374660. [DOI] [PubMed] [Google Scholar]; (b) Tonder JE, Olesen PH. Curr Med Chem. 2001;8:651. doi: 10.2174/0929867013373165. [DOI] [PubMed] [Google Scholar]; (c) Bunnelle WH, Dart MJ, Schrimpf MR. Curr Topics Med Chem. 2004;4:299. doi: 10.2174/1568026043451438. [DOI] [PubMed] [Google Scholar]; (d) Briggs CA, Anderson DJ, Brioni JD, Buccafusco JJ, Buckley MJ, Campbell JE, Decker MW, Donnelly-Roberts D, Elliott RL, Gopalakrishnan M, Holladay MW, Hui YH, Jackson WJ, Kim DJ, Marsh KC, O’Neill A, Prendergast MA, Ryther KB, Sullivan JP, Arneric SP. Pharmacol Biochem Behav. 1997;57:231. doi: 10.1016/s0091-3057(96)00354-1. [DOI] [PubMed] [Google Scholar]
- 25.(a) Dwoskin LP, Sumithran SP, Zhu J, Deaciuc AG, Ayers JT, Crooks PA. Bioorg Med Chem Lett. 2004;14:1863. doi: 10.1016/j.bmcl.2003.10.073. [DOI] [PubMed] [Google Scholar]; (b) Crooks PA, Ayers JT, Xu R, Sumithran SP, Grinevich VP, Wilkins LH, Deaciuc AG, Allen DD, Dwoskin LP. Bioorg Med Chem Lett. 2004;14:1869. doi: 10.1016/j.bmcl.2003.10.074. [DOI] [PubMed] [Google Scholar]; (c) Papke RL, Zheng G, Horenstein NA, Dwoskin LP, Crooks PA. Bioorg Med Chem Lett. 2005;15:3874. doi: 10.1016/j.bmcl.2005.05.118. [DOI] [PMC free article] [PubMed] [Google Scholar]
- 26.(a) Briggs CA, et al. Pharm Biochem Behav. 1997;57:231. doi: 10.1016/s0091-3057(96)00354-1. [DOI] [PubMed] [Google Scholar]; (b) Carroll FI, Liang F, Navarro HA, Brieaddy LE, Abraham P, Damaj MI, Martin BR. J Med Chem. 2001;44:2229. doi: 10.1021/jm0100178. [DOI] [PubMed] [Google Scholar]; (c) Efange SMN, Tu Z, von Hohenberg K, Francesconi L, Howell RC, Rampersad MV, Todaro LJ, Papke RL, Kung MP. J Med Chem. 2001;44:4704. doi: 10.1021/jm010129z. [DOI] [PubMed] [Google Scholar]; (d) Sharples CGV, Karig G, Simpson GL, Spencer JA, Wright E, Millar NS, Wonnacott S, Gallagher T. J Med Chem. 2002;45:3235. doi: 10.1021/jm020814l. [DOI] [PubMed] [Google Scholar]; (e) Sullivan JP, et al. J Pharmacol Exp Ther. 1997;283:235. [PubMed] [Google Scholar]; (f) Wilkins LH, Jr, Grinevich VP, Ayers JT, Crooks PA, Dwoskin LP. J Pharmacol Exp Ther. 2003;304:400. doi: 10.1124/jpet.102.043349. [DOI] [PubMed] [Google Scholar]
- 27.(a) Tønder JE, Olesen PH. Curr Med Chem. 2001;8:651. doi: 10.2174/0929867013373165. [DOI] [PubMed] [Google Scholar]; (b) Bunnelle WH, Dart MJ, Schrimpf MR. Curr Topics Med Chem. 2004;4:299. doi: 10.2174/1568026043451438. [DOI] [PubMed] [Google Scholar]
- 28.Wilkins LH, Jr, Grinevich VP, Ayers JT, Crooks PA, Dwoskin LP. J Pharmacol Exp Ther. 2003;304:400. doi: 10.1124/jpet.102.043349. [DOI] [PubMed] [Google Scholar]
- 29.Dwoskin LP, Sumithran SP, Zhu J, Deaciuc AG, Ayers JT, Crooks PA. Bioorg Med Chem Lett. 2004;14:1863. doi: 10.1016/j.bmcl.2003.10.073. [DOI] [PubMed] [Google Scholar]
- 30.Crooks PA, Ayers JT, Xu R, Sumithran SP, Grinevich VP, Wilkins LH, Deaciuc AG, Allen DD, Dwoskin LP. Bioorg Med Chem Lett. 2004;14:1869. doi: 10.1016/j.bmcl.2003.10.074. [DOI] [PubMed] [Google Scholar]
- 31.Miller DK, Crooks PA, Zheng G, Grinevich VP, Norrholm SD, Dwoskin LP. J Pharm Exp Ther. 2004;310:1035. doi: 10.1124/jpet.104.068098. [DOI] [PubMed] [Google Scholar]
- 32.Pallavicini M, Moroni B, Bolchi C, Clementi F, Fumagalli L, Gotti C, Vailati S, Valoti E, Villa L. Bioorg Med Chem Lett. 2004;14:5827. doi: 10.1016/j.bmcl.2004.09.044. [DOI] [PubMed] [Google Scholar]
- 33.Wei ZL, Petukhov PA, Xiao Y, Tuckmantel W, George C, Kellar KJ, Kozikowski AP. J Med Chem. 2003;46:921. doi: 10.1021/jm025613w. [DOI] [PubMed] [Google Scholar]
- 34.Huang X, Zheng F, Crooks PA, Dwoskin LP, Zhan CG. J Am Chem Soc. 2005;127:14401. doi: 10.1021/ja052681+. [DOI] [PMC free article] [PubMed] [Google Scholar]
- 35.Huang X, Zheng F, Chen X, Crooks PA, Dwoskin LP, Zhan CG. J Med Chem. 2006;49:7661. doi: 10.1021/jm0606701. [DOI] [PubMed] [Google Scholar]
- 36.Albert A, Serjeant EP. The Determination of Ionization Constants. Chapman and Hall; New York: 1984. [Google Scholar]
- 37.Cookson RF. Chem Rev. 1974;74:5. [Google Scholar]
- 38.(a) Schüürmann G. Quant Struct-Act Relat. 1996;15:121. [Google Scholar]; (b) Cramer CJ, Truhlar DG. Science. 1992;256:213. doi: 10.1126/science.256.5054.213. [DOI] [PubMed] [Google Scholar]; (c) Lim C, Bashford D, Karplus M. J Phys Chem. 1991;95:5610. [Google Scholar]; (d) Andzelm J, Kölmel C, Klamt A. J Chem Phys. 1995;103:9312. [Google Scholar]
- 39.Kelly CP, Cramer CJ, Truhlar DG. J Phys Chem B. 2006;110:16066. doi: 10.1021/jp063552y. [DOI] [PubMed] [Google Scholar]
- 40.Brown TN, Mora-Diez N. J Phys Chem B. 2006;110:9270. doi: 10.1021/jp055084i. [DOI] [PubMed] [Google Scholar]
- 41.(a) Tunon I, Silla E, Tomasi J. J Phys Chem. 1992;96:9043. [Google Scholar]; (b) Tunon I, Silla E, Pascual-Ahuir JL. J Am Chem Soc. 1993;115:2226. [Google Scholar]
- 42.Kawata M, Ten-no S, Kato S, Hirata F. Chem Phys Lett. 1995;240:199. [Google Scholar]
- 43.Silva CO, da Silva EC, Nascimento MAC. J Phys Chem A. 2000;104:2402. [Google Scholar]
- 44.da Silva G, Kennedy EM, Dlugogorski BZ. J Phys Chem A. 2006;110:11371. doi: 10.1021/jp0639243. [DOI] [PubMed] [Google Scholar]
- 45.(a) Liptak MD, Shields GC. J Am Chem Soc. 2001;123:7314. doi: 10.1021/ja010534f. [DOI] [PubMed] [Google Scholar]; (b) Liptak MD, Gross KC, Seybold PG, Feldgus S, Shields GC. J Am Chem Soc. 2002;124:6421. doi: 10.1021/ja012474j. [DOI] [PubMed] [Google Scholar]
- 46.Li J, Fisher CL, Chen JL, Bashford D, Noodleman L. Inorg Chem. 1996;35:4694. [Google Scholar]
- 47.Gao J, Li N, Freindorf M. J Am Chem Soc. 1996;118:4912. [Google Scholar]
- 48.Kallies B, Mitzner R. J Phys Chem B. 1997;101:2959. [Google Scholar]
- 49.Topol IA, Tawa GJ, Caldwell RA, Eissenstat MA, Burt SK. J Phys Chem A. 2000;104:9619. [Google Scholar]
- 50.Richardson WH, Peng C, Bashford D, Noodleman L, Case DA. Int J Quantum Chem. 1997;61:207. [Google Scholar]
- 51.Shapley WA, Bacskay GB, Warr GG. J Phys Chem B. 1998;102:1938. [Google Scholar]
- 52.Schuurmann G, Cossi M, Barone V, Tomasi J. J Phys Chem A. 1998;102:6706. [Google Scholar]
- 53.Peräkylä M. Phys Chem Chem Phys. 1999;1:5643. [Google Scholar]
- 54.Wiberg KB, Clifford S, Jorgensen WL, Frisch MJ. J Phys Chem A. 2000;104:7625. [Google Scholar]
- 55.(a) Jang YH, Sowers LC, Cagin T, Goddard WA., III J Phys Chem A. 2001;105:274. [Google Scholar]; (b) Jang YH, Goddard WA, III, Noyes KT, Sowers LC, Hwang S, Chung DS. J Phys Chem B. 2003;107:344. [Google Scholar]
- 56.Klicic JJ, Friesner RA, Liu SY, Guida WC. J Phys Chem A. 2002;106:1327. [Google Scholar]
- 57.Adam KR. J Phys Chem A. 2002;106:11963. [Google Scholar]
- 58.Pliego JR, Jr, Riveros JM. J Phys Chem A. 2002;106:7434. [Google Scholar]
- 59.Lopez X, Schaefer M, Dejaegere A, Karplus M. J Am Chem Soc. 2002;124:5010. doi: 10.1021/ja011373i. [DOI] [PubMed] [Google Scholar]
- 60.Li G, Cui Q. J Phys Chem B. 2003;107:14521. [Google Scholar]
- 61.Klamt A, Eckert F, Diedenhofen M, Beck ME. J Phys Chem A. 2003;107:9380. doi: 10.1021/jp034688o. [DOI] [PubMed] [Google Scholar]
- 62.Schmidt am Busch M, Knapp EW. ChemPhysChem. 2004;5:1513. doi: 10.1002/cphc.200400171. [DOI] [PubMed] [Google Scholar]
- 63.Almerindo GI, Tondo DW, Pliego JR., Jr J Phys Chem A. 2004;108:166. [Google Scholar]
- 64.Scharnagl C, Raupp-Kossmann RA. J Phys Chem B. 2004;108:477. [Google Scholar]
- 65.Ulander J, Broo A. Int J Quantum Chem. 2005;105:866. [Google Scholar]
- 66.Krol M, Wrona M, Page CS, Bates PA. J Chem Theory Comput. 2006;2:1520. doi: 10.1021/ct600235y. [DOI] [PubMed] [Google Scholar]
- 67.Gutowski KE, Dixon DA. J Phys Chem A. 2006;110:12044. doi: 10.1021/jp065243d. [DOI] [PubMed] [Google Scholar]
- 68.Kallies B, Mitzner R. J Mol Struct (Theochem) 1998;428:267. [Google Scholar]
- 69.Chipman DM. J Chem Phys. 2002;106:7413. [Google Scholar]
- 70.Solmajer P, Kocjan D, Solmajer TZ. Naturforsch. 1983;38C:758. [PubMed] [Google Scholar]
- 71.(a) Dickinson JA, Hockridge MR, Kroemer RT, Robertson EG, Simons JP, McCombie J, Walker M. J Am Chem Soc. 1998;120:2622. [Google Scholar]; (b) Nagy PI, Alagona G, Ghio C. J Am Chem Soc. 1999;121:4804. [Google Scholar]; (c) Nagy PI, Alagona G, Ghio C, Takács-Novák K. J Am Chem Soc. 2003;125:2770. doi: 10.1021/ja028952n. [DOI] [PubMed] [Google Scholar]; (d) Nagy PI, Takács-Novák K. Phys Chem Chem Phys. 2004;6:2838. doi: 10.1021/jp075603c. [DOI] [PubMed] [Google Scholar]; (e) Alagona G, Ghio C, Nagy PI. J Chem Theory Comput. 2005;1:801. doi: 10.1021/ct050088c. [DOI] [PubMed] [Google Scholar]
- 72.(a) Becke AD. J Chem Phys. 1993;98:5648. [Google Scholar]; (b) Lee C, Yang W, Parr RG. Phys Rev B. 1988;37:785. doi: 10.1103/physrevb.37.785. [DOI] [PubMed] [Google Scholar]; (c) Stephens PJ, Devlin FJ, Chabalowski CF, Frisch MJ. J Phys Chem. 1994;98:11623. [Google Scholar]
- 73.Hehre WJ, Radom L, Schleyer PR, Pople JA. Ab Initio Molecular Orbital Theory. John Wiley & Sons; New York: 1987. [Google Scholar]
- 74.Frisch MJ, Trucks GW, Schlegel HB, Scuseria GE, Robb MA, Cheeseman JR, Montgomery JA, Jr, Vreven T, Kudin KN, Burant JC, Millam JM, Iyengar SS, Tomasi J, Barone V, Mennucci B, Cossi M, Scalmani G, Rega N, Petersson GA, Nakatsuji H, Hada M, Ehara M, Toyota K, Fukuda R, Hasegawa J, Ishida M, Nakajima T, Honda Y, Kitao O, Nakai H, Klene M, Li X, Knox JE, Hratchian HP, Cross JB, Adamo C, Jaramillo J, Gomperts R, Stratmann RE, Yazyev O, Austin AJ, Cammi R, Pomelli C, Ochterski JW, Ayala PY, Morokuma K, Voth GA, Salvador P, Dannenberg JJ, Zakrzewski VG, Dapprich S, Daniels AD, Strain MC, Farkas O, Malick DK, Rabuck AD, Raghavachari K, Foresman JB, Ortiz JV, Cui Q, Baboul AG, Clifford S, Cioslowski J, Stefanov BB, Liu G, Liashenko A, Piskorz P, Komaromi I, Martin RL, Fox DJ, Keith T, Al-Laham MA, Peng CY, Nanayakkara A, Challacombe M, Gill PMW, Johnson B, Chen W, Wong MW, Gonzalez C, Pople JA. Gaussian 03, Revision A.1. Gaussian, Inc; Pittsburgh, PA: 2003. [Google Scholar]
- 75.(a) Tomasi J, Persico M. Chem Rev. 1994;94:2027. [Google Scholar]; (b) Cramer CJ, Truhlar DG. Chem Rev. 1999;99:2161. doi: 10.1021/cr960149m. [DOI] [PubMed] [Google Scholar]
- 76.Zhan CG, Landry DW. J Phys Chem A. 2001;105:1296. [Google Scholar]
- 77.Zheng F, Zhan C-G, Ornstein RL. J Chem Soc Perkin Trans 2. 2001:2355. [Google Scholar]
- 78.Zheng F, Zhan CG, Ornstein RL. J Phys Chem B. 2002;106:717. [Google Scholar]
- 79.Zhan CG, Dixon DA, Sabri MI, Kim MS, Spencer PS. J Am Chem Soc. 2002;124:2744. doi: 10.1021/ja0113394. [DOI] [PubMed] [Google Scholar]
- 80.Dixon DA, Feller D, Zhan CG, Francisco SF. J Phys Chem A. 2002;106:3191. [Google Scholar]
- 81.(a) Zhan C-G, Norberto de Souza O, Rittenhouse R, Ornstein RL. J Am Chem Soc. 1999;121:7279. [Google Scholar]; (b) Zhan CG, Zheng F. J Am Chem Soc. 2001;123:2835. doi: 10.1021/ja005529a. [DOI] [PubMed] [Google Scholar]; (c) Dixon DA, Feller D, Zhan CG, Francisco SF. Int J Mass Spectrom. 2003;227:421. [Google Scholar]; (d) Zhan CG, Dixon DA, Spencer PS. J Phys Chem B. 2003;107:2853. [Google Scholar]; (e) Zhan CG, Dixon DA, Spencer PS. J Phys Chem B. 2004;108:6098. [Google Scholar]; (f) Chen X, Zhan CG. J Phys Chem A. 2004;108:3789. [Google Scholar]; (g) Chen X, Zhan CG. J Phys Chem A. 2004;108:6407. [Google Scholar]; (h) Xiong Y, Zhan CG. J Org Chem. 2004;69:8451. doi: 10.1021/jo0487597. [DOI] [PubMed] [Google Scholar]; (i) Zhan CG, Deng SX, Skiba JG, Hayes BA, Tschampel SM, Shields GC, Landry DW. J Comput Chem. 2005;26:980. doi: 10.1002/jcc.20241. [DOI] [PMC free article] [PubMed] [Google Scholar]; (j) Xiong Y, Zhan CG. J Phys Chem A. 2006;110:12644. doi: 10.1021/jp063140p. [DOI] [PMC free article] [PubMed] [Google Scholar]
- 82.(a) Zhan CG, Bentley J, Chipman DM. J Chem Phys. 1998;108:177. [Google Scholar]; (b) Zhan CG, Chipman DM. J Chem Phys. 1998;109:10543. [Google Scholar]; (c) Zhan CG, Chipman DM. J Chem Phys. 1999;110:1611. [Google Scholar]; (d) Zhan CG, Landry DW, Ornstein RL. J Phys Chem A. 2000;104:7672. [Google Scholar]; (e) Chen X, Zhan CG. J Phys Chem A. 2004;108:6407. [Google Scholar]; (f) Chipman DM. J Chem Phys. 2006;124:224111. doi: 10.1063/1.2203068. [DOI] [PubMed] [Google Scholar]
- 83.Schmidt MW, Baldridge KK, Boatz JA, Elbert ST, Gordon MS, Jensen JH, Koseki J, Matsunaga N, Nguyen KA, Su S, Windus TL, Dupuis M, Montgomery JA. J Comput Chem. 1993;14:1347. [Google Scholar]
- 84.(a) Miertus S, Scrocco E, Tomasi J. Chem Phys. 1981;55:117. [Google Scholar]; (b) Miertus S, Tomasi J. Chem Phys. 1982;65:239. [Google Scholar]; (c) Cossi M, Barone V, Cammi R, Tomasi J. Chem Phys Lett. 1996;255:327. [Google Scholar]
- 85.(a) Cances MT, Mennucci B, Tomasi J. J Chem Phys. 1997;107:3032. [Google Scholar]; (b) Cossi M, Barone V, Mennucci B, Tomasi J. Chem Phys Lett. 1998;286:253. [Google Scholar]; (c) Mennucci B, Cammi R, Tomasi J. J Chem Phys. 1998;109:2798. [Google Scholar]
- 86.Barone V, Cossi M. J Phys Chem A. 1998;102:1995. [Google Scholar]
- 87.Mejias JA, Lago S. J Chem Phys. 2000;113:7306. [Google Scholar]
- 88.Zhan CG, Dixon DA. J Phys Chem A. 2001;105:11534. [Google Scholar]
- 89.Zhan CG, Dixon DA. J Phys Chem A. 2002;106:9737. [Google Scholar]
- 90.Zhan CG, Dixon DA. J Phys Chem B. 2003;107:4403. [Google Scholar]
- 91.Zhan CG, Dixon DA. J Phys Chem A. 2004;108:2020. [Google Scholar]
- 92.Li P, Zhao K, Deng S, Landry DW. Helv Chim Acta. 1999;82:85. [Google Scholar]
- 93.Gorrod JW, Jacob P., III . Analytic Determination of Nicotine and Related Compounds and Their Metabolites. Elsevier; New York: 1999. [Google Scholar]
- 94.Ren H, Lang H, editors. Handbook of Analytical Chemistry. 2. Chemical Industry Press; Beijing: 1997. [Google Scholar]


