

Abstract
Herein we describe a sensitive and straightforward off-line capillary electrophoresis (CE) matrix-assisted laser desorption/ionization mass spectrometry (MALDI-MS) interface in conjunction with stable isotopic labeling (SIL) technique for comparative neuropeptidomic analysis in crustacean model organisms. Two SIL schemes, including a binary H/D formaldehyde labeling technique and novel, laboratory-developed multiplexed dimethylated leucine-based isobaric tagging reagents, have been evaluated in these proof-of-concept experiments. We employ these isotopic labeling techniques in conjunction with CE-MALDI MS for quantitative peptidomic analyses of the pericardial organs isolated from two crustacean species, the European green crab Carcinus maenas and the blue crab Callinectes sapidus. Isotopically labeled peptide pairs are found to co-migrate in CE fractions and quantitative changes in relative abundances of peptide pairs are obtained by comparing peak intensities of respective peptide pairs. Several neuropeptide families exhibit changes in response to salinity stress, suggesting potential physiological functions of these signaling peptides.
1. Introduction
As the most diverse and complex group of signaling molecules, neuropeptides induce and regulate many important physiological processes in a wide variety of organisms ranging from invertebrates to mammals. The large diversity of endogenous peptides, wide dynamic range of these molecules, and difficulty of inferring its final products from precursor genes or a complete lack of sequenced genomes have posed great challenges for neuropeptide characterization. Decapod crustacean model organisms provide a simpler platform for elucidating how a small neuronal circuit controls the neurogenic rhythm. The crustacean center nervous system (CNS) in animals such as Jonah crab, C. borealis provides an excellent, long-served model system for many endocrinology and neurobiology studies [1–5].
Mass spectrometry (MS)-based neuropeptidomics has become an intensive research area due to the importance of neuropeptides, rapid development of MS methodologies and advances in bioinformatic tools [6–10]. We have significantly expanded the crustacean neuropeptidome by a multifaceted MS approach [11]. Over 200 neuropeptides in seventeen families such as FMRFamide-related peptides, allatostatin neuropeptides (A, B and C type), and crustacean hyperglycemic hormone (CHH) [12], were identified, by LC-MS/MS de novo sequencing for large-scale discovery [13–16], in-situ peptide mapping by high-resolution MALDI Fourier transform MS (FTMS) [17,18], imaging MS by MALDI-TOF/TOF [19,20], as well as capillary electrophoresis (CE)-MALDI-MS profiling [21,22].
An ever increasing interest in neuroscience research is to improve our understanding of the regulatory functions of signaling molecules in an organism upon physiological and environmental perturbations [23,24]. It has been shown that many neuropeptides (e.g. neuropeptide Y (NY), cholecystokinin (CCK), vasopressin (VP), neurotensin (NT), and corticortropin-releasing hormone (CRH), etc. ) in the hypothalamus of mammals exhibit an increase or decrease in abundance after environmental or physiological stress [25,26]. In the past decade, crustacean hyperglycemic hormone (CHH), a neuropeptide first identified in the X-organ/sinus gland from the eyestalks of green shore crab, Carcinus maenas [26], has been extensively studied in various environmental conditions. The involvement of CHH in response to stressful conditions has been demonstrated by its elevated expression and release in animals exposed to hypoxic, temperature, or salinity changes [27–30]. Sensitive radioimmunoassay (RIA) methods were routinely employed to investigate the relative levels of CHH in these stress experiments, however, RIA detection is devoid of structural information and lacks the capability to discover unknown peptides [31]. Moreover, its low throughput has limited the large-scale neuropeptide screening and functional characterization.
It has become increasingly attractive to determine the relative abundance of endogenous protein or peptide level in different biological states using mass spectrometry. The advancement of comparative proteomics study has been fueled by the development of numerous quantitative MS techniques, which can be categorized into two major classes, including (i) label-free MS measurements such as spectral counting and LC-MS profiling [32–34], and (ii) labeling technique for MS, such as isotopic chemical labels (e.g., isotope-coded affinity tags (ICAT) [35–37] and isobaric tagging for relative and absolute quantitation (iTRAQ ™) [38]) and metabolic labels (i.e., SILAC [39–41]). Among diverse labeling techniques, formaldehyde dimethylation [42,43] has been widely used in paired, mass-difference relative quantitation because of its cost-effective reagents, fast reaction and high labeling efficiency. Formaldehyde labeling has been extensively used in our laboratory for neuropeptide de novo sequencing and quantitation [14,44–47]. Recently, we have extended the original binary formaldehyde dimethylation technique to multiplexing isobaric tagging strategy and developed a set of novel N, N-dimethyl leucine (DiLeu) 4-plex isobaric tandem mass tagging reagents, providing a promising and more cost-effective alternative for the commercial iTRAQ reagent [47,48]. DiLeu reagents offer high labeling efficiency, comparable quantitation performance with the commercial iTRAQ reagent, along with an additional benefit with much reduced cost thanks to its simple synthetic route.
We have employed the binary H/D formaldehyde labeling for direct MALDI-MS comparative peptidomic analysis in feeding [49] and stress studies [50]. We also explored the use of 4-plex DiLeu reagents for multiple time-point peptide changes using LC-MS/MS [48]. While promising results have been obtained, the extreme chemical complexity of neural tissue extracts may lead to analyte suppression issue encountered in direct MALDI MS analysis. The incorporation of LC-MS/MS can improve the dynamic range of these comparative peptidomic analyses, yet its capability is often impaired when the endogenous peptides are present in extremely low abundance or sample amounts are limited. In light of these limitations, the coupling of CE-MS provides an attractive alternative for cellular proteomics, peptidomics and metabolomics with minute quantities of samples [51–55]. We recently developed a straightforward off-line CE-MALDI-FTMS platform for the analysis of complex neuropeptide samples from crustacean neuronal tissue extracts [21]. This analytical platform shows excellent performance with 5–10 fold sensitivity improvement while consuming ~10 fold less sample amount as compared to direct MALDI-MS analysis. In this report, we extend CE-MALDI-MS analysis by incorporating stable isotopic labeling technique comparative profiling and quantifying peptidomic changes in response to stressful conditions. In a recent report by Zuberovic et al.[56], CE off-line coupling to MALDI-TOF/TOF MS was explored to quantitatively monitor the protein content in complex biological and clinical samples with iTRAQ™ labeling. This initial study has demonstrated great promise of combining isobaric tags with CE-MALDI-TOF/TOF MS for quantitative proteomic analysis. Here, in the current study, we employed both MALDI-TOF/TOF and MALDI-FTICR MS off-line coupling to CE separation in comparative MS neuropeptidomics analysis. Both formaldehyde labeling and laboratory-developed multiplexed dimethylated leucine-based isobaric tagging reagents are used simultaneously to provide complementary quantitation. MALDI-FTICR instrument offers high resolution and high mass accuracy measurements for more confident detection of mass shifts of isotopic peptide pairs, whereas MALDI TOF/TOF platform offers faster data acquisition and higher sensitivity for neuropeptide analysis. Preliminary observations of peptidomic changes in response to salinity changes are reported in this manuscript.
2. Experimental
2.1. Materials
All isotopic reagents for label synthesis including: leucines (L-leucine and L-leucine-1-13C, 15N), formaldehyde-D2 (CD2O, 20% w/w), deuterium sodium cyanoborodeuteride (NaBD3CN), 18O water 97% (H218O) and deuterium water (D2O) were purchased from ISOTEC Inc (Miamisburg, OH). N-Methylmorpholine (NMM) was purchased from TCI America (Tokyo, Japan). Ethanol was purchased from Pharmco-AAPER (Brookfield, CT). ACS grade methanol (MeOH), dichloromethane (CH2Cl2), acetonitrile (ACN), N, N-Dimethylformamide (DMF), and 4-(4, 6-Dimethoxy-1, 3, 5-triazin-2-yl)-4-methylmorpholinium chloride (DMTMM), ammonium hydroxide, formic acid, borane pyridine trifluoroacetic acid (TFA), and acetic acid were purchased from Fisher Scientific (Pittsburgh, PA). Sodium cyanoborohydride (NaBH3CN), cellulose acetate (39.7 wt %, average MW50 000), formaldehyde-H2 (CH2O, 37% w/w in H2O), α-cyano-4-hydroxy-cinnamic acid (CHCA) were purchased from Sigma-Aldrich Chemical Co. (St. Louis, MO). 2, 5-Dihydroxybenzoic acid was obtained from MP Biomedicals, Inc. (Solon, OH). Parafilm “M” was obtained from Pechiney Plastic Packaging (Menasha, WI). C18 Ziptip column was manufactured by Millipore, and all water used in this study was doubly distilled on a Millipore filtration system (Bedford, MA).
2.2. Animals and Salinity Stress Experiments
European green crab, Carcinus maenas with reddish-colored shells were purchased from Marine Biological Laboratory (Woods Hole, MA), green-colored shell crabs were provided by Dr. Andrew E. Christie, Imaging Core Center for Marine Functional Genomics, Maine. Blue crabs, Callinectes sapidus were purchased from Midway Asian grocery store (Madison, Wisconsin, USA). All animals maintained without food in an artificial seawater tank (salinity of 30 ppt (parts per thousand) and 10–12 °C) for 5 days before use. In a low salinity stress experiment crabs were kept in artificial seawater 0 ppt for one hour before dissection. Crabs were then cold anesthetized by packing on ice for 15 minutes. Dissection was performed in chilled (approximately 10 °C) physiological saline consisted of (in mM): NaCl, 440; KCl, 11; MgCl2, 26; NaCl, 440; KCl, 11; MgCl2, 26; CaCl2, 13; Tris (tris-hydroxymethylaminomethane), 11; maleic acid, 5; pH 7.45.
2.3. Neuropeptide Extraction
The green crabs were dissected according to previous report [17]. To extract neuropeptides, the pericardial organ tissue samples were homogenized in a manual tissue homogenizer in 40 μL of ice cold acidified methanol (methanol: glacial acetic acid: water, 90:9:1, v/v/v). The homogenate was transferred to a 0.6 mL low retention microcentrifuge tube (Fisher Scientific, Pittsburgh, PA) and sonicated for 10 minutes to improve the extraction efficiency. The resulting homogenate was centrifuged at over 10,000 rpm for 8 minutes, and then the supernatant was removed to a clean tube on ice. The homogenizer was rinsed with 50 μL acidified methanol for three times, and each time the resulting solution was used to wash the pellet and centrifuged for 8 minutes. The supernatant from each rinse was combined and concentrated to dryness using a Savant SC 110 SpeedVac concentrator (Thermo Electron Corporation, West Palm Beach, FL). The sample was then resuspended in 8 μL of Millipore water containing 0.1% formic acid (v/v) for formaldehyde labeling reactions.
The blue crabs were dissected out in chilled physiological saline and organs of interest were then immediately transferred to 20 μL cold DMF. Pericardial organs (POs) from twenty crabs were divided into four groups (5 crabs each group). POs extracted from each group were homogenized in 200 μL of DMF. The homogenate was centrifuged and supernatant was transferred to a clean 0.6 mL low retention microcentrifuge tube (Fisher Scientific, Pittsburgh, PA) and placed on ice. The pellet was then extracted 3 more times with 100 μL aliquots of DMF and the supernatant from each extraction was combined. The resulting supernatant was concentrated to dryness using SpeedVac and re-suspended in 8 μL of 50:50/ACN: 0.1% TFA (v/v) aqueous solution before labeling.
2.4. In Solution Formaldehyde Labeling
In solution formaldehyde labeling was performed as described previously [18]. Briefly, a 4 μL aliquot of PO tissue extract was labeled in solution by adding 0.7 μL borane pyridine (C5H8BN, 120 mM in 10% methanol), vortexed, and then mixed with formaldehyde (FH2, 20% in H2O, 0.5 μL) for control samples or deuterium formaldehyde (FD2, diluted to 20% with H2O, 0.5 μL) for stressed samples. The samples were then placed in a 37 °C water bath for 20 minutes for the labeling reaction to complete. Two equal aliquots (3 μL each) of the above labeled products were mixed together. The resulting mixture was spotted on target plate and analyzed using MALDI-FTMS or MALDI-TOF/TOF and subjected to CE separation.
2.5. Synthesis of N, N-Dimethylated Leucine (DiLeu) and Neuropeptide Labeling
The synthesis of N, N-Dimethylated Leucine (DiLeu) was previously described by Xiang et al [48]. Briefly, 120 mg portion of sodium cyanoborohydride (NaBH3CN) was dissolved in 125 μL of H2O or D2O. 100 mg portion of leucine or isotopic leucine was suspended in the mixture, the vial was sealed and mixture was kept in ice-water bath for 30 minutes to cool down. 285 μL light CH2O or 530 μL heavy formaldehyde CD2O was then added to the mixture drop wise. The mixture was stirred in ice-water bath for 30 minutes. Reaction was monitored by ninhydrin staining on a thin-layer chromatography (TLC) plate. Target molecule was purified by flash column (MeOH/CH2Cl2). 18O exchange is required for both 115 and 116 labels to be isobaric with label 117 and 118. 18O exchange was carried out according to procedure previously reported [57]. 25 mg leucine or isotopic leucine was dissolved in 1N HCl H218O solution (pH = 1) and was stirred on a hot plate at 65°C for 24 h, followed by reductive N, N-dimethylation.
DiLeu triazine ester was synthesized for the labeling. Briefly, 1 mg DiLeu in 50 μL DMF was mixed with 1.86 mg DMTMM and 0.74 μL NMM in a 1.6 mL eppendorf vial. Mixture was stirred at room temperature for 1 hour. 1 mL dichloromethane (CH2Cl2) was added to the mixture and 100 μL of water was used to wash the mixture 2 times. CH2Cl2 layer was collected and dried under a stream of nitrogen gas. The dried triazine ester was re-dissolved in DMF to make labeling stock solution (10mg/mL) and stored in −20°C for future labeling.
DiLeu Labeling was performed by transferring labeling solution (25 μL) to the sample vial containing neuropeptide extract. The sample sets were labeled at room temperature for 1 hour and quenched by adding 100 μL of water for 30 minutes. Labeled samples were combined at equal ratios (1:1:1:1) and dried under SpeedVac.
2.6. Instrumentation
2.6.1. MALDI-TOF/TOF-MS
A model 4800 MALDI-TOF/TOF analyzer (Applied Biosystems, Framingham, MA) equipped with a 200 Hz, 355 nm Nd: YAG laser was used for the analyses of neuropeptide extracts and CE fractions. Acquisitions were performed in positive ion reflectron mode. Instrument parameters were set using the 4000 Series Explorer software (Applied Biosystems). Mass spectra were obtained by averaging 900 laser shots covering mass range m/z 500–4000. 5 mg/mL of CHCA in 50:50 ACN: 0.1 % TFA (aq) (v/v) was used as matrix. For direct sample spotting, 0.4 μL of sample was spotted on MALDI plate first and allowed to dry followed by the addition of 0.4 μL of matrix.
2.6.2 MALDI-FTMS
A Varian/Ion Spec Fourier transform mass spectrometry (MALDI-FTMS) instrument (Lake Forest, CA) equipped with a 7.0 T actively shielded superconducting magnet was used for analysis of CE fractions. A 355 nm Nd: YAG laser (Laser Science, Inc., Franklin, MA) was used to create ions that can be accumulated in the external hexapole storage trap before being transferred through a quadrupole ion guide to the ion cyclotron resonance (ICR) cell. All mass spectra were collected in the positive ion mode. The ions were excited prior to detection with an rf sweep beginning at 7050 ms with a width of 4 ms and amplitude of 150 V base to peak. The filament and quadrupole trapping plates were initialized to 15 V, and both were ramped to 1 V from 6500 to 7000 ms to reduce baseline distortion of the peaks. Detection was performed in the broadband mode from m/z 108 to 2500. Mass spectra were obtained by averaging 50 laser shots covering mass range m/z 108–2500. 150 mg/mL of DHB in 50:50 MeOH: 0.1 % TFA(aq) (v/v) was used as matrix. For direct sample spotting, 0.4 μL of sample was spotted on MALDI plate first and followed by the addition of 0.4 μL of matrix.
2.6.3 Off-line CE Separation for MALDI-MS Analysis
Off-line CE separation was performed on a home-built CE apparatus equipped with a capillary of 75 cm in length (50 μm i.d. × 360 μm o.d.) as described elsewhere [21]. The CE runs under −18 kV using ammonium formate buffer (50 mM, 10% ACN, pH 3.5) at room temperature, 25 °C. Two MALDI-MS instruments including FTMS from Varian and 4800 MALDI-TOF/TOF MS from ABI were used for the analyses of CE fractions due to their distinct advantages. The FTMS provides ultra-high resolution and mass accuracy for accurate peptide identification, while the TOF/TOF MS is capable of fast data acquisition, highly sensitive analysis as well as powerful MS/MS ability for high throughput peptidomic profiling. For MALDI-FTMS analysis, the CE fractions were deposited, every 60 s, onto the tiny DHB spots predeposited onto the hydrophobic Parafilm coated MALDI plate, as described previously [58], for better sensitivities. DHB is known as “cold” MALDI matrix and is more stable and has fewer tendencies to fragment during the relatively lengthy FTMS pulse sequence for MALDI FTMS experiments. In contrast, CHCA is considered as “hot” matrix and is less stable and tends to undergo extensive metastable fragmentation in FTMS instrument. However, CHCA works extremely well with higher sensitivity on fast acquisition instrument such as MALDI TOF/TOF. As a result, for MALDI-TOF/TOF analysis, the CE fractions were collected onto CHCA spots that were predeposited on the MALDI sample plate by capillary, without the need of film coating.
2.7. Quantitative Data Analysis
Peptide peak identifications by MALDI-MS were made by using mass matching with previous reports and laboratory developed tissue and species specific neuropeptide database [15]. For formaldehyde labeling, salinity stressed and control samples were differentially labeled and mixed with 1:1 ratio. The spectra from either direct MALDI-MS or CE-MALDI-MS were analyzed manually and the peak pairs were assigned by identifying peptide pairs having 4 Da (or 8 Da) mass shift. The intensity ratios of monoisotopic peaks from FH2 and FD2 labeled pairs were utilized for the abundance ratio calculation. Average ratio was calculated from duplicate spectra. Student’s t-tests were performed to evaluate the differences between stressed and control samples using Microsoft Excel (p value<0.01 is considered statistically significant). In the t-test, the intensity of FH2 or FD2 labeled peak was normalized by dividing the total intensity of the peak pairs to eliminate differences of ionization efficiency between different acquisitions. For DiLeu labeling, four samples were combined with 1:1:1:1 ratio, the ratios of peptides were determined by dividing respective intensities of reporter ion generated in MS/MS fragmentation from DiLeu labeled peptides at m/z 116.1, 117.1, 118.1 with that at m/z 115.1, giving the ratio as 1:x:y:z.
3. Results and discussion
3.1.1. Neuropeptide extraction, formaldehyde and DiLeu labeling protocols
To minimize sample variability, animals with similar size and weight were carefully chosen from the same batch of shipment and were maintained under same conditions. Also, neuronal tissue dissection and neuropeptide extraction procedures were carefully performed to reduce discrepancy from sample to sample. Acidified methanol has been used extensively for neuropeptide extraction because of its effectiveness in suppressing neuropeptide degradation and easiness in drying-down.
It generates formaldehyde labeling compatible sample after sequential processes of homogenizing, centrifugation, drying, and reconstituting, even without desalting step. For the DiLeu reagents labeling, Xiang et al [48] observed that N, N-Dimethylformamide (DMF) was more effective for extraction and labeling since it is used thoroughly in the following experiments as solvent for DiLeu reagents and for promoting reactions.
Fig. 1 shows the flowchart for comparative CE-MALDI-MS using formaldehyde labeling technique. By using this binary labels, two equal aliquots of neuropeptide extracts from control and treated animals are differentially labeled with light formaldehyde (+28 Da) and heavy formaldehyde (+32 Da), respectively, resulting in a mass difference of 4 Da for each incorporated label pair. The relative abundance of peptide changes can be obtained by comparing peak height or area of the pairs. Our recent report with MALDI-TOF/TOF analysis of pairs of differentially labeled control samples (both are from unfed crab brains) in 1:1 mixture yielded expected 1:1 ratios [49]. After CE separation, it has been observed that the isotopically labeled peptide pairs co-migrate in CE fractions (see detailed discussion below), indicating that the peptides with light and heavy labels cannot be resolved in the present offline CE-MALDI MS platform due to its relatively poor separation efficiency. Increasing the deposition rate by an improved interfacing technique, such as ink jet printer spotter will be helpful to capture the exquisite separation efficiency provided by CE [59]. While suffering from the relatively poor efficiency caused by the discrete fraction collection method, an advantage is that the coexistence of lightly and heavily labeled peptides in each single spectrum will provide identical ionization efficiency in MALDI detection, offering better relative quantitation accuracy for comparative peptidomic analysis.
Fig. 1.
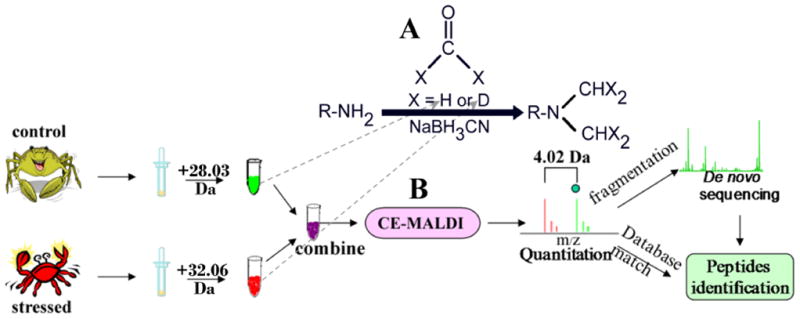
Formaldehyde labeling scheme (A) and protocol (B) for comparative CE-MALDI-MS of peptide quantitation and identification involved in environmental stress response.
Basically, the DiLeu labeling follows a similar protocol with the extension to four samples thanks to the 4-plex reagents set. Another marked difference from formaldehyde labeling is that, for each of the four DiLeu labels, its amine reactive group (the triazine ester) targets a peptide at the N-terminus (or amino group of the lysine side-chain) and the combination of isotopes encoded yield identical mass shift for each labels, resulting in an identical mass shift of m/z 145.1 in all labeled samples [48]. In this case, the 1:1:1:1 combined product, if concentrated to the same volume as each individual sample, equals to 4-fold enrichment of pre-mixed sample. This can effectively increase the CE and MS detection sensitivity. Given the intense a1 ion at N, N-dimethylated peptides upon MS/MS fragmentation, the relative abundances of peptides can be obtained by comparing the ratios of reporter ions at m/z 115.1, 116.1, 117.1, and 118.1 generated in MS/MS fragmentation. These reporter ions come from the intense immonium a1 ions in N-dimethylated neuropeptides upon MS2 dissociation.
3.1.2. Fast data acquisition and processing for peak pairs assignment
As the exact theoretical mass difference between formaldehyde-H2 and formaldehyde-D2 is 2.01255, the reaction incorporates two –CH2 or –CD2 groups to each primary amine site and thus results in a mass shift of 4.0251 Da upon differential labeling. This exact mass shift can be used for peak pair assignment. Off-line CE-MALDI-MS method often produces 20 to 40 effective fractions based on the samples’ complexity and separation parameters. The raw data from MALDI-MS spectra contain hundreds to thousands peaks in its mass list. This poses great challenges for manual data handling and analysis, especially for comparative peptidomics where rapid and accurate identifications of peptide peak pairs are needed for detecting peptide changes in physiological experiments. Here, we take advantage of Microsoft Excel’s powerful Formulas functions for the data processing in CE-MALDI-TOF/TOF experiments. As shown in Fig. 2A, the mass shift between the two adjacent centroid masses (each represents one peptide monoisotopic peak) can be obtained by defining equation fx =B(x)−B(x−1), where B is the column of detected masses, x represents the row number. For example, in row 86 the equation fx =B86-B85 (blue arrow shows) yields a mass shift of 4.025 (red arrow shows), corresponding to the peak pair of 1004.4935/1008.5186, from peptide SGFYANRYamide (m/z 976.46). All mass shifts like this can be generated in Excel worksheet in a few seconds. The values as close as 4.025 (red line) give more confidence for a peak pairs assignment, whereas a mass difference of 8.05 Da indicates a peptide sequence containing a lysine residue (green line). As shown in Fig. 2B, a mass list with 1,070 rows of data can be obtained in the CE-MALDI-TOF/TOF analysis of low salinity stressed C. maenas. By sorting data in the table, the number and identities of the peak pairs can be readily determined.
Fig. 2.

Excel worksheet of CE-MALDI-TOF/TOF-MS of C. maenas pericardial organ sample (stressed to control=1: 1) (low salinity). Highlighted rows in yellow show the paired peak in its heavy format (+4 Da); Highlighted rows in yellow in purple show the lysine containing peaks (+8 Da). 88 peak pairs containing 14 lysine containing peptides were detected in a single run.
3.2. Neuropeptide expression level change upon low salinity stress in European green crab, C. maenas
The European green crab, Carcinus maenas, is a non-native invasive predator that feeds voraciously on shellfish like molluscs, crustaceans, polychaetes and green algae, etc. Research shows that they can tolerate wide ranges of salinities (4–54 ppt) and temperatures (0–33 °C). The European green crab’s feeding habits and tolerance of a wide variety of environmental conditions has enabled it to occupy numerous coastal communities including Atlantic coast of Europe and northern Africa, Australia, and currently both coasts of North America, etc. Despite its name, the European green crabs exhibit more than one color morphs: red and green. Its ventral surface (underside) color may change from green to orange and then red during the molting cycle. In recent years, European green crabs have become a popular model organism for scientific study, and these crabs are amenable for the study of peptide changes upon environmental stress.
3.2.1. CE-MALDI-TOF/TOF-MS for neuropeptide relative quantitation in red-colored crab
Red-colored European green crabs were obtained in the fall season of September. Pericardial organ extracts were made according to the aforementioned procedures. Direct MALDI-TOF/TOF experiment yielded 9 pairs of peaks (Fig. 3A and 3C). The analytical coverage was low due to the wide concentration dynamic range and high diversity of interfering constituents (probably from lipids, proteins, and other artifacts from sample processing steps) to the MS analysis. Since the tissue extracts are often available in very small amount and the peptide mixtures are of high complexity, micro-separation techniques including capillary-LC and CE are excellent solutions to this kind of problem. Our group has recently demonstrated the power of off-line CE-MALDI-FTMS for enhanced neuropeptide profiling because the microscale CE fractionation provides effective desalting, preconcentration, and resolution to decrease the ionization suppression to peptides from interfering components. For the same sample analysis with CE, ~ 50 nL of pericardial organ extracts were injected onto CE column for fractionation followed by MALDI-TOF/TOF detection. Within a single run (Fig. 3B), 30–40 fractions were collected at 1 minute intervals and deposited onto the tiny CHCA matrix spots precoated onto the TOF/TOF bare plate via gravity flow using capillary. A total of 88 peptide pairs including 14 lysine containing peak pairs were determined by the Excel data processing method (Fig. 2B), showing significantly improved sensitivity and coverage. It is notable that only one tenth of the sample amount was consumed in the CE-MS experiment as compared to direct MALDI-MS analysis with significant increase in sensitivity and coverage.
Fig. 3.

(A–B) Bubble-mapped 2D plot of the MALDI-TOF/TOF data from: A) 500 nL of extract without CE separation, and B) 50 nL after CE separation for the sample in Fig. 2. (C) MALDI TOF/TOF spectrum from direct spotting sample. (D–G) CE-MALDI-TOF/TOF of fractions #6, 11, 17 and 21, respectively. Closed circle indicates lightly labeled peptide peak in a pair and open circle indicates heavy labeled peptide peak in a pair. Amino acid sequences (begin with FH2) were given for known peptides with light labeling reagent. Underlined label in red represents N-terminus blocked (unpaired) peptides. Boxed label in purple represents doubly labeled peak pairs (8.05 Da mass shift). CE condition: 75 cm × 50 μm i.d. × 360 μm o.d. The CE runs under −18 kV using ammonium formate buffer (50 mM, 10% ACN, pH 3.5) at room temperature, 20 °C.
We list in Supplementary Table S1 those peak pairs and the identified peptides’ sequences as well as relative ratios. 14 peptides including proctolin (m/z 649.37), crustacean cardioactive peptide (CCAP, m/z 956.38) and other RYamide, RFamide, AST-A and -B, Tachykinin, and Orcokinin peptides are identified. Some preliminary trends of relative abundance change have been visualized through CE-MALDI analysis. For example, all the four detected RYamide peptides and proctolin are found to be decreased upon low salinity stress. Similar trends were observed for RYamide peptide families in blue crab C. sapidus exposed to low salinity stress by direct MALDI MS analysis [50]. The peptides from the AST-A and AST-B types and CCAP do not exhibit dramatic changes under salinity stress, whereas the orcokinins are seen to be reduced significantly (4 to 5-fold) under low salinity stress. However, more biological replicates are needed to draw significant biological conclusions.
3.2.2 CE-MALDI-FTMS for neuropeptide relative quantitation in green-colored crabs
In this experiment, green-colored C. maenas crabs were obtained in the winter season of November. Fig. 4A shows a representative example of PO extract combined in 1:1 ratio from two crabs via CE-MALDI-FTMS analysis. In this run, fractions from number 8 to 25 were found containing numerous peptide signals. Due to the space limitation and the abundant information contained in these spectra, we present only 7 representative spectra out of all 18 fractions and stack them together for following discussion.
Fig. 4.

CE-MALDI-FTMS profiling of pericardial organs from C. maenas (green color morph) in response to low salinity. Seven representative spectra from fractions #8 to #25 are shown. Red closed circle ( ) shows lightly labeled peptide peak in a pair (4.03Da mass shift), green open circle (
 ) shows peak in the pair with a heavy label. Purple open pentagram (
 ) shows peak pairs with 8.05Da mass shift. CE conditions are the same as in Fig. 3.
In our previous study, we observed the best separation of neuropeptides in a reversed polarity (cathode at CE inlet end) with pressure assisted counter-flow (toward the outlet). This is likely due to extensive posttranslational modifications (PTMs) occurring in neuropeptides. Most neuropeptides are modified at C-termini with amidation, which yield a high isoelectric point (pI >11) or stable basicity, while few family peptides are C-terminal free (e.g., orcokinin) and thus bear low pI value at around 3 to 4. Most of these endogenous peptides carry +2 to +4 charges within a pH 3.5 ammonium formate running buffer for CE. Furthermore, some PTMs occurring on the neuropeptide molecular structure can also reduce their pI values (pI =2 to 3), such as phosphorylation and pyroglutamylation at the N-terminus in spite of the amidation at C-terminus. Considering these modifications and their effects on the pI values we can selectively elute the modified peptides in very early fractions to screen/validate these PTMs easily, and retain the basic peptides (the majority of neuropeptides) longer in CE to obtain improved resolution for these peptide families. Generally, peptide families in Cancer borealis follow an elution order under the reversed polarity CE mode as: pGlu-structure > orcokinin-like peptide > AST-A > AST-B > RYamide > RFamide. In the current study, this rule is found to be still valid for the C. maenas neuropeptides upon N-terminal labeling with FH2 or FD2. Figure 4 shows that at very early time, the CE fraction F9 (collected at 9 min) contains all orcokinin peptides, as well as some unpaired peaks, which are the candidates of pGlu peptides (their cyclic N-terminus blocks the N-terminal formaldehyde labeling), such as pEGFYSQRYamide (m/z 1030.47) and CbAST-C1, pQIRYHQCYFNPISCF (m/z 1899.89). The latter one was identified recently and has exhibited inhibitory effect on the crustacean pyloric circuitry [60]. In contrast, some peptides like GAHKNYLRFamide (m/z 1104.61) was found to elute very late in F24 due to its multiple positive charges (z=4) at pH 3.5. Many unknown peptides were also detected in the same or adjacent fractions, suggesting these peptides may contain multiple basic amino acid residues. Peptide GYSKNYLRFamide (m/z 1366.63, z = 2) also contains a lysine residue, but it is eluted in F11, the charge is calculated to be +2, which is close to other AST-A or B family peptides. The H2/D2 labeled peptide pairs co-migrated in the same CE fraction, exhibiting a mass difference of 4.03 Da, or 8.05 Da (rarely 12 Da). Due to the effective separation by CE, we also obtained higher sensitivity for most peptides, some peptides are concentrated and uniquely detected in a single fraction, such as peak pair corresponding to FVGGSRYamide (m/z 784.41, z = 2) were observed only in F12. However, even with extended migration time, many peptides are found to co-migrate and overlap, showing the extremely complex chemistry of the extract samples.
By utilizing the PeakHunter program with Varian ProMALDI FTMS, the monoisotopic peak lists (MH+) were generated for data analysis using the above described method with Excel. The result from CE-MALDI-FTMS expands the number of peptide peak pairs from 21 (in direct MALDI-MS analysis, not shown) to 62 using only a single pair of green crab pericardial organs. Table S2 shows 19 peptides from these pairs identified via high resolution and high mass accuracy FTMS measurements. The CE-MALDI determination in combination with direct MALDI-TOF/TOF [50] analysis of 10 biological replicates (Fig. S1) verified that 9 peptides show significant changes, e.g., several RFamide and RYamide peptides decrease after stress, showing typical stressed/control ratios around 0.5 to 0.8. This also agrees the previous analysis with red-colored crabs.
3.3. Combining 4-plex Di-Leu labeling reagent with CE fractionation for profiling pericardial organ from C. sapidus
In order to extend binary H/D formaldehyde labeling reagent to simultaneously investigate multiple samples, 4-plex DiLeu isobaric labeling reagents are used in conjunction with CE fractionation to profile and quantify neuropeptides in pericardial organs of the blue crab, C. sapidus, a crustacean species of significant commercial value and economic importance. Fig. 5A shows the neuropeptidomic profile displayed as 2D bubble map plotting the CE fraction number vs. mass/charge. More than two hundred mass spectral peaks are detected in a single run due to the relatively high concentration of sample (12 crabs, 4-fold enrichment), tens of peaks with ion signal typically at intensity like peptide a and b or even lower yield acceptable CID MS/MS fragmentation. As shown by the S/N bar in the figure, the CE separation have expanded the detection dynamic range of MALDI experiment by 140-fold. Fig. 5–B(i) and C(i) show the peptide a and b detected in the their respective fractions, which were subsequently dissociated (Fig. 5–B(ii) and C(ii)) via tandem MS. Intense reporter ions are produced to enable relative quantitation with the intensity of reporter ions increased by 2–3 fold from S/N 375 and 223 for peptides a and b, respectively. This observation highlights the utility of strong a1 reporter ions in MS2 [14,48]. An enlarged view of the reporter ions mass region containing the isotopes are shown in Fig. 5–B(iii) and C(iii), the peak heights allow relative quantitation for the peptides from four pericardial organ samples. The observed ratios are 1:0.61:0.72:0.87 and 1:0.63:0.77: 0.93, respectively, showing very similar trends of these two peptides. Close examination revealed that, the peak a, was from peptide FVGGSRYamide (m/z 784.42) and the peak b was from SGFYANRYamide (m/z 976.46), in the same RYamide family. The two peptides were found doubly labeled by DiLeu reagents, resulting in a mass shift of +290 Da in this preliminary experiment. It is notable that, our initial study by LC-MS/MS also observed the some specific families including RYamide bear the same expression trends in sample content and fragmentation pattern upon MS/MS. The utilization of these features will further enhance neuropeptide de novo sequencing as well as quantitation. The CE-MALDI-TOF/TOF in combination with the DiLeu labeling technique will provide multiplexing capabilities for large-scale comparative neuropeptidomics analyses with enhanced sensitivity.
Fig. 5.

CE-MALDI-TOF/TOF profiling of neuropeptides in the pericardial organs from C. sapidus (blue crab) in four groups of crabs. (A) Neuropeptidomic profile displayed as 2D bubble map plotting the CE fraction number vs. mass/charge, color bar and bubble sizes indicate the signal-to-ratio value. B (i),C (i) extracted mass of peptide a and b, B (ii), C (ii) MS/MS of the two peptides, B (iii), C (iii) enlarged view and ratios of the reporter ions at 115.1 to 118.1.
4. Conclusions and future directions
Two stable isotopic labeling techniques incorporated with CE-MALDI-MS profiling of neuropeptides were evaluated for comparative study of peptide expression changes in low salinity and sample variability. The CE separation shows great promise in reducing the extreme diversity of endogenous peptides and expanding the analytical dynamic range and coverage from complex samples with minute quantities. The two SIL labeling techniques show good compatibility with CE-MALDI experiment, and, in addition to their capabilities for relative quantitation, they provide other useful information for peptide identification by exact mass difference and distinct fragmentation pattern. The novel cost-effective N, N-dimethyl leucine isobaric tandem mass tags provide multiplexing capability for comparative neuropeptidomics study.
Supplementary Material
Acknowledgments
We wish to thank the UW School of Pharmacy Analytical Instrumentation Center for access to the MALDI FTMS instrument and the University of Wisconsin-Biotechnology Mass Spectrometry Facility and Drs. Amy Harms and Michael Sussman for access to the MALDI TOF/TOF instrument. We also thank Dr. Andrew E. Christie at the Mount Desert Island Biological Laboratory for providing green shell European green crabs. This work was supported in part by the School of Pharmacy and Wisconsin Alumni Research Foundation at the University of Wisconsin-Madison, a National Science Foundation CAREER Award (CHE-0449991), and National Institutes of Health through Grant 1R01DK071801. L.L. acknowledges an Alfred P. Sloan Research Fellowship and a Vilas Associate Fellowship.
Footnotes
Publisher's Disclaimer: This is a PDF file of an unedited manuscript that has been accepted for publication. As a service to our customers we are providing this early version of the manuscript. The manuscript will undergo copyediting, typesetting, and review of the resulting proof before it is published in its final citable form. Please note that during the production process errors may be discovered which could affect the content, and all legal disclaimers that apply to the journal pertain.
References
- 1.Marder E, Calabrese RL, Nusbaum MP, Trimmer B. J Comp Neurol. 1987;259:150. doi: 10.1002/cne.902590111. [DOI] [PubMed] [Google Scholar]
- 2.Nusbaum MP, Marder E. J Exp Biol. 1988;135:165. [Google Scholar]
- 3.Christie AE, Baldwin DH, Marder E, Graubard K. Cell Tissue Res. 1997;288:135. doi: 10.1007/s004410050801. [DOI] [PubMed] [Google Scholar]
- 4.Glowik RM, Golowasch J, Keller R, Marder E. J Exp Biol. 1997;200:1421. doi: 10.1242/jeb.200.10.1421. [DOI] [PubMed] [Google Scholar]
- 5.Glowik RM, Golowasch J, Keller R, Marder E. Trends Comp Endocrinol Neurobiol. 1998;839:406. [Google Scholar]
- 6.Li L, Sweedler JV. Ann Rev Anal Chem. 2008;1:451. doi: 10.1146/annurev.anchem.1.031207.113053. [DOI] [PubMed] [Google Scholar]
- 7.Baggerman G, Verleyen P, Clynen E, Huybrechts J, De Loof A, Schoofs L. J Chromatogr B. 2004;803:3. doi: 10.1016/j.jchromb.2003.07.019. [DOI] [PubMed] [Google Scholar]
- 8.Fricker LD, Lim J, Pan H, Che FY. Mass Spectrom Rev. 2006;25:327. doi: 10.1002/mas.20079. [DOI] [PubMed] [Google Scholar]
- 9.Hummon AB, Amare A, Sweedler JV. Mass Spectrom Rev. 2006;25:77. doi: 10.1002/mas.20055. [DOI] [PubMed] [Google Scholar]
- 10.Svensson M, Skold K, Nilsson A, Falth M, Svenningsson P, Andren PE. Biochem Soc Trans. 2007;35:588. doi: 10.1042/BST0350588. [DOI] [PubMed] [Google Scholar]
- 11.Ma M, Wang J, Chen R, Li L. J Proteome Res. 2009;8:2426. doi: 10.1021/pr801047v. [DOI] [PMC free article] [PubMed] [Google Scholar]
- 12.Ma M, Chen R, Ge Y, He H, Marshall AG, Li L. Anal Chem. 2009;81:240. doi: 10.1021/ac801910g. [DOI] [PMC free article] [PubMed] [Google Scholar]
- 13.Li L, Kelley WP, Billimoria CP, Christie AE, Pulver SR, Sweedler JV, Marder E. J Neurochem. 2003;87:642. doi: 10.1046/j.1471-4159.2003.02031.x. [DOI] [PubMed] [Google Scholar]
- 14.Fu Q, Li L. Anal Chem. 2005;77:7783. doi: 10.1021/ac051324e. [DOI] [PubMed] [Google Scholar]
- 15.Ma M, Bors EK, Dickinson ES, Kwiatkowski MA, Sousa GL, Henry RP, Smith CM, Towle DW, Christie AE, Li L. Gen Comp Endocrin. 2009;161:320. doi: 10.1016/j.ygcen.2009.01.015. [DOI] [PMC free article] [PubMed] [Google Scholar]
- 16.Ma M, Chen R, Sousa GL, Bors EK, Kwiatkowski MA, Goiney CC, Goy MF, Christie AE, Li L. Gen Comp Endocrin. 2008;156:395. doi: 10.1016/j.ygcen.2008.01.009. [DOI] [PMC free article] [PubMed] [Google Scholar]
- 17.Kutz KK, Schmidt JJ, Li L. Anal Chem. 2004;76:5630. doi: 10.1021/ac049255b. [DOI] [PubMed] [Google Scholar]
- 18.DeKeyser SS, Li L. Analyst. 2006;131:281. doi: 10.1039/b510831d. [DOI] [PubMed] [Google Scholar]
- 19.DeKeyser SS, Kutz-Naber KK, Schmidt JJ, Barrett-Wilt GA, Li L. J Proteome Res. 2007;6:1782. doi: 10.1021/pr060603v. [DOI] [PMC free article] [PubMed] [Google Scholar]
- 20.Chen R, Hui L, Sturm RM, Li L. J Am Soc Mass Spectrom. 2009;20:1068. doi: 10.1016/j.jasms.2009.01.017. [DOI] [PMC free article] [PubMed] [Google Scholar]
- 21.Wang J, Ma M, Chen R, Li L. Anal Chem. 2008;80:6168. doi: 10.1021/ac800382t. [DOI] [PMC free article] [PubMed] [Google Scholar]
- 22.Wang J, Jiang X, Sturm RM, Li L. J Chromatogr A. 2009;1216:8283. doi: 10.1016/j.chroma.2009.04.085. [DOI] [PMC free article] [PubMed] [Google Scholar]
- 23.Chung JS, Zmora N. FEBS J. 2008;275:693. doi: 10.1111/j.1742-4658.2007.06231.x. [DOI] [PubMed] [Google Scholar]
- 24.Matias I, Vergoni AV, Petrosino S, Ottani A, Pocai A, Bertolini A, Di Marzo V. Neuropharmacology. 2008;54:206. doi: 10.1016/j.neuropharm.2007.06.011. [DOI] [PubMed] [Google Scholar]
- 25.Barakat Y, Pape JR, Boutahricht M, El Ouezzani S, Alaoui A, Chaigniau M, Tramu G, Magoul R. J Neuroendocrinol. 2006;18:767. doi: 10.1111/j.1365-2826.2006.01474.x. [DOI] [PubMed] [Google Scholar]
- 26.Kegel G, Reichwein B, Weese S, Gaus G, Peter-Katalinic J, Keller R. FEBS Lett. 1989;255:10. doi: 10.1016/0014-5793(89)81051-8. [DOI] [PubMed] [Google Scholar]
- 27.Chung JS, Bembe S, Tamone S, Andrews E, Thomas H. Gen Comp Endocrinol. 2009;162:129. doi: 10.1016/j.ygcen.2009.03.012. [DOI] [PubMed] [Google Scholar]
- 28.Chung JS, Webster SG. Endocrinology. 2005;146:5545. doi: 10.1210/en.2005-0859. [DOI] [PubMed] [Google Scholar]
- 29.Chung JS, Webster SG. Gen Comp Endocrinol. 2006;147:206. doi: 10.1016/j.ygcen.2006.01.002. [DOI] [PubMed] [Google Scholar]
- 30.Chung JS, Zmora N. FEBS J. 2008;275:693. doi: 10.1111/j.1742-4658.2007.06231.x. [DOI] [PubMed] [Google Scholar]
- 31.Chard T. An introduction to radioimmunoassay and related techniques. Elsevier; Sole distributors for the U.S.A. and Canada, Elsevier Science Pub. Co; Amsterdam; New York New York, NY, U.S.A: 1987. [Google Scholar]
- 32.Old WM, Meyer-Arendt K, Aveline-Wolf L, Pierce KG, Mendoza A, Sevinsky JR, Resing KA, Ahn NG. Mol Cell Proteomics. 2005;4:1487. doi: 10.1074/mcp.M500084-MCP200. [DOI] [PubMed] [Google Scholar]
- 33.Mueller LN, Brusniak MY, Mani DR, Aebersold R. J Proteome Res. 2008;7:51. doi: 10.1021/pr700758r. [DOI] [PubMed] [Google Scholar]
- 34.Choi H, Fermin D, Nesvizhskii AI. Mol Cell Proteomics. 2008;7:2373. doi: 10.1074/mcp.M800203-MCP200. [DOI] [PMC free article] [PubMed] [Google Scholar]
- 35.Gygi SP, Rist B, Gerber SA, Turecek F, Gelb MH, Aebersold R. Nat Biotechnol. 1999;17:994. doi: 10.1038/13690. [DOI] [PubMed] [Google Scholar]
- 36.Goshe MB, Conrads TP, Panisko EA, Angell NH, Veenstra TD, Smith RD. Anal Chem. 2001;73:2578. doi: 10.1021/ac010081x. [DOI] [PubMed] [Google Scholar]
- 37.Han DK, Eng J, Zhou HL, Aebersold R. Nat Biotechnol. 2001;19:946. doi: 10.1038/nbt1001-946. [DOI] [PMC free article] [PubMed] [Google Scholar]
- 38.Ross PL, Huang YLN, Marchese JN, Williamson B, Parker K, Hattan S, Khainovski N, Pillai S, Dey S, Daniels S, Purkayastha S, Juhasz P, Martin S, Bartlet-Jones M, He F, Jacobson A, Pappin DJ. Mol Cell Proteomics. 2004;3:1154. doi: 10.1074/mcp.M400129-MCP200. [DOI] [PubMed] [Google Scholar]
- 39.Ong SE, Blagoev B, Kratchmarova I, Kristensen DB, Steen H, Pandey A, Mann M. Mol Cell Proteomics. 2002;1:376. doi: 10.1074/mcp.m200025-mcp200. [DOI] [PubMed] [Google Scholar]
- 40.Blagoev B, Kratchmarova I, Ong SE, Nielsen M, Foster LJ, Mann M. Nat Biotechnol. 2003;21:315. doi: 10.1038/nbt790. [DOI] [PubMed] [Google Scholar]
- 41.Ong SE, Foster LJ, Mann M. Methods. 2003;29:124. doi: 10.1016/s1046-2023(02)00303-1. [DOI] [PubMed] [Google Scholar]
- 42.Hsu JL, Huang SY, Chow NH, Chen SH. Anal Chem. 2003;75:6843. doi: 10.1021/ac0348625. [DOI] [PubMed] [Google Scholar]
- 43.Ji CJ, Guo N, Li L. J Proteome Res. 2005;4:2099. doi: 10.1021/pr050215d. [DOI] [PubMed] [Google Scholar]
- 44.Fu Q, Li L. J Am Soc Mass Spectrom. 2006;17:859. doi: 10.1016/j.jasms.2006.03.002. [DOI] [PubMed] [Google Scholar]
- 45.Fu Q, Li L. Rapid Comm Mass Spectrom. 2006;20:553. doi: 10.1002/rcm.2337. [DOI] [PubMed] [Google Scholar]
- 46.DeKeyser SS, Li L. Analyst. 2006:281. doi: 10.1039/b510831d. [DOI] [PubMed] [Google Scholar]
- 47.Xiang F, Fu Q, Li L. Proceedings of the 56th ASMS Conference on Mass Spectrometry and Allied Topics; Denver, CO. June 1–5, 2008. [Google Scholar]
- 48.Xiang F, Ye H, Chen R, Fu Q, Li L. Anal Chem. doi: 10.1021/ac902778d. under review. [DOI] [PMC free article] [PubMed] [Google Scholar]
- 49.Chen R, Hui L, Cape SS, Wang J, Li L. ACS Chemical Neuroscience. 2010 doi: 10.1021/cn900028s. in press. [DOI] [PMC free article] [PubMed] [Google Scholar]
- 50.Zhang Y, Chen R, Li L. Proceedings of the 57th ASMS Conference on Mass Spectrometry and Allied Topics; Philadelphia, PA. May 31–June 4, 2009. [Google Scholar]
- 51.Lapainis T, Sweedler JV. J Chromatogr A. 2008;1184:144. doi: 10.1016/j.chroma.2007.10.098. [DOI] [PubMed] [Google Scholar]
- 52.Lapainis T, Rubakhin SS, Sweedler JV. Anal Chem. 2009;81:5858. doi: 10.1021/ac900936g. [DOI] [PMC free article] [PubMed] [Google Scholar]
- 53.Fonslow BR, Yates JR. J Sep Sci. 2009;32:1175. doi: 10.1002/jssc.200800592. [DOI] [PMC free article] [PubMed] [Google Scholar]
- 54.Amantonico A, Urban PL, Zenobi R. Analyst. 2009;134:1536. doi: 10.1039/b907039g. [DOI] [PubMed] [Google Scholar]
- 55.Haubitz M, Good DM, Woywodt A, Haller H, Rupprecht H, Theodorescu D, Dakna M, Coon JJ, Mischak H. Mol Cell Proteomics. 2009;8:2296. doi: 10.1074/mcp.M800529-MCP200. [DOI] [PMC free article] [PubMed] [Google Scholar]
- 56.Zuberovic A, Wetterhall M, Hanrieder J, Bergquist J. Electrophoresis. 2009;30:1836. doi: 10.1002/elps.200800714. [DOI] [PubMed] [Google Scholar]
- 57.Murphy RC, Clay KL. Methods Enzymol. 1990;193:338. doi: 10.1016/0076-6879(90)93425-k. [DOI] [PubMed] [Google Scholar]
- 58.Wang J, Chen R, Ma M, Li L. Anal Chem. 2008;80:491. doi: 10.1021/ac701614f. [DOI] [PubMed] [Google Scholar]
- 59.Vannatta MW, Whitmore CD, Dovichi NJ. Electrophoresis. 2009;30:4071. doi: 10.1002/elps.200900414. [DOI] [PMC free article] [PubMed] [Google Scholar]
- 60.Ma M, Szabo TM, Jia C, Marder E, Li L. Peptides. 2009;30:1660. doi: 10.1016/j.peptides.2009.05.023. [DOI] [PMC free article] [PubMed] [Google Scholar]
Associated Data
This section collects any data citations, data availability statements, or supplementary materials included in this article.