

Abstract
Diabetic subjects are at an increased risk of developing plantar ulcers. Knowledge of the physiologic compressive properties of the plantar soft tissue is critical to understanding possible mechanisms of ulcer formation and improving treatment options. The purpose of this study was to determine the compressive mechanical properties of the plantar soft tissue in both diabetic and non-diabetic specimens from six relevant locations beneath the foot, namely the hallux (big toe), first, third, and fifth metatarsal heads, lateral midfoot, and calcaneus (heel). Cylindrical specimens (1.905cm diameter) from these locations were excised and separated from the skin and bone from 4 diabetic and 4 non-diabetic age-matched, elderly, fresh-frozen cadaveric feet. Specimens were then subjected to biomechanically realistic strains of ∼50% in compression using triangle wave tests conducted at five frequencies ranging from 1 to 10 Hz to determine tissue modulus, energy loss, and strain rate dependence. Diabetic vs. non-diabetic results across all specimens, locations, and testing frequencies demonstrated altered mechanical properties with significantly increased modulus (1146.7 vs. 593.0kPa) but no change in energy loss (68.5 vs. 67.9%). All tissue demonstrated strain rate dependence and tissue beneath the calcaneus was found to have decreased modulus and energy loss compared to other areas. The results of this study could be used to generate material properties for all areas of the plantar soft tissue in diabetic or non-diabetic feet, with implications for foot computational modeling efforts and potentially for pressure alleviating footwear that could reduce plantar ulcer incidence.
Keywords: foot, diabetic, subcutaneous, soft tissue, viscoelastic
Introduction
A severe and costly complication of diabetes is plantar ulceration, which can often lead to amputation of the affected limb. Approximately 24 million Americans were estimated to have diabetes in 2007 (CDCP, 2007). In 2004 about 71,000 nontraumatic lower-limb amputations were performed in people with diabetes, accounting for more than 60% of all nontraumatic lower limb amputations (CDCP, 2007). It is estimated that 15% of diabetic individuals will develop a foot ulcer during their lifetime (Palumbo and Melton, 1995) and 2-3% may develop a foot ulcer annually (Reiber et al., 1995). Given that ulcer related costs averaged $13,179 per episode in 2001 (Stockl et al., 2004), it can be seen that a large portion of the costs associated with all diabetes related chronic complications, reported as $58 billion in 2007 (ADA, 2008), may be attributed to ulceration. There is clearly a need to further develop preventative measures as well as improve treatment options to reduce the costs and morbidity associated with ulcer incidence. These developments require a better understanding of the causes of ulcer formation.
Plantar ulceration may result from a combination of factors including peripheral neuropathy resulting in insensate feet (Mueller et al., 1990; Reiber et al., 1995; Sumpio, 2000), increased pressures and repetitive mechanical trauma beneath the foot (Mueller et al., 1990; Ulbrecht et al., 2004), and compromised healing due to poor vascular supply (Sumpio, 2000). Amongst these factors, aberrant plantar pressures are routinely used as an indicator of ulcer risk (Cavanagh et al., 2000) and may result from changes in the properties of the natural cushioning fat pad beneath the foot, i.e., the plantar soft tissue, (Jahss et al., 1992) that affect its ability to bear load and function properly. The plantar soft tissue in the healthy foot has a specialized structure consisting of fat-filled septal chambers (Blechschmidt, 1982; Tietze, 1982) that function to dissipate stresses by deforming (De Clercq et al., 1994), to maintain normal plantar pressures (Jahss et al., 1992), and to absorb the impact of heel strike to an extent (Bennett and Ker, 1990). The elastic septa in dysvascular and diabetic feet tend to be thicker and considerably fragmented as compared to non-diabetic feet (Buschmann et al., 1995). Continued hyperglycemia resulting in glycation of proteins is believed to be a major cause of detrimental changes in diabetic tissues such as collagen cross-links that decrease the flexibility of collagenous tissues and thereby compromise their mechanical integrity (Paul and Bailey, 1996; Reiber et al., 1998).
Subsequently, several key mechanical property changes in the plantar tissue have been demonstrated to occur with diabetes. Diabetes has been shown to increase energy loss in heel pads (Hsu et al., 2007; Hsu et al., 2002; Hsu et al., 2000). Diabetic subjects with peripheral neuropathy and a history of ulcers have been shown to have stiffer tissue (Klaesner et al., 2002) and harder tissue (Piaggesi et al., 1999) than that of age-matched controls. Older diabetic plantar tissue has been demonstrated to be stiffer (Gefen et al., 2001; Zheng et al.) and thinner (Zheng et al., 2000) than young, non-diabetic tissue, however these results are potentially confounded by age. This increased stiffness in diabetic plantar tissue has been attributed to the deeper layer of tissue (Hsu et al., 2009). Diabetes has also been shown to increase shear stiffness of plantar tissue (Cheung et al., 2006; Gefen et al., 2001). All of these studies may be limited as they are structural in nature (i.e., of the whole intact foot versus isolated tissue specimens and hence do not address changes that occur with diabetes to the plantar fat alone), the duration of diabetes is not always indicated, and not all regions under the foot have been examined. Material properties of diabetic tissue would be extremely useful if applied to a computational model of the foot as they would enable rapid, comprehensive, and quantitative study to optimize orthoses and footwear without burdening patients or utilizing costly cadaveric experiments. There are few studies that have examined the material properties of the plantar soft tissue (Ledoux and Blevins, 2007; Miller-Young et al., 2002), however these studies do not investigate diabetic tissue and are limited as they assume a frictionless specimen-platen interface without validation. Since it is difficult to obtain true material properties experimentally due to imperfect boundary conditions, inverse finite element techniques (Erdemir et al., 2006; Lemmon et al., 1997) could be used to generate geometry independent properties from isolated specimens tested with controlled boundary conditions. Additionally, duration of diabetes is important to control for since tissue changes may only occur 15 years after the onset of diabetes (Reiber et al., 1998). Finally, since it has been shown that plantar tissue properties vary by location (Ledoux and Blevins, 2007) and that certain plantar locations are more susceptible to ulceration than others (Cowley et al., 2008; Isakov et al., 1995), including the hallux, metatarsal heads, and calcaneus, it would be useful to examine mechanical properties at these plantar locations. Further, the lateral midfoot is also of interest since it bears load during gait (Perry, 1992).
Thus, the purpose of this study is to characterize the mechanical properties of isolated plantar tissue specimens from both diabetic and non-diabetic feet at six relevant locations. Knowledge of these mechanical properties is critical to understanding possible mechanisms of ulcer formation in diabetic patients and finding ways of compensating for detrimental tissue changes to prevent amputation in this high-risk population.
Methods
Eight fresh frozen cadaveric feet, four diabetic (15 years post-diagnosis) and four non-diabetic, were purchased from the National Disease Research Interchange. Institutional Review Board approval was obtained for this study from the Human Subjects Division at the University of Washington. Donors were of similar age and weight based on a two-sample t-test (Table 1). All feet were harvested within 24hrs post-mortem, sealed in plastic bags, and kept frozen until testing when they were defrosted overnight in a cooler. Six plantar tissue specimens were obtained from each foot at locations of interest, namely the hallux, first, third, and fifth metatarsal heads, lateral midfoot, and calcaneus (Fig. 1a). The plantar soft tissue was dissected free from the underlying muscle and bone, cut into cylindrical specimens using a 1.905cm diameter punch (Fig. 1b), and further dissected from the skin using a scalpel to maintain in vivo thickness (approximately 3 to 11mm, depending on location). Specimens were stored on ice until immediately prior to testing. One foot was tested per day and specimen testing order was randomized to minimize any effect due to time between dissection and testing.
Table 1.
Mean [SD] donor information
| Diabetic (n=4) | Non-diabetic (n=4) | p* | |
|---|---|---|---|
| Age (yrs) | 70 [8] | 68 [5] | .6 |
| Weight (kg) | 94 [25] | 70 [12] | .15 |
| Gender (M:F) | 2:2 | 2:2 | - |
| Diabetes duration | 20.3 [8.1] | - | - |
p<.05 for 2 sample t-test
Fig. 1.
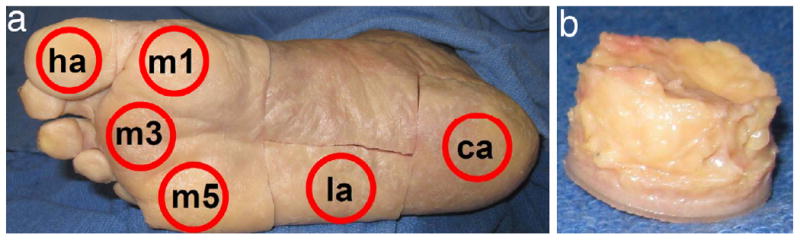
Specimen locations (a) at the hallux (ha), first, third, and fifth metatarsal heads (m1, m3, and m5), lateral midfoot (la), and calcaneus (ca) as well as (b) a typical plantar tissue specimen before skin removal.
Each specimen was then placed in an environmental chamber between two platens covered with 220 grit sandpaper (Fig. 2). The chamber was designed to heat a water bath below the platen and create a moist environment near 100% humidity and at 35°C to approximate conditions in vivo. This setup was attached to an ElectroForce 3200 materials testing machine (Bose Corporation, Minnetonka, MN). The bottom platen was raised to apply a 0.1N compressive load and specimen initial thickness was measured. A biomechanically realistic target load was used to determine the target displacement. The target load was calculated using a method described previously (Ledoux and Blevins, 2007), which based the applied force on donor weight and the cross-sectional area of the tissue specimen along with normative ground reaction force and contact area data (Ledoux and Hillstrom, 2002). The isolation effects from separating specimens from their surrounding tissue was also accounted for (Miller-Young and Duncan, 2002). In load control, the specimen underwent ten 1Hz sine waves from 10N to the target load; the maximal absolute displacement was noted as the target displacement. Target prescribed strain was calculated as target displacement divided by the initial thickness. The sample was allowed to recover in an unloaded state for 10 minutes after the load control test followed by a brief tuning period. Triangle wave tests consisted of 30 cycles to the prescribed strain at each of five frequencies of 1, 2, 3, 5, and 10Hz in a randomized order. The force and displacement data were acquired at 1000Hz except for the 10Hz triangle wave data which were acquired at 5000Hz. Peak stress (max force at the prescribed strain divided by original specimen area), peak strain (max displacement at the prescribed strain divided by initial specimen thickness), modulus (slope of the loading stress-strain curve after the inflection point), and energy loss (area between the loading and unloading stress-strain curves) were recorded for each frequency and location tested.
Fig. 2.
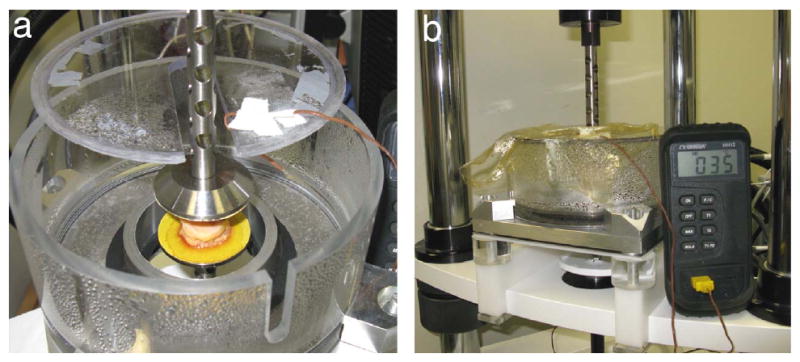
Experimental set-up showing specimen in environmental chamber (a) between sand-paper covered platens and (b) after sealing to maintain in vivo conditions of near 100% humidity and 35°C.
Linear mixed effect regression was used to determine the association between soft tissue measures (dependent variables, e.g., energy loss) and diabetes status, frequency, and location (independent variables) using R 2.9.0 (R Foundation for Statistical Computing, Vienna, Austria). The overall study design had 2 levels: a between subject level (diabetes status) and a within subject level (location and frequency). Frequency was modeled both as a five category variable (4 model coefficients) and as a continuous two degree polynomial. Location was modeled as heel vs. other, and in exploratory analyses, as a 6-category variable (5 model coefficients). Models testing for the association between frequency and soft tissue measures were adjusted for location. Models testing for the association between location and soft tissue measures were adjusted for frequency (modeled as a two-degree polynomial). Significance was set at p=.05. If the overall association between frequency or location and a soft tissue variable was significant, post-hoc pair-wise contrasts were carried out using Bonferroni's correction for multiple comparisons. Significance was set at p=.005 and p=.0033 for pair-wise comparisons among frequency and location categories respectively. Summary measures of centrality and spread of soft tissue measure by diabetes group, location and frequency are presented as means and standard deviations. Summary measures of model-estimated pair-wise differences in soft tissue measures by location or frequency are presented as means and standard errors. Note that due to a data acquisition error, there is missing data from the 10Hz triangle wave for one non-diabetic lateral midfoot specimen.
Results
The stress-strain response for all specimens was nonlinear with a large toe region up to the inflection point followed by a rapid increase in stiffness at higher strains (Fig. 3). Plantar soft tissue from diabetic feet had significantly higher mean modulus than soft tissue from non-diabetic feet (Table 2). For the number of specimens tested, diabetic feet had similar energy loss. Diabetic feet trended towards thinner tissue than non-diabetic feet, however these differences were not significant. Peak stress was significantly higher in diabetic feet yet peak strain was not significantly different.
Fig. 3.
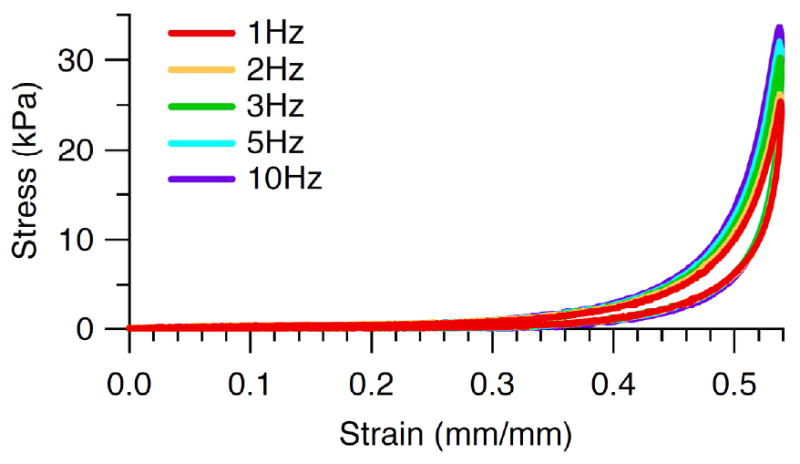
Typical nonlinear stress-strain response with a toe region up to the inflection point followed by a rapid increase in stiffness at higher strains and showing increasing peak stress, modulus, and energy loss with increasing frequency.
Table 2.
Mean [SD] soft tissue measure by diabetes status
| Diabetic | Non-diabetic | p* | |
|---|---|---|---|
| Modulus (kPa) | 1147 [446] | 593 [205] | .0008 |
| Energy loss (%) | 68.5 [7.7] | 67.9 [9.6] | .8 |
| Thickness (mm) | 6.30 [1.96] | 6.79 [1.59] | .2 |
| Peak Stress (kPa) | 100 [29] | 62 [19] | .0035 |
| Peak Strain (%) | 49.7 [6.4] | 50.5 [5.8] | .6 |
p<.05 from linear mixed effects regression on diabetes status with random effect for subject
The plantar soft tissue demonstrated strain rate dependence (Fig. 3) as both modulus (Fig. 4a) and energy loss (Fig. 5a) increased with increasing frequency. Modulus varied with frequency in an overall comparison of both diabetic and non-diabetic specimens (Table 3) and pair-wise differences were found between certain frequencies (Table 4). Energy loss varied with frequency (Table 3) and all pair-wise differences were significant. Peak stress was also found to increase with frequency (Table 3, Fig. 6a) despite no change in peak strain with increasing frequency (Table 3, Fig. 7a).
Fig. 4.
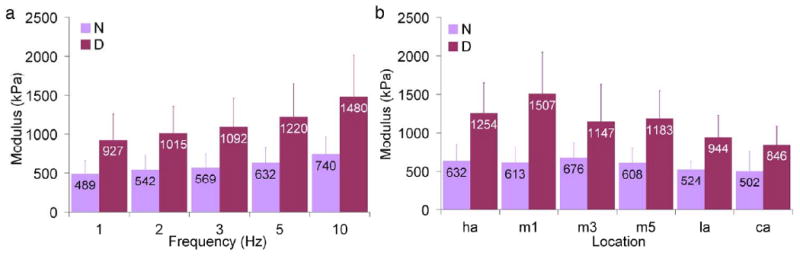
Mean modulus as a function of (a) frequency (across all locations) and (b) location (across all frequencies) where error bars represent standard deviations, N = non-diabetic, D = diabetic, ha = hallux, m1, m3, and m5 = first, third, and fifth metatarsals, la = lateral midfoot, and ca = calcaneus.
Fig. 5.
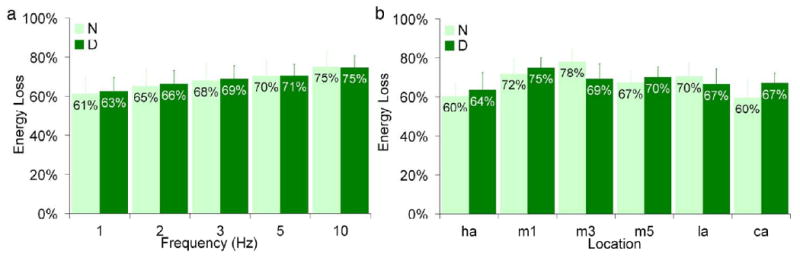
Mean energy loss as a function of (a) frequency (across all locations) and (b) location (across all frequencies) where error bars represent standard deviations, N = non-diabetic, D = diabetic, ha = hallux, m1, m3, and m5 = first, third, and fifth metatarsals, la = lateral midfoot, and ca = calcaneus.
Table 3.
Mean [SD] soft tissue measure by frequency
| 1 | 2 | 3 | 5 | 10 | p* | |
|---|---|---|---|---|---|---|
| Modulus (kPa) | 708 [338] | 778 [363] | 830 [388] | 926 [439] | 1118 [550] | .006 |
| Energy loss (%) | 61.9 [7.7] | 65.7 [7.9] | 68.3 [7.9] | 70.4 [7.1] | 74.9 [6.8] | <.0001 |
| Peak Stress (kPa) | 75.0 [29.9] | 78.0 [30.4] | 79.8 [30.1] | 83.5 [31.1] | 89.7 [32.1] | .0030 |
| Peak Strain (%) | 0.501 | 0.501 [0.061] | 0.501 [0.061] | 0.501 [0.061] | 0.500 [0.062] | 1.0 |
p<.05 from linear mixed effects models on frequency adjusted for location with random effects for subject and the difference in frequency coefficients across subjects.
Table 4.
Model estimated differences [SE] in modulus by frequency
| 1 | 2 | 3 | 5 | |
|---|---|---|---|---|
| 2 | 70 [29] | |||
| 3 | 122 [33]* | 52 [29] | ||
| 5 | 218 [42]* | 148 [37]* | 96 [32] | |
| 10 | 395 [67]* | 324 [60]* | 272 [52]* | 177 [41]* |
p<.005 from linear mixed effects regression adjusting for location and random effects for subject and the difference in frequency model coefficients across subjects.
Fig. 6.
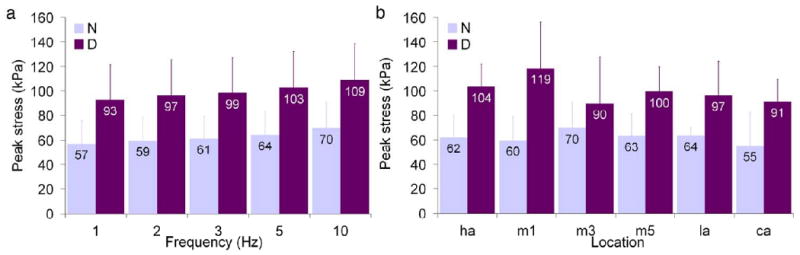
Mean peak stress as a function of (a) frequency (across all locations) and (b) location (across all frequencies) where error bars represent standard deviations, N = non-diabetic, D = diabetic, ha = hallux, m1, m3, and m5 = first, third, and fifth metatarsals, la = lateral midfoot, and ca = calcaneus.
Fig. 7.
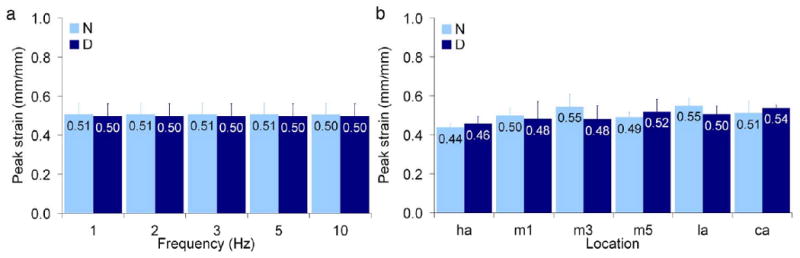
Mean peak strain as a function of (a) frequency (across all locations) and (b) location (across all frequencies) where error bars represent standard deviations, N = non-diabetic, D = diabetic, ha = hallux, m1, m3, and m5 = first, third, and fifth metatarsals, la = lateral midfoot, and ca = calcaneus.
There were no overall differences (p=.3) for both diabetic and non-diabetic specimens between all locations tested and modulus (Fig. 4b), however energy loss varied with location (Fig. 5b) with an overall significance of p=.0001 and pair-wise differences were found between certain locations (Table 5). There were no pair-wise contrasts between locations tested and peak strain and peak stress that met the Bonferroni criterion (p<.0033). Interestingly, the highest peak stress for non-diabetic specimens was observed at the location of the lowest peak stress for diabetic specimens (third metatarsal, Fig. 6b). An examination of the heel versus all other locations (Table 6) showed that mean thickness at the heel was significantly higher. Although mean modulus and in general mean energy loss were lower at the heel, these findings were only borderline significant (Table 6). Peak stress and peak strain did not vary between the heel and other locations (Table 6).
Table 5.
Model estimated differences [SE] in energy loss by location
| HA | M1 | M3 | M5 | LA | |
|---|---|---|---|---|---|
| M1 | 11.5 [1.8]* | ||||
| M3 | 11.7 [3.2] | 0.2 [3.7] | |||
| M5 | 6.6 [2.3] | -4.8 [1.5] | 5.0 [3.4] | ||
| LA | 6.4 [3.8] | -5.0 [3.1] | -5.2 [2.7] | -0.2 [2.4] | |
| CA | 1.3 [2.1] | -10.2 [1.2]* | -10.4 [4.1] | -5.3 [1.6] | -5.1 [3.3] |
p<.0033 from linear mixed effects regression adjusting for frequency and random effects for subject and the difference in location model coefficients.
Table 6.
Mean [SD] soft tissue measure by location (calcaneus vs. others)
| HA | M1 | M3 | M5 | LA | CA | p* | ||
|---|---|---|---|---|---|---|---|---|
| Modulus (kPa) | 943 [442] | 1060 | 911 [431] | 895 [406] | 740 [297] | 674 [297] | .020 | |
| Energy loss (%) | 62.0 [7.8] | 73.5 [6.5] | 73.7 [8.3] | 68.6 [5.9] | 68.4 [7.8] | 63.3 [8.0] | .010 | |
| Thickness (mm) | 6.12 [0.59] | 5.00 | 5.52 [1.25] | 5.92 [0.71] | 6.90 [0.77] | 9.81 [0.71] | <.0001 | |
| Peak Stress (kPa) | 82.8 [27.5] | 89.1 | 79.8 [31.7] | 81.4 [26.1] | 80.5 [26.0] | 73.3 [28.9] | .2 | |
| Peak Strain (%) | 44.7 [3.0] | 48.9 [6.9] | 51.2 [7.6] | 50.5 [4.9] | 52.7 [4.7] | 52.5 [4.6] | .2 | |
p<.05 from linear mixed effects models on location (calcaneus vs. others) adjusted for frequency with random effects for subject and the difference in the calcaneus vs. other location coefficient across subject.
Discussion
The mechanical properties of the plantar soft tissue have not been well quantified with regard to diabetes progression or for areas other than the heel pad. The purpose of this study was to explore the properties of isolated plantar soft tissue in diabetic specimens and aged-matched controls at six relevant plantar tissue locations that are prone to ulceration and/or bear load during gait, namely the hallux, first, third, and fifth metatarsals, lateral midfoot, and calcaneus.
A key finding of this study was that diabetic tissue demonstrated altered mechanical properties, showing significantly increased stiffness compared to controls. This result is consistent with previous findings that tested the feet of living subjects' (Cheung et al., 2006; Gefen et al., 2001; Hsu et al., 2009; Klaesner et al.; Zheng et al.). Direct comparison of stiffness obtained from these studies is difficult due to the many differences in protocols, including: testing specimens that were not isolated, varying indentation rates, assuming linear elasticity, reporting stiffness rather than modulus, or calculating shear properties. In the current study, peak stress was significantly higher in diabetic tissue yet peak strain was not, further indicating increased stiffness in diabetic tissue. This increased stress may also be partially due to the larger target loads used for the diabetic specimens based on increased body weight (despite no significant difference in Table 1 due to small sample size). In contrast with the literature, diabetic tissue did not have increased energy loss (Hsu et al., 2007; Hsu et al., 2002) and was not significantly thinner (Gooding et al., 1986; Zheng et al., 2000).
Further, the plantar soft tissue measures (modulus, energy loss, and stress) demonstrated strong strain rate dependence. Similar to previous studies (Ledoux and Blevins, 2007), they increased with frequency. Surprisingly, there was limited location dependence in the soft tissue measures, in contrast with previous work (Ledoux and Blevins, 2007). As previously shown (Gooding et al., 1986), the calcaneal tissue was found to be significantly thicker than other locations. Mean modulus and energy loss at the calcaneus were lower than other locations, the former agrees with the literature whereas the latter does not (Ledoux and Blevins, 2007).
The values for the different parameters obtained in this study are comparable to previously observed plantar soft tissue properties given differences in protocol, populations, specimen size and geometry, and boundary conditions (Ledoux and Blevins, 2007; Miller-Young et al., 2002). For the current study, we determined an overall diabetic vs. non-diabetic (across all specimens, locations, and testing frequencies) modulus of 1147 vs. 593kPa, energy loss of 68.5 vs. 67.9%, peak strain of 49.7 vs. 50.5mm/mm, and peak stress of 100 vs. 62kPa. Ledoux et al. (2007) measured a similar modulus of 750kPa and peak stress of ∼100kPa but a lower energy loss of 44.5% for approximately 50% strain. These differences might be explained by the fact that they assumed a frictionless specimen-platen interface rather than fixing both ends of the tissue, and used young specimens that were cubic in geometry and had 1.4 times larger cross-sectional area. Similarly, Miller-Young et al. (2002) measured stresses of 25.2kPa for similar strains (∼50%) but at a higher strain rate of 21s-1. Beyond differences due to assumed frictionless boundary conditions and 5.7 times smaller cross-sectional area, possible reasons for their lower stresses include their use of a ten-fold smaller preload (∼0.01 N) and potential truncation of higher stresses since they only used the constant velocity portion of their tests. Their tests were also limited since they were conducted at room temperature, which may have caused the adipose tissue properties to differ from those at body temperature.
The current experimental set-up utilized sandpaper to secure both ends of the tissue to the platens, resulting in structural rather than material property measurements. This boundary condition was imposed to ensure experimental repeatability since the specimens were found to slide in an inconsistent manner when placed directly between the platens during pilot tests and from previous observations (Ledoux and Blevins, 2007). This sliding meant that multiple tests would have been needed on the same specimen to ensure the specimen did not slide to the edge of the platen, which could compromise the results if the tissue was over-tested. It was also deemed more biomechanically realistic to fix both ends of the plantar tissue to emulate the in vivo plantar tissue boundary conditions, i.e., attachments to the skin and bone. Hence, caution must be taken as the modulus reported here is not a material property that can be directly applied to numerical simulations. The material properties must first be generated from the current structural test data using inverse finite element techniques (Erdemir et al., 2006; Lemmon et al., 1997).
There were some potential limitations. Although the plantar tissue is sensitive to target strain errors (Pai and Ledoux, 2009), we used a special compensation feature of the software when tuning the materials testing machine to minimize these errors to 0.08% which should have negligible effects on the measured forces. Additionally, we omitted examination of tissue from the digits in our analysis, despite their susceptibility to ulceration (Cowley et al., 2008; Isakov et al., 1995), due to difficulties in dissecting uniform specimens from such small tissue sections. Moreover, the behavior of the tissue is non-linear hence our use of a linear slope to quantify the modulus is limited. Our reasoning is that a linear slope provides a meaningful estimate of stiffness, and for comparative purposes a single numeric value offers sufficient means for quantifying differences between groups (i.e., disease status or location). Further, there is a potential risk that some of the diabetic feet may not have undergone tissue changes even after 15 years of hyperglycemia exposure. We believe this risk is minimal given the fact that diagnosis of diabetes may occur 9-12 years after disease onset (Harris et al., 1992), making our estimate of diabetes duration conservative. Finally, although we utilized fresh frozen cadaveric rather than living tissue, it has been shown that freshly amputated heel pads have similar properties to pads that have previously been frozen (Bennett and Ker, 1990).
This study demonstrates that changes occur in the compressive mechanical properties of the plantar soft tissue with diabetes, most notably making it stiffer and thereby compromising its ability to dissipate the stresses borne by the foot, which may increase ulceration risk. These structural results could be used to generate material properties for all areas of the plantar soft tissue in the diabetic foot, with implications for foot computational modeling efforts and potentially for orthotic pressure reduction devices.
Acknowledgments
This study was supported by the National Institutes of Health grant 1R01 DK75633-03 and the Department of Veterans Affairs, RR&D Service grant A4843C. The authors would also like to thank Jane Shofer, M.S. for the statistical analysis, Michael Fassbind, M.S. for equipment design, and Paul Vawter for assisting with data analysis.
Footnotes
Conflict of Interest Statement: The authors have not conflicts to report.
Publisher's Disclaimer: This is a PDF file of an unedited manuscript that has been accepted for publication. As a service to our customers we are providing this early version of the manuscript. The manuscript will undergo copyediting, typesetting, and review of the resulting proof before it is published in its final citable form. Please note that during the production process errors may be discovered which could affect the content, and all legal disclaimers that apply to the journal pertain.
References
- ADA. Economic costs of diabetes in the U.S. In 2007. Diabetes Care. 2008;31:596–615. doi: 10.2337/dc08-9017. [DOI] [PubMed] [Google Scholar]
- Bennett MB, Ker RF. The mechanical properties of the human subcalcaneal fat pad in compression. Journal of Anatomy. 1990;171:131–138. [PMC free article] [PubMed] [Google Scholar]
- Blechschmidt E. The structure of the calcaneal padding. Foot & Ankle. 1982;2:260–283. doi: 10.1177/107110078200200503. [DOI] [PubMed] [Google Scholar]
- Buschmann WR, Jahss MH, Kummer F, Desai P, Gee RO, Ricci JL. Histology and histomorphometric analysis of the normal and atrophic heel fat pad. Foot & Ankle International. 1995;16:254–258. doi: 10.1177/107110079501600502. [DOI] [PubMed] [Google Scholar]
- Cavanagh PR, Ulbrecht JS, Caputo GM. New developments in the biomechanics of the diabetic foot. Diabetes Metab Res Rev. 2000;16 1:S6–S10. doi: 10.1002/1520-7560(200009/10)16:1+<::aid-dmrr130>3.0.co;2-z. [DOI] [PubMed] [Google Scholar]
- CDCP. National diabetes fact sheet: general information and national estimates on diabetes in the United States. Atlanta, GA: 2007. [Google Scholar]
- Cheung YY, Doyley M, Miller TB, Kennedy F, Lynch F, Jr, Wrobel JS, Paulson K, Weaver J. Magnetic resonance elastography of the plantar fat pads: Preliminary study in diabetic patients and asymptomatic volunteers. J Comput Assist Tomogr. 2006;30:321–326. doi: 10.1097/00004728-200603000-00031. [DOI] [PubMed] [Google Scholar]
- Cowley MS, Boyko EJ, Shofer JB, Ahroni JH, Ledoux WR. Foot ulcer risk and location in relation to prospective clinical assessment of foot shape and mobility among persons with diabetes. Diabetes Research and Clinical Practice. 2008;82:226–232. doi: 10.1016/j.diabres.2008.07.025. [DOI] [PubMed] [Google Scholar]
- De Clercq D, Aerts P, Kunnen M. The mechanical characteristics of the human heel pad during foot strike in running: An in vivo cineradiographic study. Journal of Biomechanics. 1994;27:1213–1222. doi: 10.1016/0021-9290(94)90275-5. [DOI] [PubMed] [Google Scholar]
- Erdemir A, Viveiros ML, Ulbrecht JS, Cavanagh PR. An inverse finite-element model of heel-pad indentation. J Biomech. 2006;39:1279–1286. doi: 10.1016/j.jbiomech.2005.03.007. [DOI] [PubMed] [Google Scholar]
- Gefen A, Megido-Ravid M, Azariah M, Itzchak Y, Arcan M. Integration of plantar soft tissue stiffness measurements in routine MRI of the diabetic foot. Clin Biomech (Bristol, Avon) 2001;16:921–925. doi: 10.1016/s0268-0033(01)00074-2. [DOI] [PubMed] [Google Scholar]
- Gooding GA, Stess RM, Graf PM, Moss KM, Louie KS, Grunfeld C. Sonography of the sole of the foot. Evidence for loss of foot pad thickness in diabetes and its relationship to ulceration of the foot. Investigative Radiology. 1986;21:45–48. [PubMed] [Google Scholar]
- Harris MI, Klein R, Welborn TA, Knuiman MW. Onset of NIDDM occurs at least 4-7 yr before clinical diagnosis. Diabetes Care. 1992;15:815–819. doi: 10.2337/diacare.15.7.815. [DOI] [PubMed] [Google Scholar]
- Hsu CC, Tsai WC, Hsiao TY, Tseng FY, Shau YW, Wang CL, Lin SC. Diabetic effects on microchambers and macrochambers tissue properties in human heel pads. Clin Biomech (Bristol, Avon) 2009;24:682–686. doi: 10.1016/j.clinbiomech.2009.06.005. [DOI] [PubMed] [Google Scholar]
- Hsu CC, Tsai WC, Shau YW, Lee KL, Hu CF. Altered energy dissipation ratio of the plantar soft tissues under the metatarsal heads in patients with type 2 diabetes mellitus: a pilot study. Clin Biomech (Bristol, Avon) 2007;22:67–73. doi: 10.1016/j.clinbiomech.2006.06.009. [DOI] [PubMed] [Google Scholar]
- Hsu TC, Lee YS, Shau YW. Biomechanics of the heel pad for type 2 diabetic patients. Clin Biomech (Bristol, Avon) 2002;17:291–296. doi: 10.1016/s0268-0033(02)00018-9. [DOI] [PubMed] [Google Scholar]
- Hsu TC, Wang CL, Shau YW, Tang FT, Li KL, Chen CY. Altered heel-pad mechanical properties in patients with Type 2 diabetes mellitus. Diabet Med. 2000;17:854–859. doi: 10.1046/j.1464-5491.2000.00394.x. [DOI] [PubMed] [Google Scholar]
- Isakov E, Budoragin N, Shenhav S, Mendelevich I, Korzets A, Susak Z. Anatomic sites of foot lesions resulting in amputation among diabetics and non-diabetics. Am J Phys Med Rehabil. 1995;74:130–133. [PubMed] [Google Scholar]
- Jahss MH, Kummer F, Michelson JD. Investigations into the fat pads of the sole of the foot: Heel pressure studies. Foot & Ankle. 1992;13:227–232. doi: 10.1177/107110079201300501. [DOI] [PubMed] [Google Scholar]
- Jahss MH, Michelson JD, Desai P, Kaye R, Kummer F, Buschman W, Watkins F, Reich S. Investigations into the fat pads of the sole of the foot: Anatomy and histology. Foot & Ankle. 1992;13:233–242. doi: 10.1177/107110079201300502. [DOI] [PubMed] [Google Scholar]
- Klaesner JW, Hastings MK, Zou DQ, Lewis C, Mueller MJ. Plantar tissue stiffness in patients with diabetes mellitus and peripheral neuropathy. Archives of Physical Medicine and Rehabilitation. 2002;83:1796–1801. doi: 10.1053/apmr.2002.35661. [DOI] [PubMed] [Google Scholar]
- Ledoux WR, Blevins JJ. The compressive material properties of the plantar soft tissue. J Biomech. 2007;40:2975–2981. doi: 10.1016/j.jbiomech.2007.02.009. [DOI] [PubMed] [Google Scholar]
- Ledoux WR, Hillstrom HJ. The distributed plantar vertical force of neutrally aligned and pes planus feet. Gait Posture. 2002;15:1–9. doi: 10.1016/s0966-6362(01)00165-5. [DOI] [PubMed] [Google Scholar]
- Lemmon DR, Shiang TY, Hashmi A, Ulbrecht JS, Cavanagh PR. The effect of insoles in therapeutic footwear: A finite-element approach. Journal of Biomechanics. 1997;30:615–620. doi: 10.1016/s0021-9290(97)00006-7. [DOI] [PubMed] [Google Scholar]
- Miller-Young JE, Duncan NA. Material properties of the human calcaneal fat pad: validation experiments. 4th World Congress of Biomechanics; Calgary, AB. 2002. [DOI] [PubMed] [Google Scholar]
- Miller-Young JE, Duncan NA, Baroud G. Material properties of the human calcaneal fat pad in compression: experiment and theory. J Biomech. 2002;35:1523–1531. doi: 10.1016/s0021-9290(02)00090-8. [DOI] [PubMed] [Google Scholar]
- Mueller MJ, Minor SD, Diamond JE, Blair VP., 3rd Relationship of foot deformity to ulcer location in patients with diabetes mellitus. Phys Ther. 1990;70:356–362. doi: 10.1093/ptj/70.6.356. [DOI] [PubMed] [Google Scholar]
- Pai S, Ledoux WR. The Effect of Target Strain Error on Plantar Tissue Stress. Journal of Biomechanical Engineering in press. 2009 doi: 10.1115/1.4001398. [DOI] [PMC free article] [PubMed] [Google Scholar]
- Palumbo PJ, Melton LJ. Diabetes in America. 2nd. Washington D.C.: National Diabetes Data Group; 1995. Peripheral vascular disease and diabetes; pp. 401–408. [Google Scholar]
- Paul RG, Bailey AJ. Glycation of collagen: the basis of its central role in the late complications of ageing and diabetes. Int J Biochem Cell Biol. 1996;28:1297–1310. doi: 10.1016/s1357-2725(96)00079-9. [DOI] [PubMed] [Google Scholar]
- Perry J. Gait analysis: Normal and pathological function. Thorofare, NJ: SLACK Incorporated; 1992. [Google Scholar]
- Piaggesi A, Romanelli M, Schipani E, Campi F, Magliaro A, Baccetti F, Navalesi R. Hardness of plantar skin in diabetic neuropathic feet. Journal of Diabetes and Its Complications. 1999;13:129–134. doi: 10.1016/s1056-8727(98)00022-1. [DOI] [PubMed] [Google Scholar]
- Reiber GE, Boyko EJ, Smith DG. Diabetes in America. M. I. Harris: NIDDK Pub No 95-1468; 1995. Lower extremity foot ulcers and amputations in diabetes; pp. 409–428. [Google Scholar]
- Reiber GE, Lipsky BA, Gibbons GW. The burden of diabetic foot ulcers. American Journal of surgery. 1998;176:5S–10S. doi: 10.1016/s0002-9610(98)00181-0. [DOI] [PubMed] [Google Scholar]
- Stockl K, Vanderplas A, Tafesse E, Chang E. Costs of lower-extremity ulcers among patients with diabetes. Diabetes Care. 2004;27:2129–2134. doi: 10.2337/diacare.27.9.2129. [DOI] [PubMed] [Google Scholar]
- Sumpio BE. Foot ulcers. N Engl J Med. 2000;343:787–793. doi: 10.1056/NEJM200009143431107. [DOI] [PubMed] [Google Scholar]
- Tietze A. Concerning the architectural structure of the connective tissue in the human sole. Foot & Ankle. 1982;2:252–259. doi: 10.1177/107110078200200502. [DOI] [PubMed] [Google Scholar]
- Ulbrecht JS, Cavanagh PR, Caputo GM. Foot problems in diabetes: an overview. Clin Infect Dis. 2004;39:S73–82. doi: 10.1086/383266. [DOI] [PubMed] [Google Scholar]
- Zheng YP, Choi YK, Wong K, Chan S, Mak AF. Biomechanical assessment of plantar foot tissue in diabetic patients using an ultrasound indentation system. Ultrasound Med Biol. 2000;26:451–456. doi: 10.1016/s0301-5629(99)00163-5. [DOI] [PubMed] [Google Scholar]