

Abstract
During joint articulation, cartilage is subjected to compression, shear, and sliding, mechanical factors that regulate and affect cartilage metabolism. The objective of this study was to use an in vitro material-on-cartilage shear test to elucidate the effects of counter-surface roughness (Polished, Mildly rough, and Rough), lubricants (phosphate buffered saline (PBS) and bovine synovial fluid (bSF)), and compression offset on the shearing and sliding of normal human talar cartilage under dynamic lateral displacement. Peak shear stress (σxz,m) and strain (Exz,m) increased with increasing platen roughness and compression offset, and were 30% higher with PBS than with bSF. Compared to PBS, bSF was more effective as a lubricant for P than for M and R platens as indicated by the higher reduction in kinetic friction coefficient (−60% vs. − 20% and −19%, respectively), σxz,m (−50% vs. −14% and −17%) and Exz,m (−54% vs. −19% and − 17%). Cartilage shear and sliding were evident for all counter-surfaces either at low compression offset (10%) or with high lateral displacement (70%), regardless of lubricant. An increase in tissue shear occurred with either increased compression offset or increased surface roughness. This material and biomechanical test system allow control of cartilage σxz,m and Exz,m, and hence, sliding magnitude, for an imposed lateral displacement. It therefore can facilitate study of cartilage mechanobiological responses to distinct regimes of cartilage loading and articulation, such as shear with variable amounts of sliding.
Keywords: Cartilage, Biomechanics, Shear, Surface Roughness, Friction
INTRODUCTION
Articular cartilage is a low-friction and wear-resistant connective tissue that deforms in response to joint loading. Knee cartilage is compressed by ~3–10% of its overall thickness following various physical activities, such as walking, cycling, running, and knee bending (Eckstein, et al., 2000, Kersting, et al., 2005). Under normal loading, talar cartilage is compressed by 5–35%, with 42% of the contact area having compressive strain higher than 15% (Wan, et al., 2008). Cartilage also deforms in shear when subjected to combined compression and shear loads. For normal adult femoral condyle cartilage tested with normal synovial fluid (SF), shear strain reached 5.6% near the articular surface and 2.8% overall, increasing markedly with degeneration to 28% and 4.1%, respectively (Wong, et al., 2008). After reaching a peak shear strain, with subsequent lateral motion, cartilage surfaces slide relative to each other while peak shear is maintained (Wong, et al., 2008). These mechanical parameters provide target values for this study.
One SF function is to reduce surface interaction and friction in the boundary mode, and therefore to modulate cartilage shear and sliding magnitudes during articulation. With apposing cartilage samples tested in the boundary mode, friction between surfaces is lower with SF lubricant than phosphate buffered saline (PBS) (Schmidt and Sah, 2007). Thus, surfaces reach peak shear sooner when lubricated with SF than with PBS, suggesting that with SF, for a given applied lateral displacement, surfaces slide earlier and experience greater sliding distances (Wong, et al., 2008).
Friction between cartilage surfaces dictates shear of the bulk tissue and depends on not only surface lubricant but also the counter-surface material and roughness. Friction between a variety of smooth biological and non-biological surfaces has been characterized, with boundary mode friction coefficients varying from 0.02 to 0.21 for glass-on-latex (Davis, et al., 1978, Jay, et al., 2004, Reimann, 1976), from 0.07 to 0.28 for glass-on-cartilage with intact surface (Basalo, et al., 2007, Gleghorn, et al., 2009), and from 0.02 to 0.26 for cartilage-on-cartilage (Schmidt and Sah, 2007). While such studies have elucidated cartilage friction against relatively smooth counter-surfaces, roughened counter-surface r may modulate interaction with cartilage surfaces and thus provide a means to control cartilage shear and sliding.
Mechanical cues resulting from joint loading and tissue deformation modulate chondrocyte and cartilage metabolism. Compression (Grodzinsky, et al., 2000, Sah, et al., 1989), hydrostatic pressure (Hall, et al., 1991, Parkkinen, et al., 1993), and shear (Jin, et al., 2001, Nugent, et al., 2006) of cartilage explants modulate metabolism of indwelling chondrocytes. In some shear stimulation studies, cartilage deformation has been induced by apposing cartilage surface to a rigid non-porous platen, imposing a fixed compressive displacement and a small lateral displacement (0.4 to 3%) (Jin, et al., 2001, Nugent, et al., 2006). Here, a no-slip boundary condition at the cartilage-platen interface is assumed for the relatively small amplitude lateral displacements to examine the isolated effect of shear on cartilage and chondrocyte metabolism. However, physiologically, large lateral displacements and sliding between surfaces occur during joint articulation. Continuous or intermittent sliding, in addition to the associated tissue shear, also stimulates chondrocyte biosynthesis and mRNA expression of lubricant molecules (Grad, et al., 2006). Thus, biomechanical responses of articular cartilage may be due to the extent of shear deformation and sliding between cartilage surfaces. The development and characterization of material surfaces to control cartilage shear and sliding magnitudes could be useful for cartilage mechanobiology studies and tissue engineering applications where defined levels of shear and sliding are applied in order to modulate matrix metabolism.
One possible approach to impose articulation to cartilage with distinct mechanical loading regimes (i.e. shear without sliding, relatively low shear with sliding, and relatively high shear with sliding) is to articulate cartilage against counter-surfaces with defined surface topography and in a specific lubricant solution. A polished counter-surface lubricated with bSF may impose minimal shear before sliding; a mildly rough counter-surface may impose moderate shear before sliding; and a rough counter-surface may impose large shear before sliding. Therefore, the objective of this study was to use an in vitro material-on-cartilage shear test to elucidate the effects of surface roughness (polished (P), mildly rough (M), and rough (R)) of polysulfone platens, lubricant (PBS vs. SF), and compression offset (10–30% strain or 0.05–0.2 MPa equilibrium stress) on tissue shear and sliding of normal human talar cartilage under dynamic shear displacement
METHODS
Sample Harvest
Thirty osteochondral blocks with macroscopically normal cartilage were isolated from the dome of human tali, three from each of 10 cadaveric donors (age of 61±2 years, mean±SE). The talus was used as a source of normal articular cartilage due to the low prevalence of degeneration and osteoarthritis in the talus, even with advanced age (Koepp, et al., 1999). Using an Isomet low-speed saw with a 0.3mm thick diamond-edge blade (Buehler, Lake Bluff, IL), blocks were trimmed to create a surface area of ~4×4mm2 and an underlying bone thickness of 1mm. Cartilage thicknesses were measured (±0.01mm) on each side of the block with Digimatic calipers (Mitutoyo, Los Angeles, CA) and averaged. To create the final samples consisting of a chondral disk affixed to underlying bone, a 3mmØ dermal punch (Miltex, Inc.) was applied to the center of each block and the surrounding cartilage was removed with a scalpel blade. Samples were immersed in PBS with protease inhibitors (PIs) (Frank, et al., 1987) during tissue harvest and preparation.
Counter-Surface Platens
Custom 8mmØ impermeable polysulfone platens were constructed with their articulating surfaces prepared to target roughness. Platen surfaces were either polished (P) with Novus fine scratch removers (Savage, MN), mildly roughened (M) with Ballotini glass beads (Potters Industry, Malvern, PA), or roughened (R) with 80 grit sand. Arithmetic average roughness (Ra) of platens was characterized using WYKO MHT-III optical profiler (Veeco Instruments, Plainview, NY) before and after mechanical tests. For each platen, Ra was determined in 5 areas (~0.25mm2/area) on the region of platen which was in contact with cartilage during shear testing. Surface roughness of the platens was generally maintained, with initial and final Ra values (mean±SD) being 0.12±0.01 and 0.12±0.01μm, 1.3±0.1 and 1.00±0.03μm, and 8.0±0.8 and 7.1±0.1μm for P, M, and R platens, respectively. From pilot experiments, these platens could induce a wide range of tissue shear, ranging from small (~1%) to moderate (8%) levels.
Experimental Design
Samples were harvested during the day, soaked in PBS+PIs overnight, and mechanical tested the following day, resulting in 20–28 hour period in PBS+PIs between time of harvest and time of testing. Each sample was mechanically tested with a designated platen type (P, M, R), as described below, with PBS+PIs as lubricant, allowed to re-swell overnight in bovine SF (bSF) +PIs, and then re-tested with bSF+PIs. The bSF had been pooled from adult animals and characterized previously (see Electronic Supplement).
Mechanical Shear Test
Each sample was affixed at its base to a custom stainless steel chamber with the articular surface facing up. The bottom bone surface was secured to the chamber floor with adhesive Loctite® Super-Glue (Henkle, CT) to ensure a no-slip boundary condition. The chamber was then mounted to a horizontal actuator of a benchtop mechanical tester (Mach-1™ V500, Biosyntech Canada, Montreal). A clean counter-surface platen was mounted to the mechanical tester and in direct apposition to the articular cartilage surface.
Axial Displacement-Controlled Shear Tests
Tests were performed on samples from different donors (n=6) for each of three platen types. Samples were compressed initially to 10% against the surface-finished platen at 0.5μm/s and allowed to stress-relax for 0.5h while axial forces were recorded. Preliminary tests indicated that for Ø3mm cartilage disks, axial load reached 95% of its equilibrium value after ~15 minutes of relaxation (data not shown). At equilibrium, 3 cycles of forward and reverse lateral displacement with amplitude of 30% of compressed thickness were applied at a rate of 100μm/s while lateral position and force were recorded. Lateral displacement amplitude was selected such that the resultant tissue shear strain was comparable to that of degenerated cartilage (Wong, et al., 2008). Subsequently, samples were compressed to 20%, and then 30% offset, at which the lateral displacement cycles were repeated (Fig. 1).
Figure 1.

Mechanical loading sequence. (A) Samples were compressed to 3 levels, δ1, δ2, and δ3 and allowed to stress-relax for 30 minutes. δ1, δ2, and δ3 are either 10, 20, 30% strain relative to initial thickness or compression levels to achieve 0.05, 0.1, and 0.2 MPa equilibrium compressive stress. (B) After relaxation, 3 cycles of lateral displacement of Upx (30% or 70% of the compressed thickness) were applied. (C) The time axis was expanded to show details of the applied lateral displacements.
Axial Load-Controlled Shear Tests
Tests were performed on samples from different donors (n=4) for each of three platen types. Samples were shear tested similarly to those described above, but instead at compression levels calculated (based on preliminary displacement-controlled tests) to achieve equilibrium compressive stress values of 0.05, 0.1, and 0.2MPa. Additionally, a 70% lateral displacement was applied to ensure sliding and maximum shear deformation for all cases.
Data Analysis
Equilibrium compressive stress (σzz,eq), peak shear stress (σxz,m), and peak shear strain (Exz,m) were determined using Matlab (Mathworks, MA) from the recorded forces and displacements during applied axial and lateral loading. Under compression alone, σzz,eq was calculated as the average of axial forces in the last minute of stress-relaxation normalized to the contact area. Under compression and lateral loading, absolute values of the maximum and minimum lateral forces were normalized to the initial contact area and averaged for the last two of the three cycles of lateral displacement to yield an estimate of σxz,m. Since lateral displacement was applied in +x and −x directions, σxz,m was defined as the mean of +x and −x amplitudes if their difference was small (<5%) or as the higher amplitude if their difference was large (>5%).
The maximum resultant lateral tissue displacement (Ux) was calculated as the difference in lateral position at the initial peak and zero lateral force. For small deformation, |Ux|, normalized to the compressed thickness (h), provided an estimate of shear strain Exz,m, defined analogously to σxz,m.
Since sliding was observed for all samples shear tested under controlled compressive-stresses with 70% applied lateral displacement, the coefficient of kinetic friction (μkinetic) was calculated as the ratio of σxz,m to σzz,eq.
Statistical Analysis
Data are presented as mean±SEM. The effects of platen roughness (P, M, R), lubricant (PBS, bSF) and compression offset (10, 20 and 30% or 0.05, 0.1, and 0.2MPa) were assessed by ANOVA with lubricant and compression as repeated factors. Planned pair-wise comparisons were used to assess the differences between P, M, and R groups for σxz,m and Exz,m at each compression offset.
QUALITATIVE PREDICTION OF LATERAL FORCE AND STRESS
During platen-on-cartilage articulation, cartilage deformation ux(t), and corresponding lateral force response Fx(t) increase with increasing applied lateral displacement upx, reach a peak (Ux, Fx,m), and maintain steady-state with increasing upx (Fig. 2). However, surface sliding depends on the applied lateral displacement (Upx) being high enough to overcome the friction between contacting surfaces and cause surfaces to detach and slide. Since a finite lateral displacement is applied in practical test configurations, sliding may not occur in all cases, depending on tissue-platen surface interaction. In particular, lateral force responses are predicted to fall into one of three following cases:
Figure 2.

Schematics of applied dynamic lateral displacement (A, C, and E), expected patterns of lateral force response (B, D, and F) and predicted relationships between loading platen and cartilage tissue (illustrations) in three regimes: full adhesion, moderate friction with relatively high shear, and low friction with relatively low shear, respectively. Loading platen has compressed cartilage by displacement d, and then translates laterally between upx = 0 and upx = Upx during the period T. Other variables and parameters, ux(t), Fx(t), upx, Ux, and Fx,m are described in the text. (A, B) When the lateral displacement is relatively small (< Ux), the tissue deforms without sliding. (C, D). When the lateral displacement is intermediate (between Ux and 2Ux) with moderate friction, cartilage underwent relatively high shear. (E, F) When the displacement is relatively large (> 2Ux) with low friction, cartilage underwent relatively low shear in all cycles.
Regime I – (Upx<Ux, complete adhesion of platen to cartilage surface) The lateral force profile mirrors that of the upx, indicating surfaces did not detach and slide (Fig. 2A,B).
Regime II – (Ux<Upx<2Ux, moderate friction) The lateral force response reaches a plateau in the 1st cycle, but does not in subsequent cycles, indicating relatively high shear st (Fig. 2C,D)
Regime III – (Upx<2Ux, low friction) The resultant lateral force reaches a plateau for all cycles, indicating relatively low shear in all cycles (Fig. 2E,F).
RESULTS
Axial-Displacement Controlled Tests
Average lateral force responses (n=6) followed one of the 3 regimes (I, II, or III) described above for compressive-strain controlled tests (Fig. 3). At 10% compression and with P platen, regime III was observed regardless of lubricant used (Fig. 3A). With increased compression (Fig. 3B,C) or counter-surface roughness (Fig. 3D,G), force responses shifted toward regime II. At 30% compression, a combination of regime II was evident for both lubricants (Fig. 3I). Lateral force and corresponding shear stress were lower in magnitude for samples tested with bSF than with PBS at low compression (10–20%) and with smooth (P) platen. The lubricating function of SF diminished at high compression (30%) and with rougher platens (M, R), such that lateral force and corresponding shear stress were not distinguishably different between PBS and bSF groups (Fig. 3F,I).
Figure 3.

The effects of the compression offset (10, 20, and 30%), counter-surface roughness ((A, B, C) polished, (D, E, F) mildly rough, and (G, H, I) rough platen), and lubricant type (PBS and bSF) on the average lateral force and corresponding shear stress over 3 cycles of dynamic lateral displacement e. Lateral displacement was applied at equilibrium after compression by (A, D, G) 10%, (B, E, H) 20%, and (C, F, I) 30%. Samples were tested in lubricant baths of PBS and then bovine synovial fluid. Data shown are average values with SEM shown for selected data points near peak values, n=6.
Equilibrium compressive stress was not significantly different between samples tested with different platens (p=0.9) and increased markedly with increasing compressive strain (p<0.001) (Fig. 4A). Despite being statistically significant (p<0.01), the difference between σ zz,eq with bSF and σ zz,eq with PBS was small (8%) compared to σ zz,eq variation between donors (~29%). At 10, 20, and 30% compression, average σ zz,eq values for all platens were 0.09, 0.23, and 0.42MPa, respectively.
Figure 4.

Biomechanics of shearing-sliding for samples compressed by 10, 20, and 30% in lubricant baths of PBS and then bovine synovial fluid. Samples were tested with platens that had polished (P, Ra=0.12μm), mildly rough (M, Ra=1.3μm), and rough (R, Ra=8.0μm) counter-surface. (A) Equilibrium compressive stress. (B,C,D) Maximum shear stress. (E,F,G) Maximum shear strain [% compressed thickness]. Data shown are mean ± SEM, n=6.
Cartilage σxz,m changed markedly with compression (p<0.001), platen roughness (p<0.05), and lubricant (p<0.01), with compression and lubricant having interactive effects with platen roughness (p<0.05) (Fig. 4B,C,D). With increasing compression offset from 10% to 30%, σxz,m increased markedly from 0.03MPa to 0.09MPa for P platen in PBS. Similarly, σxz,m increased from 10 to 20% compression, but did not increase further at 30% compression for M and R platens in PBS. Similar trends were observed for bSF. At high compression level (30%) in bSF, σxz,m was lower in samples tested with P platen than with M and R platens (p<0.05 and p<0.005), with no apparent differences between M and R platens (p=0.27–0.88). Bovine SF reduced σxz,m by 9–45% when compared to PBS, except for M and R platens at high (30%) compression. Correspondingly, Exz,m was markedly affected by compression (p<0.001), platen roughness (p<0.05), and lubricant (p<0.001), with significance patterns being similar to those observed for σxz,m (Fig. 4E,F,G).
Axial-Load Controlled Tests
Cartilage σxz,m was affected markedly by compression (p<0.001), platen roughness (p<0.001), and lubricant (p<0.01), with compression and lubricant having interactive effects with platen roughness (p<0.05) (Fig. S2, S3, Electronic Supplement).
Kinetic friction coefficient was significantly affected by platen roughness (p<0.001), lubricant (p<0.001), and compression (p<0.05) (Fig. 5). The overall variation in μkinetic due to compression was small (5%), but significant (p<0.05). M and R platens had markedly higher μkinetic (+40 and +144%) than P platen when PBS was used. A similar effect of platen roughness on μkinetic was found with bSF. Overall, μkinetic decreased markedly, by 60, 20, and 19%, for samples tested with P, M, and R platens in bSF lubricant than in PBS.
Figure 5.
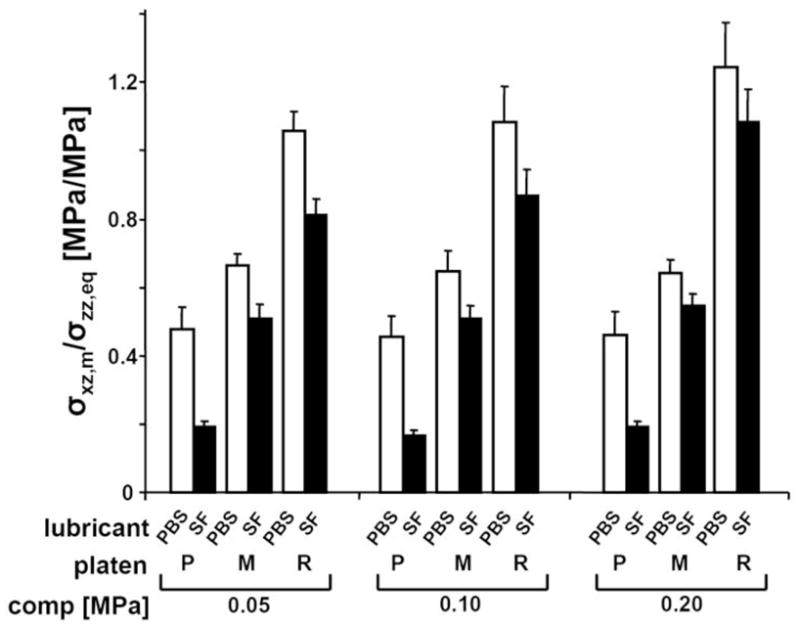
Coefficient of kinetic friction for samples compressed by 0.05, 0.1, and 0.2 MPa stress levels. Samples were tested in lubricant bath of PBS and then bovine synovial fluid and with platens that had polished (P), mildly rough (M), and rough (R) surface. Data shown are mean ± SEM, n=4.
The repeated mechanical tests of the cartilage samples had slight effects on the articular surface structure (Fig. S1, Electronic Supplement).
DISCUSSION
The present study described and characterized a novel biomechanical testing system that can induce a range of σxz,m and Exz,m in cartilage according to the levels of applied compression and lateral displacement, roughness of a counter-surface platen, and lubricant. Regime II (moderate friction and relatively high shear) occurred for several conditions (Fig. 3E,F,H,I), typically with a combination of high compression and moderate to rough counter-surfaces. Regime III (low friction and relatively low shear) was evident for all counter-surfaces and lubricant conditions at low compression (10%) or at high lateral displacement (70%) (Fig. 3A,B,C,D,G, S2). Cartilage σxz,m, Exz,m, and μkinetic increased significantly with increasing compression and counter-surface roughness, and were higher with PBS lubricant than with bSF. Values of σxz,m and Exz,m at 10% (or 0.1MPa) compression were 65% and 70% lower than those at 20% (0.1MPa) and 30% (0.2 MPa), and σxz,m and Exz,m were ~30% higher with PBS lubricant than with bSF. The lubricating effect of bSF was more apparent for a smooth (P) counter-surface than for rougher (M, R) counter-surfaces as indicated by a higher reduction in σxz,m (− 50% vs. − 14% and − 17%) and Exz,m (− 54% vs. − 19% and − 17%) when compared to PBS. Bovine SF also reduced μkinetic ~2.5 fold for the smooth (P) counter-surface compared to ~1.25 fold for rougher (M, R) counter-surfaces (Fig. 5).
The use of the ankle talar dome as the only source of tissue may limit the interpretations of this study although it offered some advantages. In the donor age group (~51–78) used in the present study, talar dome cartilage has a lower prevalence of age-related degeneration than the knees of the same individual (Koepp, et al., 1999). Therefore, macroscopically normal tissue was easily accessible. Results of this study may be used to predict qualitatively shear and sliding behaviors of cartilage from other joints such as hips and knees. However, specific values may differ since cartilage mechanical properties vary remarkably across joints (Kempson, 1991, Kuettner and Cole, 2005, Treppo, et al., 2000). Cartilage from other articulating joints either healthy or osteoarthritic, could be analyzed for shear and friction properties in future studies.
The current testing protocol can produce a shear strain environment that mimics certain aspects of articulating cartilage with either normal (smooth) or slightly degenerate (roughened) surfaces. With smooth (P) counter-surface and bSF, Exz,m ranged from 1 to 4%, which was comparable to that of normal cartilage (3–6%) determined from in vitro micro-shear tests (Wong, et al., 2008). Under similar loading conditions with rough (M, R) counter-surfaces and with bSF, Exz,m was ~2–8%, comparable to those previously reported for degenerate cartilage (4–8%) (Wong, et al., 2008). Thus, a smooth (P) counter-surface may be suitable to mimic articulation tests with normal cartilage. Rougher (M, R) counter-surfaces resulted in Exz,m above normal (up to >5%), and thus, may be suitable to induce supra-normal Exz,m typical of that occurring during articulation of degenerate cartilage. The extent of shear and sliding of articular cartilage tested with platens having a similar range of counter-surface roughnesses was consistent qualitatively with microscopic views of shear loaded tissue (data not shown). The method of calculating shear strain used in this study provided the overall shear strain assuming constant contact area and infinitesimal deformation (more discussion in Electronic Supplement).
Reduction in σxz,m and Exz,m with the use of SF is consistent with previous studies on cartilage friction and shear. Lubricant molecules in SF reduce friction (Schmidt, et al., 2007), σxz,m and Exz,m (Wong, et al., 2008) in cartilage-on-cartilage articulation tests. This is consistent with the effect of SF lubrication in the present study, allowing surfaces to slide sooner and undergo a greater sliding magnitude. With roughened (M, R) counter-surfaces, crevices are present for opposing tissue to fill, increasing surface interaction and friction. With such counter-surfaces, greater lateral displacements, and thus σxz,m, are necessary to overcome this interaction and induce surface sliding. The lesser apparent lubricating effects of SF with rough surfaces is likely due to higher friction dominated by the inter-locking of tissue into these crevices as opposed to the adherence between polished surfaces.
The values of cartilage μkinetic determined in this study were generally consistent with values reported in other studies on cartilage friction with PBS and SF as lubricants. When samples were lubricated with bSF and articulated against a smooth (P) counter-surface, μkinetic was within the same order of magnitude of friction between cartilage-on-glass (0.15–0.28) (Gleghorn and Bonassar, 2008, Krishnan, et al., 2004), and bovine cartilage-on-cartilage in saline (0.20–0.26) (Schmidt and Sah, 2007).However, even with a smooth surface (P) and lubricant (SF) conditions that produce the nominal μkinetic (0.18) in the current testing configuration, μkinetic was still ~12-fold higher than that in cartilage-on-cartilage tests with SF as lubricant (Schmidt and Sah, 2007). Such a result suggests that the friction-reducing function of SF is less effective for non-biologic material (i.e. polysulfone) possibly due to the inability of SF lubricant molecules to adhere to this type of counter-surface. The values of μkinetic from samples tested against rough (M, R) counter-surface were ~2–4 times higher than those reported for cartilage- on-cartilage or cartilage-on-glass in saline. Supra-normal (high friction) lubrication or alternative surfaces would be useful for imposing sliding with shear strain at physiological or sup-physiological levels.
The testing protocol used in this study provides mechanical environments that can mimic compressive loading of cartilage in normal/low-impact (i.e. 10–20% strain and 0.05–0.1MPa stress) and pathologic/high-impact (i.e. 30% strain and 0.2MPa stress) states. Under normal loading, ankle cartilage appears to experience a wide range of compression, averaging 7.5% and peaking at ~35% at the lateral region (Wan, et al., 2008). Similar to a previous study (Wong, et al., 2008), the present analysis investigated a time point in gait where compressive loading is high and sliding velocity is low, at which time surface interaction is likely to be high. In addition, samples were tested under compressive equilibrium conditions attained after 0.5h of stress-relaxation. At this point, cartilage deformation and strain is likely to be representative of that occurring after prolonged cyclic loading and sliding, as opposed to the onset of loading. The testing regime with slow sliding velocity, high compressive load, and invariance of μkinetic with applied load, together with minimal fluid pressurization (see detailed discussion in Electronic Supplement) is consistent with a predominant boundary mode of lubrication.
These results suggest that cartilage σxz,m, Exz,m, and sliding may be modulated and controlled by compression, counter-surface roughness, and lubricant. Previous research has focused on the isolated effect of shear on cartilage and chondrocyte metabolism. However, the physiological environment induces a combination of mechanical factors, particularly Exz,m, and sliding. The relative surface motion during sliding might further alter biomechanical and biochemical responses of cartilage by modulating the local microenvironment at the cartilage surface. Controlling such tissue parameters may be important to further understand their roles in cartilage homeostasis, growth, and pathology as well as their importance in cartilage tissue engineering.
Supplementary Material
Table 1.
List of variables and parameter that were used to describe biomechanics of shearing-sliding of cartilage samples as noted in Figure 2 and in the text.
| Variable | Description | Units |
|---|---|---|
| Fx(t) | lateral load | N |
| t | time | s |
| ux(z,t) | resultant lateral displacement (of tissue) | μm |
| upx(t) | applied lateral displacement (of platen) | μm |
| usx(t) | lateral displacement at superficial surface | μm |
| z | axial position | μm |
| Parameter | Description | Units |
|---|---|---|
| δ | change in cartilage thickness, δ = h0 – h | μm |
| Exz,m | maximum shear strain | % |
| Fx,m | maximum lateral load | N |
| h | compressed thickness | μm |
| h0 | initial thickness | μm |
| σxz,m | maximum shear stress | MPa |
| T | cycle period (time interval over which upx(t) changes from 0 to Upm, and back to 0) | s |
| Tm | duration for shear to change from 0 to Ux | s |
| Ts | duration over which sliding occurs | s |
| Us | distance over which sliding occurs | μm |
| Ux | maximum resultant lateral displacement | μm |
| Upx | maximum applied lateral displacement | μm |
| UpR | maximum lateral displacement to the right | μm |
| UpL | maximum lateral displacement to the left | μm |
Acknowledgments
This work was supported by NIH and Howard Hughes Medical Institute through the Professors Program Grant to UCSD for Dr. Robert L. Sah.
Footnotes
CONFLICT OF INTEREST
The authors have no conflicts of interest to disclose.
Publisher's Disclaimer: This is a PDF file of an unedited manuscript that has been accepted for publication. As a service to our customers we are providing this early version of the manuscript. The manuscript will undergo copyediting, typesetting, and review of the resulting proof before it is published in its final citable form. Please note that during the production process errors may be discovered which could affect the content, and all legal disclaimers that apply to the journal pertain.
References
- Basalo IM, Chahine NO, Kaplun M, Chen FH, Hung CT, Ateshian GA. Chondroitin sulfate reduces the friction coefficient of articular cartilage. J Biomech. 2007;40:1847–1854. doi: 10.1016/j.jbiomech.2006.07.007. [DOI] [PubMed] [Google Scholar]
- Davis WHJ, Lee SL, Sokoloff L. Boundary lubricating ability of synovial fluid in degenerative joint disease. Arthritis Rheum. 1978;21:754–760. doi: 10.1002/art.1780210703. [DOI] [PubMed] [Google Scholar]
- Eckstein F, Lemberger B, Stammberger T, Englmeier KH, Reiser M. Patellar cartilage deformation in vivo after static versus dynamic loading. J Biomech. 2000;33:819–825. doi: 10.1016/s0021-9290(00)00034-8. [DOI] [PubMed] [Google Scholar]
- Frank EH, Grodzinsky AJ, Koob TJ, Eyre DR. Streaming potentials: a sensitive index of enzymatic degradation in articular cartilage. J Orthop Res. 1987;5:497–508. doi: 10.1002/jor.1100050405. [DOI] [PubMed] [Google Scholar]
- Gleghorn JP, Bonassar LJ. Lubrication mode analysis of articular cartilage using Stribeck surfaces. J Biomech. 2008;41:1910–1918. doi: 10.1016/j.jbiomech.2008.03.043. [DOI] [PubMed] [Google Scholar]
- Gleghorn JP, Jones AR, Flannery CR, Bonassar LJ. Boundary mode lubrication of articular cartilage by recombinant human lubricin. J Orthop Res. 2009;27:771–777. doi: 10.1002/jor.20798. [DOI] [PubMed] [Google Scholar]
- Grad S, Lee CR, Wimmer MA, Alini M. Chondrocyte gene expression under applied surface motion. Biorheology. 2006;43:259–269. [PubMed] [Google Scholar]
- Grodzinsky AJ, Levenston ME, Jin M, Frank EH. Cartilage tissue remodeling in response to mechanical forces. Annu Rev Biomed Eng. 2000;2:691–713. doi: 10.1146/annurev.bioeng.2.1.691. [DOI] [PubMed] [Google Scholar]
- Hall AC, Urban JPG, Gehl KA. The effects of hydrostatic pressure on matrix synthesis in articular cartilage. J Orthop Res. 1991;9:1–10. doi: 10.1002/jor.1100090102. [DOI] [PubMed] [Google Scholar]
- Jay GD, Elsaid KA, Zack J, Robinson K, Trespalacios F, Cha CJ, Chichester CO. Lubricating ability of aspirated synovial fluid from emergency department patients with knee joint synovitis. J Rheumatol. 2004;31:557–564. [PubMed] [Google Scholar]
- Jin M, Frank EH, Quinn TM, Hunziker EB, Grodzinsky AJ. Tissue shear deformation stimulates proteoglycan and protein biosynthesis in bovine cartilage explants. Arch Biochem Biophys. 2001;395:41–48. doi: 10.1006/abbi.2001.2543. [DOI] [PubMed] [Google Scholar]
- Kempson GE. Age-related changes in the tensile properties of human articular cartilage: a comparative study between the femoral head of the hip joint and the talus of the ankle joint. Biochim Biophys Acta. 1991;1075:223–230. doi: 10.1016/0304-4165(91)90270-q. [DOI] [PubMed] [Google Scholar]
- Kersting UG, Stubendorff JJ, Schmidt MC, Bruggemann GP. Changes in knee cartilage volume and serum COMP concentration after running exercise. Osteoarthritis Cartilage. 2005;13:925–934. doi: 10.1016/j.joca.2005.06.005. [DOI] [PubMed] [Google Scholar]
- Koepp H, Eger W, Muehleman C, Valdellon A, Buckwalter JA, Kuettner KE, Cole AA. Prevalence of articular cartilage degeneration in the ankle and knee joints of human organ donors. J Orthop Sci. 1999;4:407–412. doi: 10.1007/s007760050123. [DOI] [PubMed] [Google Scholar]
- Krishnan R, Caligaris M, Mauck RL, Hung CT, Costa KD, Ateshian GA. Removal of the superficial zone of bovine articular cartilage does not increase its frictional coefficient. Osteoarthritis Cartilage. 2004;12:947–955. doi: 10.1016/j.joca.2004.08.009. [DOI] [PMC free article] [PubMed] [Google Scholar]
- Kuettner KE, Cole AA. Cartilage degeneration in different human joints. Osteoarthritis Cartilage. 2005;13:93–103. doi: 10.1016/j.joca.2004.11.006. [DOI] [PubMed] [Google Scholar]
- Nugent GE, Aneloski NM, Schmidt TA, Schumacher BL, Voegtline MS, Sah RL. Dynamic shear stimulation of bovine cartilage biosynthesis of proteoglycan 4 (PRG4) Arthritis Rheum. 2006;54:1888–1896. doi: 10.1002/art.21831. [DOI] [PubMed] [Google Scholar]
- Parkkinen JJ, Ikonen J, Lammi MJ, Laakkonen J, Tammi M, Helminen HJ. Effects of cyclic hydrostatic pressure on proteoglycan synthesis in cultured chondrocytes and articular cartilage explants. Arch Biochem Biophys. 1993;300:458–465. doi: 10.1006/abbi.1993.1062. [DOI] [PubMed] [Google Scholar]
- Reimann I. Pathological human synovial fluids. Viscosity and boundary lubricating properties. Clin Orthop Rel Res. 1976;119:237–241. [PubMed] [Google Scholar]
- Sah RL, Kim YJ, Doong JH, Grodzinsky AJ, Plaas AHK, Sandy JD. Biosynthetic response of cartilage explants to dynamic compression. J Orthop Res. 1989;7:619–636. doi: 10.1002/jor.1100070502. [DOI] [PubMed] [Google Scholar]
- Schmidt TA, Gastelum NS, Nguyen QT, Schumacher BL, Sah RL. Boundary lubrication of articular cartilage: role of synovial fluid constituents. Arthritis Rheum. 2007;56:882–891. doi: 10.1002/art.22446. [DOI] [PubMed] [Google Scholar]
- Schmidt TA, Sah RL. Effect of synovial fluid on boundary lubrication of articular cartilage. Osteoarthritis Cartilage. 2007;15:35–47. doi: 10.1016/j.joca.2006.06.005. [DOI] [PubMed] [Google Scholar]
- Treppo S, Koepp H, Quan EC, Cole AA, Kuettner KE, Grodzinsky AJ. Comparison of biomechanical and biochemical properties of cartilage from human knee and ankle pairs. J Orthop Res. 2000;18:739–748. doi: 10.1002/jor.1100180510. [DOI] [PubMed] [Google Scholar]
- Wan L, de Asla RJ, Rubash HE, Li G. In vivo cartilage contact deformation of human ankle joints under full body weight. J Orthop Res. 2008;26:1081–1089. doi: 10.1002/jor.20593. [DOI] [PubMed] [Google Scholar]
- Wong BL, Bae WC, Chun J, Gratz KR, Sah RL. Biomechanics of cartilage articulation: effects of lubrication and degeneration on shear deformation. Arthritis Rheum. 2008;58:2065–2074. doi: 10.1002/art.23548. [DOI] [PubMed] [Google Scholar]
- Wong BL, Bae WC, Gratz KR, Sah RL. Shear deformation kinematics during cartilage articulation: effect of lubrication, degeneration, and stress relaxation. Mol Cell Biomech. 2008;5:197–206. [PMC free article] [PubMed] [Google Scholar]
Associated Data
This section collects any data citations, data availability statements, or supplementary materials included in this article.