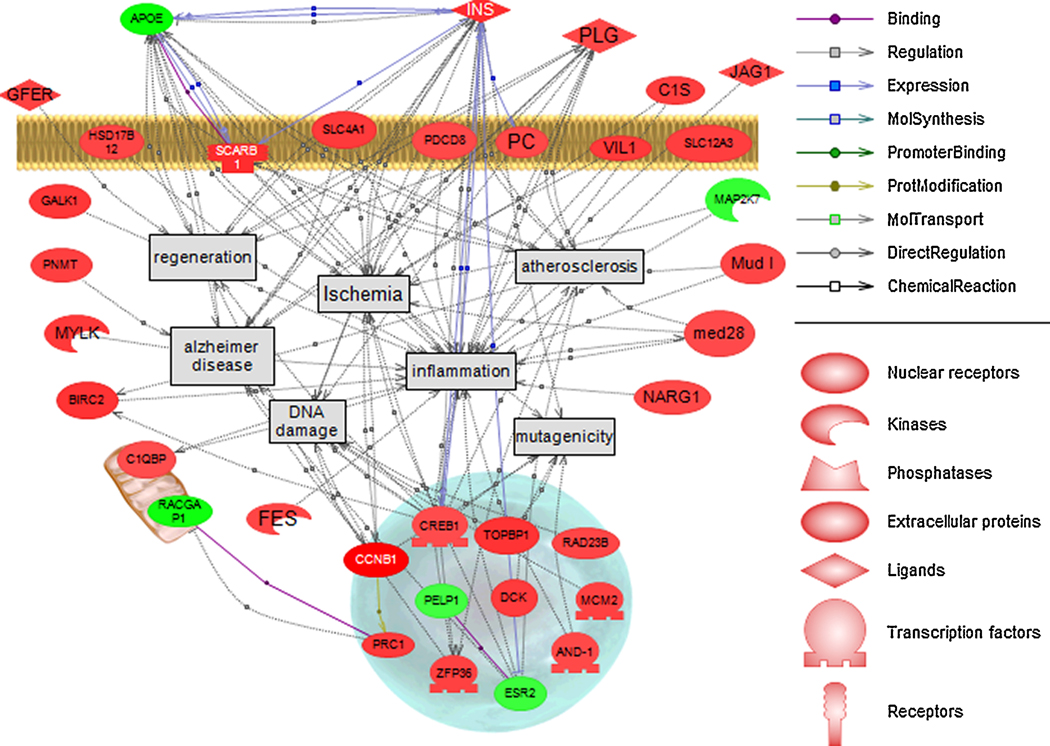
Figure 3.
Pathway analysis of disease associations in the hypothalamus (genes regulated at p<0.001; fold change > ±1.5). Green indicates a down-regulation in the gene and red indicates an induction in gene expression. Each connection has two or more references supporting the association or relationship. Note that dieldrin-mediated genes are located in a variety of cellular compartments and are predominantly induced after treatment.

