Abstract
The distance of hole migration through DNA determines the degree to which radiation induced lesions are clustered. It is the degree of clustering that confers to ionizing radiation its high toxicity. The migration distance is governed by a competition between hole transfer and irreversible trapping reactions. An important type of trapping is reactions that lead to formation of deoxyribose radicals, which are precursors to free base release (fbr). Using HPLC, fbr was measured in X-irradiated films of d(CGCGCGCGCG)2 and d(CGCGAATTCGCG)2 as well as three genomic DNAs: M. luteus, calf thymus, and C. perfringens. The level of DNA hydration was varied from Γ = 2.5 to 22 mol waters/mol nucleotide. The chemical yields of each base, G(base), were measured and used to calculate the modification factor, M(base). This factor compensates for differences in the GC/AT ratio, providing a measure of the degree to which a given base influences its own release. In the DNA oligomers, M(Gua) > M(Cyt), a result ascribed to the previously observed end effect in short oligomers. In the highly polymerized genomic DNA, we found that M(Cyt) > M(Gua) and that M(Thy) is consistently the smallest of the M factors. For these same DNA films, the yields of total DNA trapped radicals, Gtot(fr), were measured using EPR spectroscopy. The yield of deoxyribose radicals was calculated using GdRib(fr) = ∼0.11 × Gtot(fr). Comparing GdRib(fr) with total free base release, we found that only about half of the fbr is accounted for by deoxyribose radical intermediates. We conclude that for a hole on cytosine, Cyt•+, base-to-base hole transfer competes with irreversible trapping by the deoxyribose. In the case of a hole on thymine, Thy•+, base-to-base hole transfer competes with irreversible trapping by methyl deprotonation. Close proximity of Gua protects the deoxyribose of Cyt but sensitizes the deoxyribose of Thy.
INTRODUCTION
Hole transfer in DNA is of interest in areas such as the use of DNA to build nanocircuits 1 and in predicting the health risk associated with the formation of DNA damage by ionizing radiation2,3. In the case of radiation damage, DNA holes (one-electron loss sites) are produced both by direct ionization of the DNA and by transfer of holes from DNA-bound water to DNA itself.4,5 This type of DNA damage is called direct-type damage. As for the holes formed in bulk water, the water radical cation deprotonates to give OH•. Reactions of OH• with DNA produce indirect-type damage. In the nucleus of cells, the concentration of DNA is very high;6 under these conditions, the direct effect is found to account for ∼50% of the DNA damage7. It has been argued, based on the ratio of unbound water to DNA plus protein, that direct-type damage should account for at least 60% of the total DNA damage in mammalian cells.8
A key factor in determining the biological impact of radiation-induced damage is the distance of hole migration through DNA. Migration distance governs the degree to which the track of ionizations expands. This expansion decreases the degree to which the damage is clustered. It is clustered damage that results in high levels of DNA misrepair, which in turn leads to an increased risk of cancer induction.2,9 At a mechanistic level, the distance of hole migration is governed by competition between hole-transfer and irreversible hole-trapping.
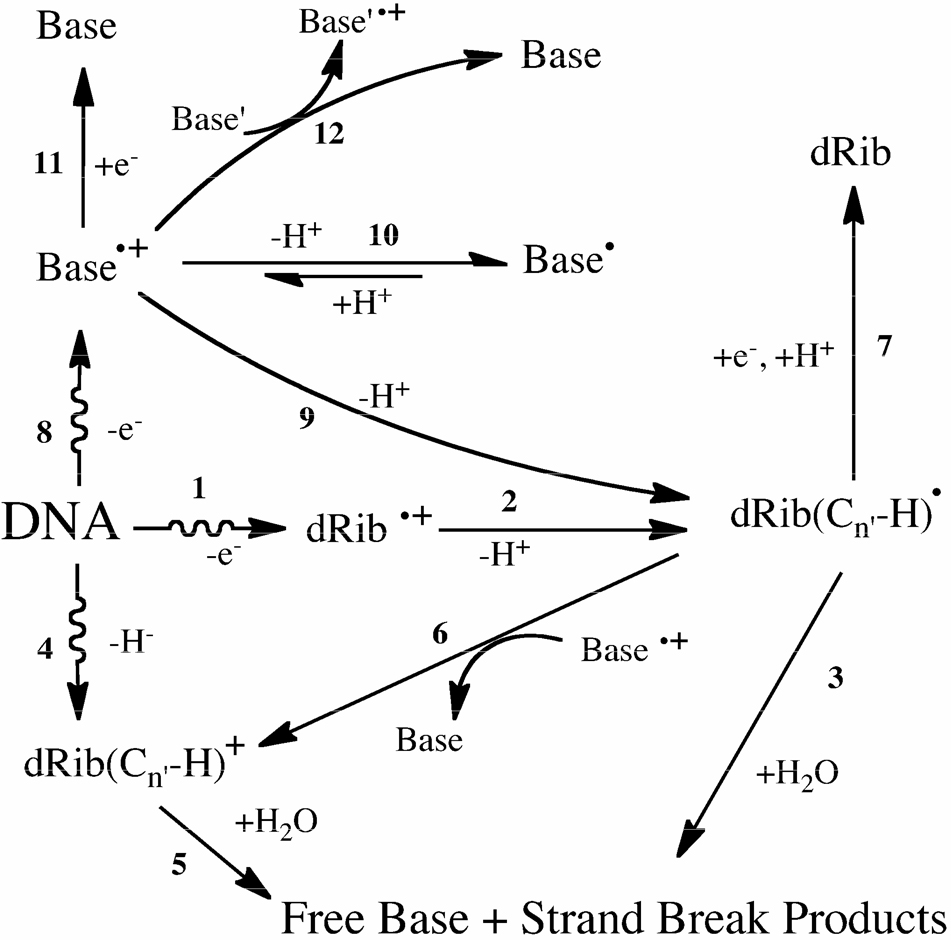
An overview of the reactions initiated by direct ionization of DNA is shown in Scheme 1. The initial species due to one-electron loss are the base radical cations Base•+ and the backbone radical cations dRib•+. Two-electron loss leads to carbocations dRib(Cn'-H)+. This occurs via two different pathways: i) a spur reaction whereby two electrons and one proton are lost and ii) ionization of the deoxyribose (Reaction 1) followed by deprotonation (Reaction 2) followed by electron transfer to a nearby base radical cation (Reaction 6). All of the reactions stemming from these short-lived species occur in the solid state (DNA films) except for Reactions 3 and 5, which occur when the films are dissolved in water. As shown in 3 and 5, oxidation of deoxyribose ultimately leads to release of unaltered free bases. By measuring free base release (fbr) a quantitative measure of deoxyribose damage can be obtained, as done by Swarts et al10 in a study on salmon sperm DNA. They found that release of each of the four nucleobases was about the same; i.e., fbr appeared to be independent of the type of base. In a recent study of a series of oligodeoxynucleotides, we found that fbr depends on the base and its context.11
Scheme 1.
Primary reaction pathways leading to free base release by DNA exposed to the direct effect of ionizing radiation. The radical pathway, 1–2–3, is initiated by electron ejection from the DNA backbone, 1, followed by deprotonation at a dRib carbon, 2, to give the neutral radical dRib(Cn'-H)• that, when the DNA film is dissolved in water, leads to fbr, 3.28 The molecular pathway, 4, contains no trappable radical intermediate; spur reactions produce a deoxyribose carbocation, dRib(Cn'-H)+, that in the presence of water, 5, yields fbr.29 Alternatively, dRib(Cn'-H)+ can be formed via 1–2–6, in which dRib(Cn'-H)• is oxidized by Base•+, a base centered hole that must be in close proximity to dRib(Cn'-H)•. Migration of a hole through the base stack increases the likelihood of 6. Competing with base-to-base hole transfer, Reaction 12, are three reactions: 9 - an alternative route to dRib(Cn'-H)•, 10 - trapping of the hole by deprotonation at the base, which can be reversible, and 11 - a back reaction to parent base. Another back Reaction is 7, which reconstitutes the parent dRib.
The dependency of fbr on base context draws attention to Reaction 6 (Scheme 1) due to its base dependence. Base•+ is required to drive the reaction forward by oxidizing dRib(Cn'-H)•. Further, the concentration of Base•+ is determined by four Reactions: 11 - a back reaction due to electron return, 10 - a competing reaction that removes Base•+ by deprotonation, 9 - a forward reaction that is an alternative pathway for forming the key intermediate dRib(Cn'-H)•, and 12 - base-to-base transfer that enables hole diffusion through the base stack. In order to better understand the significance of Reaction 6 and the influence of Reactions 9–12, we measured fbr, and the free radical precursors to fbr, in DNA samples with pronounced differences in the ratio of GC to AT.
MATERIALS AND METHODS
Palindromic oligodeoxynucleotides of d(CGCGCGCGCG) and d(CGCGAATTCGCG) from Integrated DNA Technologies, highly-polymerized-lyophilized genomic DNA isolated from the bacterium Micrococcus luteus/lysodeikticus (72% GC) and Clostridium perfringens (28.4% GC) from Sigma-Aldrich, and lyophilized calf thymus DNA (41.8%) from US Biologicals were used as supplied. These are abbreviated CGmer, 12mer, Mlut, Cper, and ct, respectively. Transparent films were prepared from 10–12 µL drops of 5–7 mM oligomer on Teflon Petri dishes. Genomic DNA films were prepared in silylated suprasil quartz tubes containing 10–12 µL of 50–60 mM nucleotide. Solutions at 277 K were dehydrated by equilibration at a relative humidity of 8% for 1 week and then further dehydrated at RT until a constant level of hydration was reached. Under this protocol, we assume that the level of hydration (Γ) is 2.5 mol water/mol nucleotide10. These ‘dry’ samples were weighed and rehydrated by equilibration, for a minimum of 3 weeks, against saturated solutions of KNO2, NaNO2, KBr and K2HPO4, which gave relative humidities of 45%, 66%, 84%, and 92%, respectively. These samples were then reweighed to an accuracy of ±1 µg and Γ was calculated from the increase in weight. The film mass was 200–250 µg for the oligomers and 100–150 µg for the genomic DNAs. The mass fraction of film consisting of DNA plus its solvation shell varies between 92 ± 3% at low Γ to 87 ± 4% at high Γ; the remaining fraction is excess salt.
Irradiation
Films were X-irradiated using a Varian/Eimac OEG-76H tungsten-target tube operated at 70 kV at 20 mA through a 40 µm aluminum filter. The dose rate at the sample was 1.1 kGy/min for samples at RT and 0.4 kGy/min for samples at 4 K. Samples irradiated at 4 K were analyzed by electron paramagnetic resonance (EPR) spectroscopy carried out at 4 K. Oligodeoxynucleotide samples irradiated at RT were prepared for HPLC by dissolving them in nuclease free water at a ratio of 1:1 (mass/volume), stored at 277 K for 24 hrs, brought to final concentrations of 80–100 µM oligodeoxynucleotide, 10 µM uracil as internal standard, and 50 mM sodium acetate (pH 6.8). Genomic DNA films were treated similarly except the high molecular weight DNA was removed either by filtering through Nanosep® 3K Omega ultrafiltration device (Pall Co., East Hills, NY) or by precipitation using spermine plus 85–90% ethanol and washed with ethanol. No difference was observed between these two protocols.
HPLC
The solution mixture was injected into a Water Alliance™ HPLC system equipped with a 2690 solvent delivery system, Waters 996 PDA detector and an auto sampler with temperature controller. The auto sampler temperature was maintained at 277 K to avoid any artifacts from the sample temperature. The unaltered free base was separated on a Phenomenex Columbus C-18 reverse-phase column (4.6 × 250 mm, 5 µ,110 D pore size) at 303 K using 40 mM ammonium acetate (pH 6.8) as a mobile phase and by applying a linear gradient 0.9–10% of acetonitrile over 25 minutes. The unaltered free bases were detected by their absorbance at 254 nm and were quantified by comparison with uracil as the internal standard. The area under each eluted peak was integrated using Millennium® Software.
EPR
EPR measurements were made at 4 K after X-irradiation at 4 K using a Janis Dewar EPR accessory12 mounted in a Varian E-12 spectrometer operating at a microwave frequency of 35 GHz. Free radical concentrations were determined using a ruby standard mounted on the inside wall of the EPR cavity. The chemical yield of total DNA-trapped radicals, Gtot(fr), was determined from the slope, at low dose, of the dose response curve. The fraction of trapped radicals due to dRib(Cn'-H)• is known to be ∼11% of the total: GdRib(fr) = ∼0.11 × Gtot(fr). 13,14
Calculation of Yields
The chemical yields were based on a target mass consisting of the DNA and one counter ion plus the number of water molecules/nucleotide. The counter ion was NH4+ for the oligodeoxynucleotides and Na+ for genomic DNA. The remainder of the film mass is assumed to be excess salt and, as such, is assumed not to be part of the target mass.
RESULTS
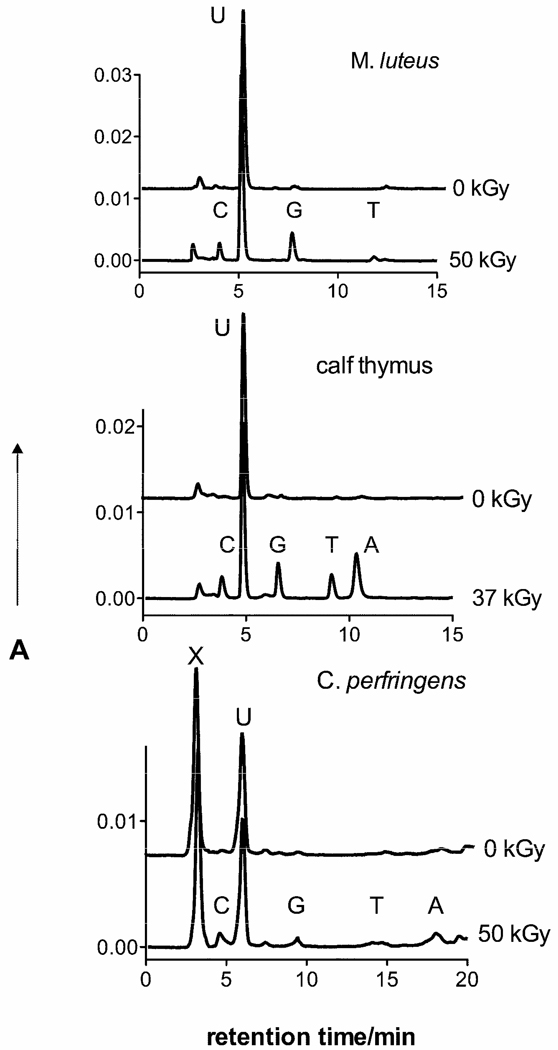
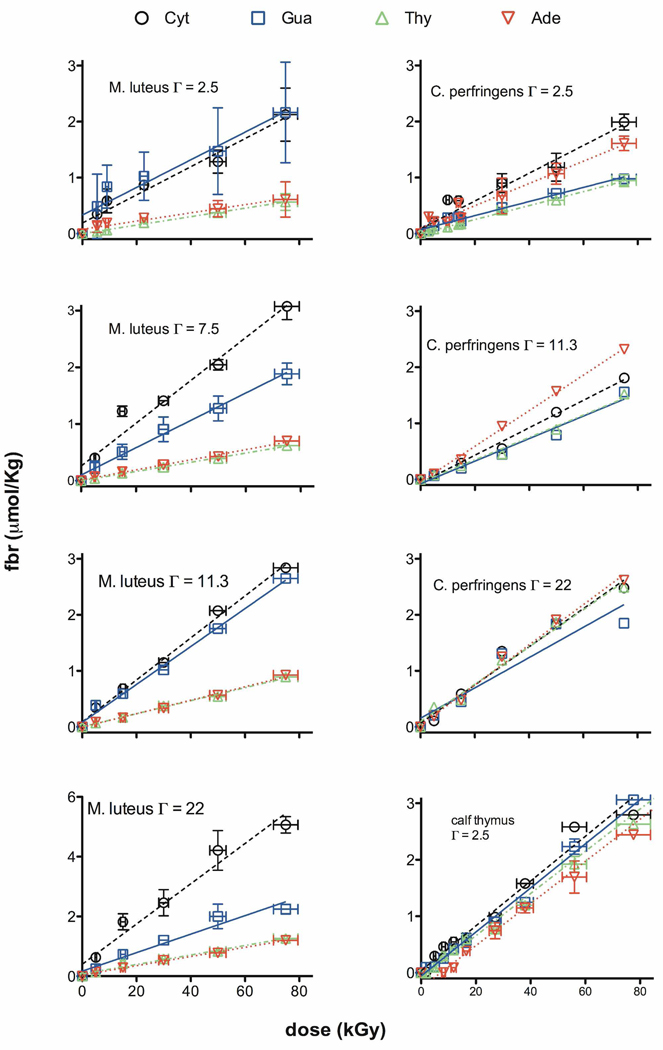
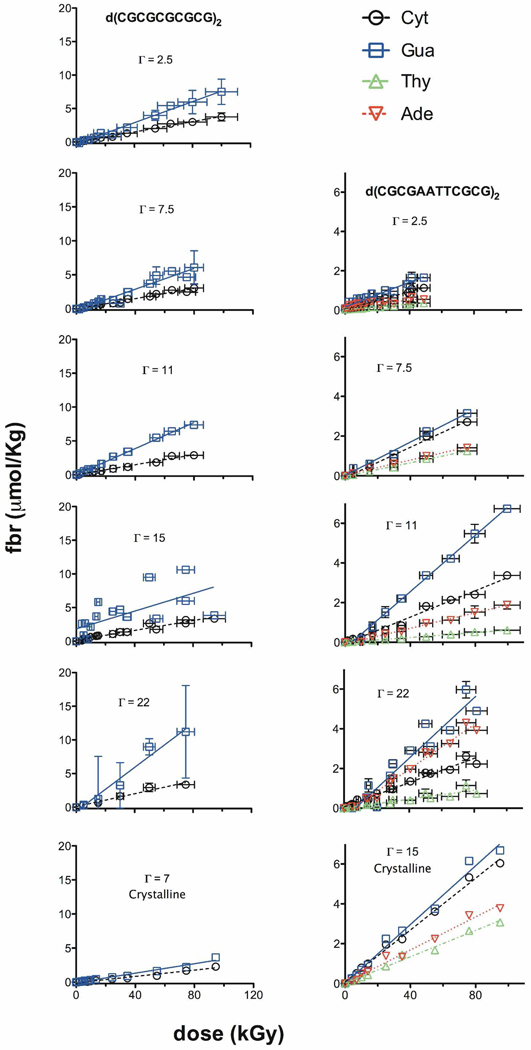
Free base release was measured in X-irradiated films of the five DNAs: M. luteus, calf thymus, C. perfringens, d(CGCGCGCGCG)2, and d(CGCGAATTCGCG)2. Example HPLC chromatograms are shown in Figure 1. From the intensity of the peaks,15 release of the four unaltered bases was quantified as a function of dose. Dose response curves for Mlut, ct, and Cper are shown in Figure 2a and the two oligomers are shown in Figure 2b. The slope of the linear least-squares-fit is the chemical yield, G(base). Values of G(base) along with the yield of total free base release, Gtot(fbr), are listed in Table 1. Because G(base) depends on the percentage of each base in DNA, we converted G(base) values to a modification factor M(base) thus eliminating this dependency. M(base) is defined as
| (1) |
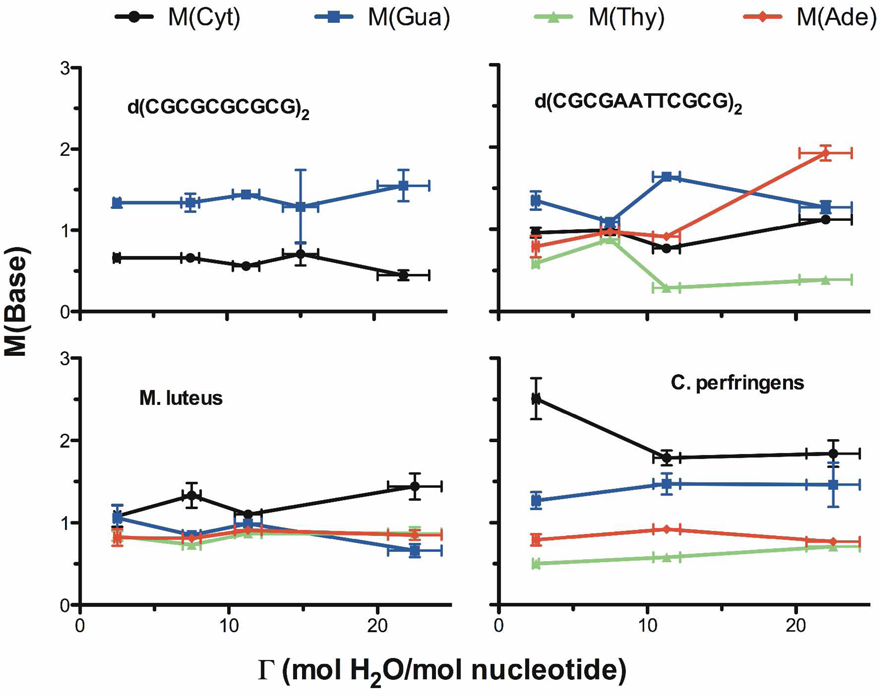
where F(base) is the mol fraction of each base in the DNA.14 The value of M(base) reflects whether a given base, on average, enhances or diminishes the damage to its own sugar. M(base) factors are tabulated in Table 2 and plotted as a function of Γ in Figure 3.
Figure 1.
HPLC chromatograms of DNA films, hydrated to Γ = 2.5 H2O/nucleotide, X-irradiated at RT and then dissolved in nuclease free water. Unaltered free bases were detected by absorbance, A, at 254 nm after passing through a reverse-phase column. Uracil, U, was used as an internal standard for the purpose of quantification.15 In Cper, there is a fast-running contaminant, X, that increased the retention time for the released bases.
Figure 2.
Figure 2a. The dose response for release of Cyt, Gua, Thy, and Ade from X-irradiated films of Mlut and Cper DNA are shown for hydration levels of Γ = 2.5, 11.3, and 22 mol waters/mol nucleotide. The slopes of the linear-least-squares-fit curve give the chemical yields for release of each base: G(Cyt), G(Gua), G(Thy), and G(Ade). As explained in the text and shown in Table 2, the M-factors plotted in Figure 3 are calculated from the G values.
Figure 2b. The dose response for Cyt, Gua, Thy, and Ade release from X-irradiated d(CGCGCGCGCG)2 and d(CGCGAATTCGCG)2 in the form of films is shown for various hydration levels and in crystalline form. Note the increase in scatter at higher levels of hydration. This is due to an increase in background levels of fbr. Background fbr, recorded at zero dose, was subtracted from all data points.
Table 1.
Radiation chemical yields for free base release from DNA films,with DNA hydration levels of Γ 2.5 to 22.5 waters/nucleotide, X-irradiated at RT.a
| DNA | Form | Γ | G (base) ≡ chemical yield of base in nm/J |
Gtot(fbr) b (nm/J) |
Nc | ||||||||
|---|---|---|---|---|---|---|---|---|---|---|---|---|---|
| Cyt | Gua | Thy | Ade | ||||||||||
| pUC18 | film | 2.5 | 41 | (1) | 29.0 | (1) | 34.0 | (1) | 30.0 | (1) | 134.0 | (2.0) | d |
| film | 22.5 | 46 | (2) | 47.0 | (7) | 64.0 | (9) | 55.0 | (5) | 212.0 | (12.6) | d | |
| calf thymus | film | 2.5 | 41 | (2) | 37.0 | (1) | 42.0 | (2) | 42.0 | (2) | 162.0 | (3.6) | e |
| calf thymus | film | 2.5 | 39.6 | (0.9) | 39.0 | (0.7) | 37.4 | (0.9) | 37.3 | (1.1) | 153.3 | (1.8) | 2 |
| d(CGCGCG- CGCG)2 |
film | 2.5 | 38.4 | (0.9) | 78.6 | (2.8) | 117.0 | (3.0) | 3 | ||||
| film | 7.5 | 37.9 | (1.4) | 76.6 | (5.0) | 114.5 | (5.2) | 3 | |||||
| film | 11.3 | 37.0 | (1.7) | 96.0 | (2.3) | 133.0 | (2.9) | 2 | |||||
| film | 15 | 36.5 | (2.1) | 66.0 | (19.5) | 102.5 | (19.6) | 2 | |||||
| film | 22 | 47.6 | (4.6) | 163.0 | (15.6) | 210.6 | (16.3) | 2 | |||||
| crystlf | 7 | 23.2 | (1.0) | 34.7 | (1.9) | 57.9 | (2.1) | 1 | |||||
| d(CGCGAA- TTCGCG)2 |
film | 2.5 | 22.3 | (1.0) | 31.6 | (2.2) | 6.9 | (0.3) | 9.3 | (1.5) | 70.06 | (2.8) | 3 |
| film | 7.5 | 38.0 | (2.0) | 41.8 | (2.2) | 17.0 | (0.6) | 18.6 | (0.7) | 115.4 | (3.1) | 2 | |
| film | 11.3 | 33.2 | (1.4) | 71.0 | (1.5) | 6.2 | (0.2) | 19.7 | (0.6) | 130.1 | (2.1) | 2 | |
| film | 22 | 65.0 | (1.7) | 73.8 | (3.0) | 33.2 | (1.3) | 41.5 | (1.8) | 174.1 | (5.8) | 3 | |
| crystlf | 15 | 30.6 | (1.2) | 76.2 | (5.2) | 11.2 | (1.0) | 56.1 | (2.0) | 213.5 | (4.1) | 1 | |
| Micrococcus luteus |
film | 2.5 | 25.1 | (2.5) | 24.7 | (3.3) | 7.6 | (0.2) | 7.4 | (0.8) | 64.8 | (4.2) | 2 |
| film | 7.5 | 37.8 | (3.8) | 24.1 | (1.0) | 8.1 | (0.2) | 8.9 | (0.3) | 78.9 | (3.9) | 2 | |
| film | 11.3 | 37.5 | (1.4) | 33.8 | (1.4) | 11.6 | (0.4) | 12.1 | (0.4) | 95.0 | (2.1) | 2 | |
| film | 22.5 | 67.4 | (6.4) | 31.0 | (3.4) | 15.9 | (1.1) | 15.4 | (0.5) | 129.8 | (7.3) | 2 | |
| Clostridium perfringens |
film | 2.5 | 24.8 | (2.3) | 12.6 | (0.8) | 12.5 | (0.3) | 19.8 | (1.5) | 69.7 | (2.9) | 2 |
| film | 11.3 | 24.5 | (1.0) | 20.1 | (1.8) | 20.0 | (1.1) | 31.8 | (0.8) | 96.4 | (2.4) | 1 | |
| film | 22.5 | 34.0 | (2.6) | 27.0 | (4.8) | 33.2 | (1.9) | 35.9 | (1.7) | 130.1 | (6.0) | 1 | |
Table 2.
Yields shown in Table 1 recast to show the degree of modification M(base) by each of the four bases.a M(base) equals 1.0 when the yield of a base expressed as a percentage of the total fbr G%(base) is equal to the mole fraction F%(base) of that base in the oligomer. When M(base) = 1.0, the base does not, on average, modify its own release.
| DNA | Γ | %GC | M(base) = G%(base) ÷ F%(base) | |||||||
|---|---|---|---|---|---|---|---|---|---|---|
| Cyt | Gua | Thy | Ade | |||||||
| pUC18 | 2.5 | 50.6 | 1.21 | (0.03) | 0.86 | (0.03) | 1.03 | (0.03) | 0.91 | (0.03) |
| 22.5 | 0.86 | (0.06) | 0.88 | (0.14) | 1.22 | (0.19) | 1.05 | (0.11) | ||
| Calf thymus | 2.5 | 41.8 | 1.21 | (0.1) | 1.09 | (0.1) | 0.89 | (0.1) | 0.89 | (0.1) |
| Calf thymus | 2.5 | 1.24 | (0.06) | 1.22 | (0.03) | 0.84 | (0.02) | 0.84 | (0.03) | |
| d(CGCGCG- CGCG)2 |
2.5 | 100 | 0.66 | (0.05) | 1.34 | (0.06) | ||||
| 7.5 | 0.66 | (0.08) | 1.34 | (0.11) | ||||||
| 11.3 | 0.56 | (0.06) | 1.44 | (0.05) | ||||||
| 15 | 0.71 | (0.28) | 1.29 | (0.45) | ||||||
| 22 | 0.45 | (0.11) | 1.55 | (0.19) | ||||||
| 7 | 0.80 | (0.09) | 1.20 | (0.08) | ||||||
| d(CGCGAA- TTCGCG)2 |
2.5 | 66.6 | 0.96 | (0.11) | 1.35 | (0.11) | 0.59 | (0.03) | 0.79 | (0.13) |
| 7.5 | 0.99 | (0.12) | 1.09 | (0.06) | 0.88 | (0.04) | 0.97 | (0.04) | ||
| 11.3 | 0.77 | (0.03) | 1.64 | (0.04) | 0.29 | (0.01) | 0.91 | (0.03) | ||
| 22 | 1.12 | (0.09) | 1.27 | (0.07) | 1.14 | (0.06) | 1.43 | (0.08) | ||
| 15 | 0.43 | (0.04) | 1.07 | (0.08) | 0.31 | (0.03) | 1.57 | (0.06) | ||
| Micrococcus luteus |
2.5 | 72 | 1.08 | (0.26) | 1.06 | (0.16) | 0.84 | (0.06) | 0.82 | (0.10) |
| 7.5 | 1.33 | (0.30) | 0.85 | (0.05) | 0.73 | (0.04) | 0.81 | (0.05) | ||
| 11.3 | 1.10 | (0.09) | 0.99 | (0.05) | 0.87 | (0.04) | 0.91 | (0.04) | ||
| 22.5 | 1.44 | (0.32) | 0.66 | (0.08) | 0.87 | (0.08) | 0.85 | (0.06) | ||
| Clostridium perfringens |
2.5 | 28.4 | 2.51 | (0.50) | 1.27 | (0.10) | 0.50 | (0.02) | 0.79 | (0.07) |
| 11.3 | 1.79 | (0.17) | 1.47 | (0.13) | 0.58 | (0.04) | 0.92 | (0.03) | ||
| 22.5 | 1.84 | (0.33) | 1.46 | (0.27) | 0.71 | (0.05) | 0.77 | (0.05) | ||
Standard deviations (±1 sd) are shown in parentheses.
Figure 3.
The modification factor for each base, M(base), is plotted as a function of gamma for CGmer, 12mer, Mlut, and Cper. The M-factors are listed in Table 2.
Finding 1: M(Cyt) > M(Gua) in the genomic DNA
Variations in the M factors display interesting properties, including the end effect reported on previously.14 A pronounced end effect occurs when Gua is at the 3' end of short oligomers, resulting in M(Gua) > M(Cyt). In genomic DNA, where end effects are negligible, we find that this inequality is reversed and M(Cyt) > M(Gua). In Mlut and Cper, Cyt gave the largest while Thy gave the smallest M factors (Figure 3). In order to better understand how the bases influence their own release, we measured the yield of radicals trapped by the DNA.
Finding 2: Gtot(fbr) > GdRib(fr)
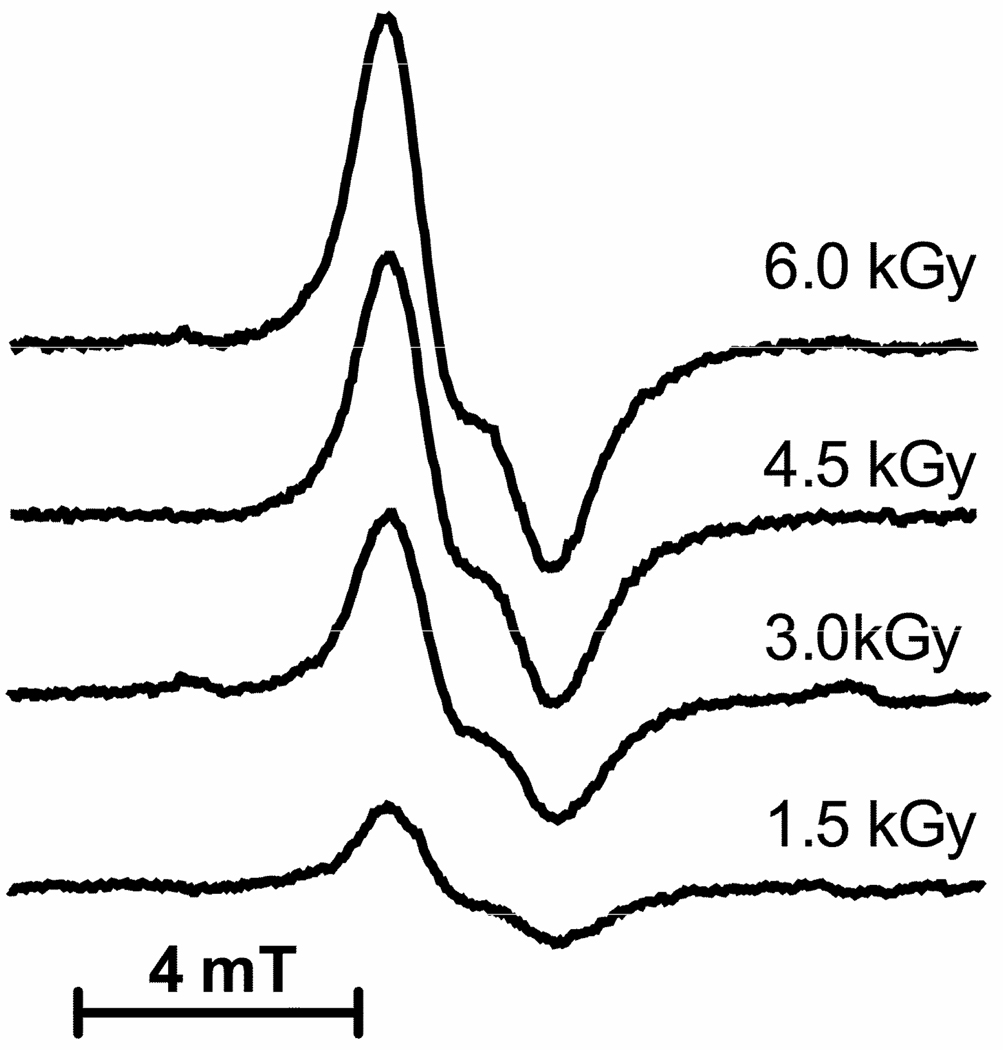
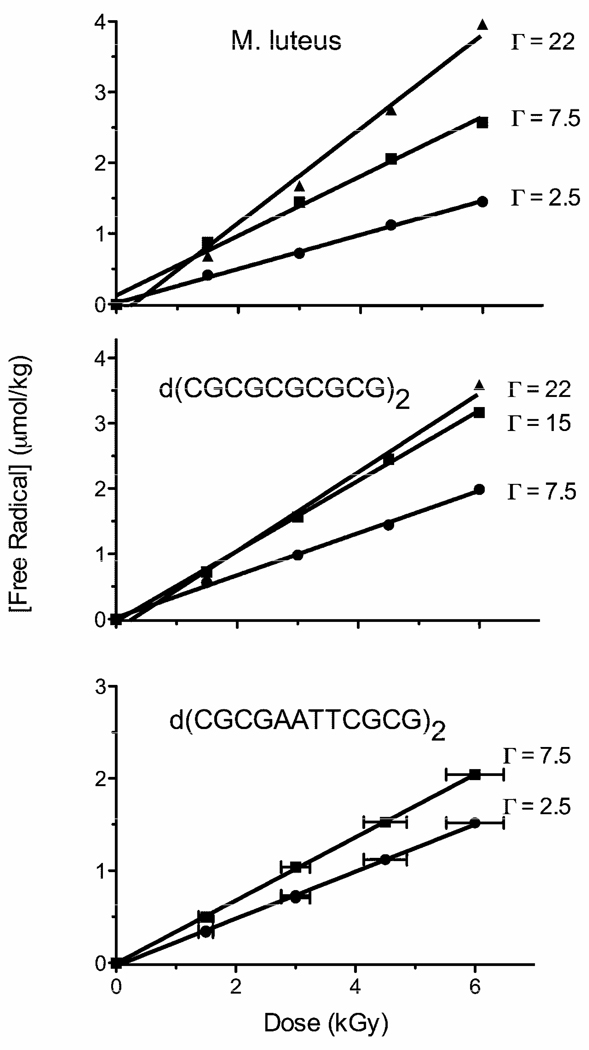
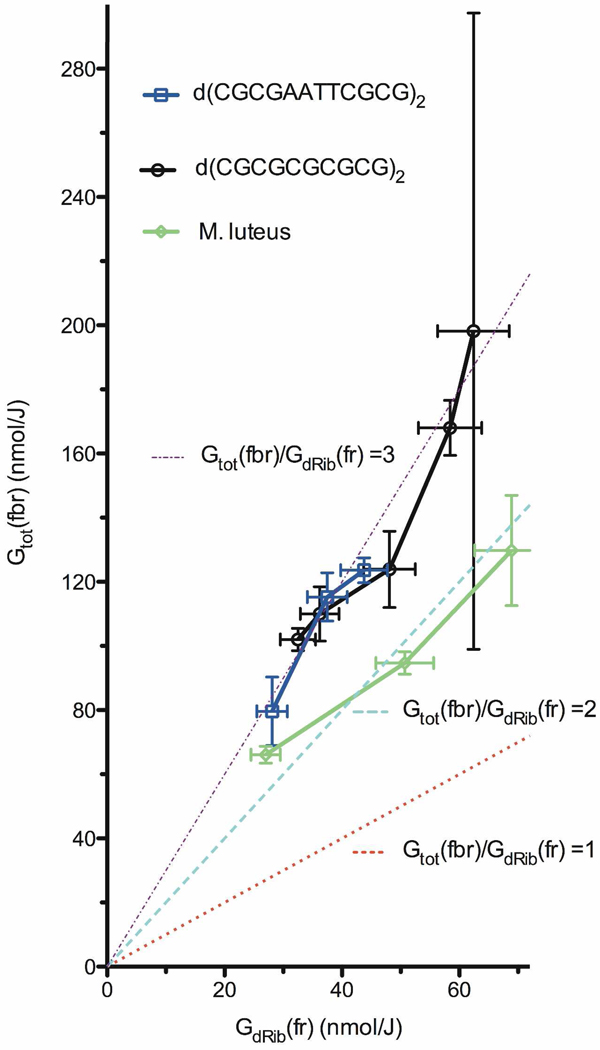
Free radical yields were measured by EPR (Figure 4) for films of Mlut, CGmer, and the 12mer. From the dose response curves in Figure 5, the yields of total trapped radicals, Gtot(fr), were determined and these are listed in Table 3. As stated above, GdRib(fr) = ∼0.11 × Gtot(fr). If the only precursor to free base release is the dRib(Cn'-H)• radical, then the ratio S = Gtot(fbr)/GdRib(fr) should be unity. As shown in Figure 6, the Mlut data correlate with the line for S = 2. About half of fbr can be accounted for by the dRib(Cn'-H)• intermediate; presumably, the other half stems from Reaction 4.
Figure 4.
Representative EPR spectra are shown for Mlut films hydrated to Γ = 2.5. First derivative spectra were recorded at 4 K using Q-band frequency and microwave power attenuation set at 50 db. The dose is shown to the right of each spectrum. The concentration was determined by comparison with an EPR signal from ruby (not shown) that serves as an internal standard. The radical concentrations were plotted as a function of dose in Figure 5.
Figure 5.
Dose response curves for the concentration of DNA-trapped free radicals in Mlut, CGmer, and 12mer hydrated to the indicated levels of Γ. The slope of the linear-least-squares-fit curve gave the chemical yield for total radicals trapped on DNA at 4 K, Gtot(fr). These Gtot(fr) values, along with values from previous work, are listed in Table 3.
Table 3.
Free radical yields were measured at 4 K in DNA films X-irradiated at 4 K. DNA hydration levels were varied from Γ 2.5 to 22.5 waters/nucleotide.
| DNA film | Γ | Gtot(fr) nmol/J |
sd |
|---|---|---|---|
| d(CGCGCG- CGCG)2 |
2.5a | 295 | 3 |
| 7.5 | 329 | 5 | |
| 11.3 | 437 | 7 | |
| 15 | 531 | 6 | |
| 22 | 567 | 21 | |
| d(CGCGAA- TTCGCG)2 |
2.5 | 255 | 5 |
| 7.5 | 341 | 4 | |
| 11.3 | 398 | 6 | |
| M. luteus | 2.5 | 245 | 1 |
| 7.5 | 461 | 16 | |
| 22.5 | 626 | 3 |
Sharma et al. 14
Figure 6.
The yield of total free base release, Gtot(fbr), is shown as a function of the yield of deoxyribose radicals, GdRib(fr). Three possible ratios, S = Gtot(fbr)/GdRib(fr) = 1, 2, and 3 are shown by dotted lines. The data for Mlut falls close to S = 2 and the data for CGmer and 12mer fall close to S = 3. One data point had an unusually high error in fbr due to a large background of Gua release when d(CGCGCGCGCG)2 was at Γ = 22.
Finding 3: M(base) depends on the DNA hydration level, Γ
It can be seen from Table 2 that values of M(base) vary as Γ is varied. For each sequence measured at 3 or more values of Γ, the values of M showed statistically significant trends. An example, M(Cyt) vs. M(Gua), is discussed further below.
DISCUSSION
Based on these findings, we propose that Reaction 6, competing with the back Reaction 7, accounts for a significant fraction of base dependent release. Accordingly, Gua being a good hole trap 16,17 explains the consistent result M(Gua) > 1.0. However, the values of M(Cyt) cannot be similarly explained. In spite of the fact that the cytosine base is a relatively poor hole trap18, in the genomic DNAs, it was found that M(Cyt) > M(Gua).
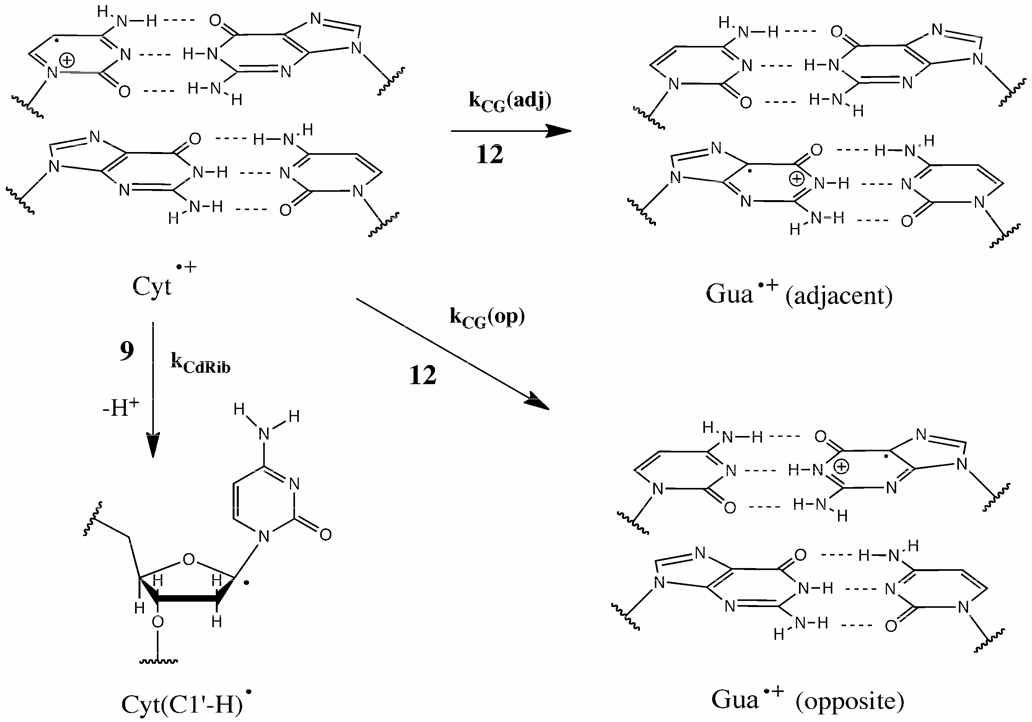
In order to explain why M(Cyt) > M(Gua), we propose that Cyt release is enhanced by Reaction 9 of Scheme 2. Competing with 9 are base-to-base hole transfer reactions (12 in Scheme 2). The dependence of the hole transfer rate kh on distance Δx can be expressed by
| (2) |
The attenuation constant β ranges from 0.6–1.0 nm−1 and an estimate of the pre-exponential factor kh0 is 1.5×10¹⁴ s−1.19,20 Using β = 0.8 nm−1 and Δx = 0.34 nm (the inter-base-pair distance), kh = kCG(adj) ≈ 1×10¹² s−1. When 2 bases intervene between Gua and Cyt, Δx = 1.02 nm and the rate drops to ∼5×10 s−1. Given that deprotonation of radical cations may occur in picoseconds,21 the only case where deprotonation at C1' (giving dRib(C1'-H)•) would not prevail is when Gua is adjacent to Cyt. Formation of the dRib(C1'-H)• radical in solid state DNA has been reported.22,23, Evidence that the Cyt radical cation deprotonates at C1' has been obtained for deoxycytidine in dilute aqueous solution24 and deprotonation at C1' may explain some fraction of the Cyt release measured in DNA ionized by 194 nm laser excitation.25 We propose that a predominate reaction stemming from Cyt•+ is 9 whenever Gua is not adjacent to Cyt; i.e., kCG(adj) > kCdRib > kCG(op). Interestingly, this indicates that inter-strand hole transfer is the slowest of these three reactions.
Scheme 2.
The base-to-base hole transfer of Reaction 12 in Scheme 1 is shown here, specifically, for a hole on cytosine, Cyt•+. The hole can transfer to an adjacent Gua at a rate kCG(adj) or an opposite Gua at rate kCG(op). But these base-to-base transfer reactions must compete with transfer of the hole from cytosine to its own deoxyribose, at rate of kCdRib. Reaction 9 in Scheme 1 is detailed here for a specific case.
If, as postulated, hole transfer through the base stack plays a significant role in fixing damage at specific sites of the DNA backbone, then the values of M(base) should depend on base context. In order to test this, we take advantage of the finding that M(base) varies with Γ and does so for a fixed sequence. Then we assume, using three of the sequences in Table 2, that M(base) is not dependent on base context. This assumption leads to an inverse relationship (see Supporting Information) between M(Cyt) and M(Gua)
| (3) |
where for F(base), defined in Eq. (1), base ≡ Cyt. For the CGmer, M(Thy) + M(Ade) = 0 and F(Cyt) = 0.5, giving
| (3a) |
For Mlut, where F(Cyt) = 0.36 and M(Thy) + M(Ade) = 1.8, the predicted intercepts increase slightly
| (3b) |
For Cper, where F(Cyt) = 0.142 and M(Thy) + M(Ade) = 1.2, the predicted intercepts double
| (3c) |
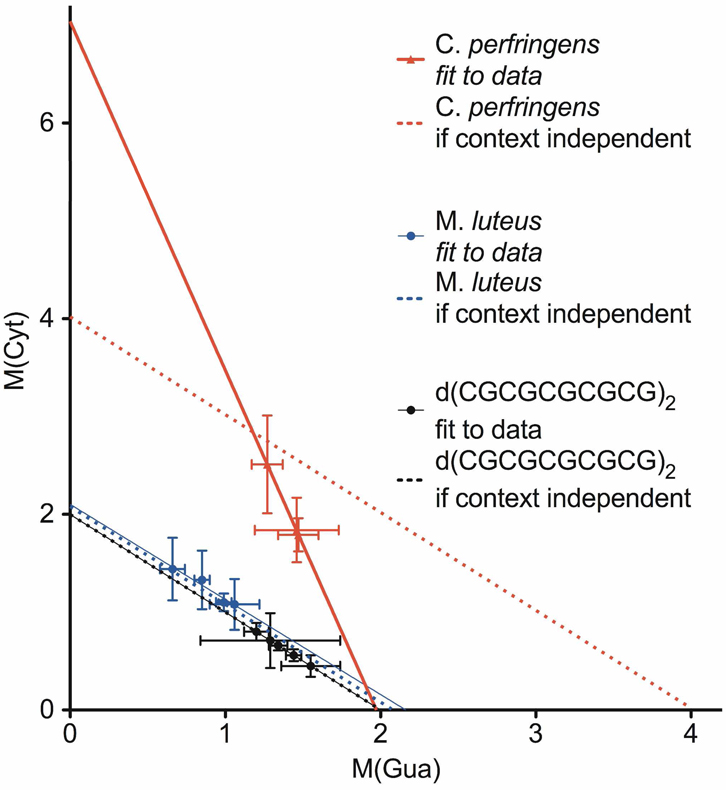
The lines generated by Equations (3a–3c) were plotted along with the respective fbr data and the linear-least-squares fit to that data (Figure 7). The data from the CGmer identically fit (by definition) the line generated by Eq. (3a). The fit for Mlut gave a slope of −0.97 ± 0.16, which is indistinguishable from the value of −1 in Eq. (3). In this case, the effect of base composition cannot be discerned. The Cper data generates a slope of −3.6 ± 0.16 with a 95% confidence interval of −4.4 to −2.8. Thus, Cper yielded a slope significantly more negative than the predicted value of −1. In this case, the assumption of independence fails and we conclude that the base and its context influence fbr.
Figure 7.
A comparison of the lines generated by Equations (3a–3c) with the least-squares-fit lines for the CGmer, Mlut, and Cper data. For the CGmer, the line from Equation (3a) and the line from the data fit are identical (solid black line); this is a consequence of the M-factor definition and there being only two bases, Cyt and Gua. For Mlut, the dotted blue line is generated by Equation (3b). The solid blue line is the least-squares fit to the blue data points; it has a slope of −0.97 ± 0.16, y-intercept of 2.1 ± 0.15, x-intercept of 2.2, and R value of 0.95 and it is indistinguishable from the dotted line. For Cper, the dotted line is generated by Equation (3c). The solid red line is the least-squares fit to the red data points; it has a slope of −3.6 ± 0.16, y-intercept of 7.0 ± 0.1, x-intercept of 2.0, and R value of 1.0 and it deviates dramatically from the dotted line. This surprising result is attributed to hole transfer from Cyt to its own deoxyribose competing with hole transfer to Gua. When Gua is not adjacent to Cyt, transfer to deoxyribose predominates.
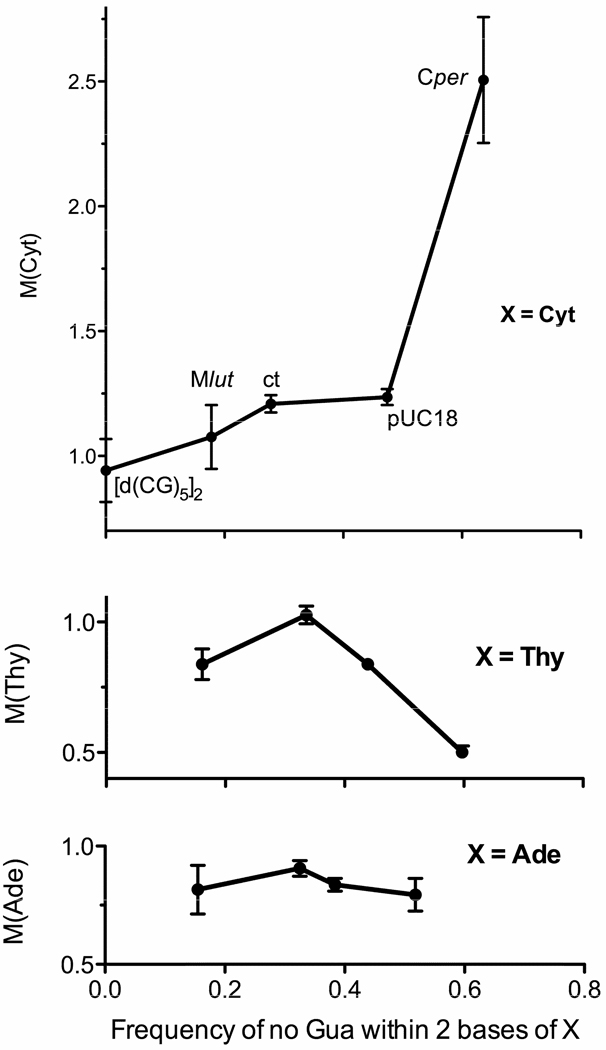
While the CG content provides a rough sense of base context, it is preferable to employ the actual context of each base. Therefore, known genomic sequences were used to calculate the frequency of occurrence for all possible base-quintets. Figure 8 shows the dependency of M(X) on the frequency of finding no Gua within 2 bases of base X. We found that M(Cyt) increases and M(Thy) decreases as proximity to Gua decreases, while M(Ade) is insensitive to Gua proximity. The same results were obtained, slightly reduced in magnitude, when the frequency of no Gua within 1 base of X was calculated. The results (Figure 8) support the hypothesis that the rate of hole transfer through the base stack competes with the rate of irreversible deprotonation. When the site of deprotonation is C1’ (Reaction 9 in Scheme 2), the damage becomes fixed on dRib and an unaltered Cyt base is released. If Gua is adjacent to Cyt, fbr is inhibited because kCG(adj) > kCdRib. Consequently, M(Cyt) > M(Gua) when Cyt is not adjacent to Gua.
Figure 8.
Using data from DNA films at Γ = 2.5, the modification factors M(X), with X = Ade, Thy, and Cyt, are plotted against the frequency of finding no Gua within 2 bases of X. Table S1 of Supporting Information gives the frequencies for all possible base quintets, with the sum of the 1024 possibilities equal to 1. This was done for the forward and reverse strands in C. perfringens, bovine (calf thymus) DNA, pUC18, and Micrococcus sp. 28 plasmid pSD10 (68.0% GC). The latter was the closest we could find to M. luteus (72% GC), the entire genome of which had not been sequenced. The fbr data for pUC18 was reported previously.30 For M(Cyt), previous data 14 on the 20-mer [d(CG)10]2 was used for the zero frequency point.
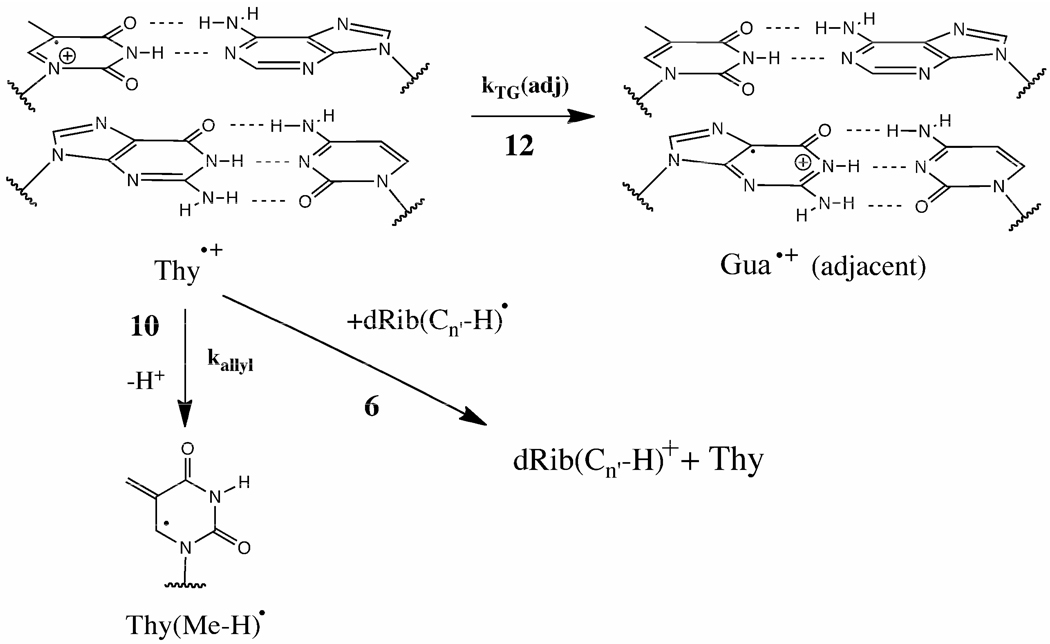
The consistently small values of M(Thy) can be attributed to four properties of Thy and its context. i) When Thy is adjacent to a Gua, hole transfer to Gua dominates (12 in Scheme 3); otherwise, irreversible methyl deprotonation at a rate kallyl (10 in Scheme 3) prevails. In poly AT, conversion of the Thy radical cation Thy•+ into the allyl radical, Thy(Me-H)•, has been observed.26 ii) Because methyl deprotonation depletes Thy•+, the probability of the forward Reaction 6 is reduced. iii) The high electron affinity of Thy increases the likelihood of electron return, Reaction 7 of Scheme 1; in this case electron return is to a deoxyribose radical at the Thy site. iv) If a Gua is adjacent to Thy, Gua may serve as a conduit for the second oxidation in reaction 6. We find, therefore, that our model explains how thymine protects its deoxyribose from damage and how this protection increases when Gua is not adjacent.
Scheme 3.
The rate of transfer, kTG(adj), for a hole on thymine, Thy•+, to an adjacent Gua is expected to be fastest. Base-to-base transfer (Reaction 12) competes with deprotonation from the methyl of Thy (Reaction 10) giving the allylic radical, Thy(Me-H)•. Relative rates that would support findings reported here are kTG(adj) > kallyl > kTG(non-adjacent), where kTG(non-adjacent) is the rate of transfer from thymine to any non-adjacent base and kallyl is the rate of allyl radical formation. Both 10 and 12 compete against the forward Reaction 6. Reactions 6, 10, and 12 are detailed here for specific cases.
CONCLUSIONS
In summary, the model presented in Scheme 1 explains the dependence of fbr on the base itself and its context. In the case of Cyt•+, base-to-base hole transfer competes with irreversible trapping by hole transfer to C1' of cytosine’s deoxyribose. In the case of Thy•+, base-to-base hole transfer competes with irreversible trapping by methyl deprotonation. Close proximity of Gua protects the deoxyribose of Cyt but sensitizes the deoxyribose of Thy.
Supplementary Material
ACKNOWLEDGEMENTS
The authors thank Kermit R. Mercer for his excellent technical support and Dr. Yuriy Razskazovskiy Paul Black for helpful suggestions. The project described was supported by Award Number R01CA032546 from the National Cancer Institute. The content is solely the responsibility of the authors and does not necessarily represent the official views of the National Cancer Institute or the National Institutes of Health.
REFERENCES
- 1.Kiyohiko K, Kodera H, Osakada Y, Majima T. Nature Chem. 2009;1:156. doi: 10.1038/nchem.171. [DOI] [PubMed] [Google Scholar]
- 2.Ward JF. Int. J. Radiat. Biol. 1994;66:427. doi: 10.1080/09553009414551401. [DOI] [PubMed] [Google Scholar]
- 3.Goodhead DT, Nikjoo H. Radiat. Res. 1997;148:485. [Google Scholar]
- 4.Becker D, Sevilla MD, Wang W, LaVere T. Radiat. Res. 1997;148:508. [Google Scholar]
- 5.Debije MG, Strickler MD, Bernhard WA. Radiat. Res. 2000;154:163. doi: 10.1667/0033-7587(2000)154[0163:oteoha]2.0.co;2. [DOI] [PMC free article] [PubMed] [Google Scholar]
- 6.Daban JR. Biochemistry. 2000;39:3861. doi: 10.1021/bi992628w. [DOI] [PubMed] [Google Scholar]
- 7.Krisch RE, Flick MB, Trumbore CN. Radiat. Res. 1991;126:251. [PubMed] [Google Scholar]
- 8.Bernhard WA, Purkayastha S, Milligan JR. Dose-Response. 2008;6:184. doi: 10.2203/dose-response.07-009.Bernhard. [DOI] [PMC free article] [PubMed] [Google Scholar]
- 9.Weinfeld M, Rasouli-Nia A, Chaudhry MA, Britten RA. Radiat. Res. 2001;156:584. doi: 10.1667/0033-7587(2001)156[0584:robere]2.0.co;2. [DOI] [PubMed] [Google Scholar]
- 10.Swarts SG, Sevilla MD, Becker D, Tokar CJ, Wheeler KT. Radiat. Res. 1992;129:333. [PubMed] [Google Scholar]
- 11.Sharma KKK, Bernhard WA. J. Phys. Chem. B. 2009;113:12839. doi: 10.1021/jp905750w. [DOI] [PMC free article] [PubMed] [Google Scholar]
- 12.Mercer KR, Bernhard WA. J. Magn. Reson. 1987;74:66. [Google Scholar]
- 13.Purkayastha S, Bernhard WA. J. Phys. Chem. B. 2004;108:18377. doi: 10.1021/jp048539x. [DOI] [PMC free article] [PubMed] [Google Scholar]
- 14.Sharma KK, Razskazovskiy Y, Purkayastha S, Bernhard WA. J. Phys. Chem. B. 2009;113:8183. doi: 10.1021/jp900803b. [DOI] [PMC free article] [PubMed] [Google Scholar]
- 15.Sharma KK, Purkayastha S, Bernhard WA. Radiat. Res. 2007;167:501. doi: 10.1667/RR0847.1. [DOI] [PMC free article] [PubMed] [Google Scholar]
- 16.Steenken S, Jovanovic SV. J. Am. Chem. Soc. 1997;119:617. doi: 10.1021/ja003823x. [DOI] [PubMed] [Google Scholar]
- 17.Sevilla MD, Becker D, editors. ESR studies of radiation damage to DNA and related biomolecules. Vol. 19. Cambridge, UK: The Royal Society of Chemistry; 2004. p. 243. [Google Scholar]
- 18.Steenken S. Free Rad. Res. Comm. 1992;16:349. doi: 10.3109/10715769209049187. [DOI] [PubMed] [Google Scholar]
- 19.Cai Z, Sevilla MD. Studies of excess electron and hole transfer in DNA at low temperatures. In: Schuster G, editor. Long Range Transfer in DNA, Vol II. Vol. 237. New York: Springer-Verlag; 2004. p. 103. [Google Scholar]
- 20.Wagenknecht HA. Angew. Chem. Int. Engl. 2003;42:2454. doi: 10.1002/anie.200301629. [DOI] [PubMed] [Google Scholar]
- 21.Zewail AH. J. Phys. Chem. B. 1996;100:12701. [Google Scholar]
- 22.Weiland B, Hüttermann J, Malone ME, Cullis PM. Int. J. Radiat. Biol. 1996;70:327. doi: 10.1080/095530096145067. [DOI] [PubMed] [Google Scholar]
- 23.Gatzweiler W, Hüttermann J, Rupprecht A. Radiat. Res. 1994;138:151. [PubMed] [Google Scholar]
- 24.Decarroz C, Wagner JR, Cadet J. Free Rad. Res.Comm. 1987;2:295. doi: 10.3109/10715768709065295. [DOI] [PubMed] [Google Scholar]
- 25.Gurzadyan GG, Görner H. Photochem. Photobio. 1992;56:371. doi: 10.1111/j.1751-1097.1992.tb02173.x. [DOI] [PubMed] [Google Scholar]
- 26.Spalletta RA, Bernhard WA. Radiat. Res. 1992;130:7. [PubMed] [Google Scholar]
- 27.Roginskaya M, Bernhard WA, Razskazovskiy Y. Radiat. Res. 2006;166:9. doi: 10.1667/RR3571.1. [DOI] [PMC free article] [PubMed] [Google Scholar]
- 28.Bernhard WA, Close DM. DNA damage dictates the biological consequence of ionizing radiation: the chemical pathways. In: Mozumder A, Hatano Y, editors. Charged particle and photon interactions with matter. New York: Marcel Dekker; 2003. p. 471. [Google Scholar]
- 29.Swarts SG, Gilbert DC, Sharma KK, Razskazovskiy Y, Purkayastha S, Naumenko KA, Bernhard WA. Radiat. Res. 2007;168:367. doi: 10.1667/RR1058.1. [DOI] [PMC free article] [PubMed] [Google Scholar]
- 30.Sharma KKK, Milligan JR, Bernhard WA. Radiat. Res. 2008;170:156. doi: 10.1667/RR1277.1. [DOI] [PMC free article] [PubMed] [Google Scholar]
Associated Data
This section collects any data citations, data availability statements, or supplementary materials included in this article.


