Abstract
Advancements in technologies for assessing biomechanics at the cellular level have led to discoveries in mechanotransduction and the investigation of cell mechanics as a biomarker for disease. With the recent development of an integrated optical tweezer with micron resolution particle image velocimetry, the opportunity to apply controlled multiaxial stresses to suspended single cells is available (Nève, N., Lingwood, J. K., Zimmerman, J., Kohles, S. S., and Tretheway, D. C., 2008, “The µPIVOT: An Integrated Particle Image Velocimetry and Optical Tweezers Instrument for Microenvironment Investigations,” Meas. Sci. Technol., 19(9), pp. 095403). A stress analysis was applied to experimental and theoretical flow velocity gradients of suspended cell-sized polystyrene microspheres demonstrating the relevant geometry of nonadhered spherical cells, as observed for osteoblasts, chondrocytes, and fibroblasts. Three flow conditions were assessed: a uniform flow field generated by moving the fluid sample with an automated translation stage, a gravity driven flow through a straight microchannel, and a gravity driven flow through a microchannel cross junction. The analysis showed that fluid-induced stresses on suspended cells (hydrodynamic shear, normal, and principal stresses in the range of 0.02–0.04 Pa) are generally at least an order of magnitude lower than adhered single cell studies for uniform and straight microchannel flows (0.5–1.0 Pa). In addition, hydrostatic pressures dominate (1–100 Pa) over hydrodynamic stresses. However, in a cross junction configuration, orders of magnitude larger hydrodynamic stresses are possible without the influence of physical contact and with minimal laser trapping power.
1 Introduction
Current research on human diseases primarily focuses on the molecular, microbiological, immunological, and pathological aspects. However, the mechanical basis of disease may make direct contributions to physiologic outcomes [1]. In functionally loaded tissues such as cartilage and bone, cells (chondrocytes and osteocytes) experience multiaxial forces (hydrostatic, compressive, tensile, and shear), which modulate a biologic function. For example, cartilage is typically exposed to pressures in the physiologic range of 3–18 MPa [2,3]. The application of these forces is essential for the maintenance of the phenotype, and production of new tissue [4]. Conversely, abnormal mechanical forces, due to single cycle or fatigue loading, leads to altered cell behavior, resulting in pathological matrix synthesis, increased catabolic activity (degradation), and ultimately osteoarthritis or osteoporosis (apoptosis) [5,6]. Previous investigations support the hypothesis that chondrocytes and other cell types respond to their stress-strain environments in a temporal and spatial manner [7]. In addition, biomechanics at the cellular level have been investigated as biomarkers for disease. Recently, cell stiffness of metastatic cancer cells was reported to be more than 70% softer than the benign cells that line the body cavity in patients with suspected lung, breast, and pancreas cancer [8].
Traditionally, cellular characteristics are described from an average response of a population of cells [9] rather than from physiologic information measured at the individual cell level. Dynamic single cell measurements require methods capable of suspending an individual cell for repeated measurements. Current technologies include dielectrophoretic (DEP) traps, which create a trapping force by acting on cell polarization induced by an oscillating electrical field [10], acoustic tweezers (AT), which apply an ultrasonic standing wave to create a pressure node attracting particles or cells [11], and hydrodynamic tweezers (HT), which can suspend single cells using only gentle secondary hydrodynamic forces [12]. Advancements in laser technology facilitated the most popular means of manipulating isolated single cells, like that of optical tweezers or traps (OT) [13]. Distinct loads can be applied experimentally to single cells in culture to quantify cellular, membrane, and cytoskeletal biomechanics. This type of intracellular “holding” can apply forces in extracellular microenvironments on the order of 100 pN, with a resolution smaller than 1 pN (1 pN = 10−12 N) [14,15]. All of these currently available trapping methods apply conditions outside the physiologic range for cells, making their effects on cell behavior and viability up for debate.
With advancements in microscale fabrication, microfluidic devices create opportunities to study the dynamic mechanical behavior of individual cells under controlled conditions. Through fluid mechanics, flow-based mechanical test sequences (including shear and extensional loading) may provide control of unique microenvironments when coupled with single cell suspension techniques. The µPIVOT (micron resolution particle image velocimetry combined with optical tweezers) was recently developed to apply controlled multiaxial stresses to single cells suspended with optical tweezers within custom channel designs [16,17].
This work examines the microfluidic environments designed for biological cell investigations, and determines the experimental and theoretical stresses applied to suspended cell-sized polystyrene microspheres. This application represents the relevant geometry of nonadhered spherical cells, as observed for osteoblasts, chondrocytes, and fibroblasts [17]. A stress analysis is developed and applied to three previously reported flow conditions [16,18,19]: (1) a uniform flow field generated by moving the fluid sample with an automated translation stage, (2) a gravity driven flow through a straight microchannel, and (3) a gravity driven flow through a microchannel cross junction. The analysis characterizes fluid-induced stresses at the microscale for comparison with adhered single cell studies during uniform and straight microchannel flows, as well as a cross junction configuration, which has the potential for larger stress magnitudes.
2 Methods
2.1 Microenvironments for Cell Biomechanics
2.1.1 µPIVOT Enhanced With Microfluidics
When single cell suspension is coupled with microfluidics, innovative fluid mechanical stimulation of cells is possible. This study examines the microfluidic environments generated to enhance µPIVOT studies. The µPIVOT [16] is a novel instrument integrating two laser-based techniques for manipulating and characterizing the mechanical environment adjacent to cellular or microscale structures.
Briefly, an OT applies an infrared laser (λ = 1064 nm) to suspend micron-sized objects with nanometer position control, and constraining forces on the order of pN (see Ref. [20] for details on optical tweezers). Here, a dual optical trap was produced by passing a split laser beam through a high numerical aperture objective lens, and focusing it to its diffraction-limited spot. For translucent objects larger in dimension than the wavelength of the trapping laser (such as individual biological cells), a ray optics approach indicates that the rays of light are refracted as they pass in and out of the trapped cell. This change in direction and the associated momentum imparts an equal and opposite force on the “trapped” object.
Micron-resolution particle image velocimetry (µPIV) is a high-resolution, two-dimensional full-field velocity measurement technique [21]. Flow velocity measurements are obtained by seeding the flow domain with 275 nm diameter fluorescent nanoparticles, volume illuminating the region of interest with pulses from two frequency-doubled Nd:YAG lasers (λ=532 nm) near the nano-particle excitation wavelength (λ=535 nm), and imaging the emitted light (λ=575 nm). The lasers are synchronized with a charge coupled device camera such that the emitted particle light from each laser pulse is captured on consecutive image frames. The resulting image pairs are cross correlated with correlation ensemble averaging (increasing the nanoparticle signal to noise ratio) to obtain the resulting velocity field [22].
2.1.2 Experimental Protocol
2.1.2.1 Stationary sphere in uniform flow
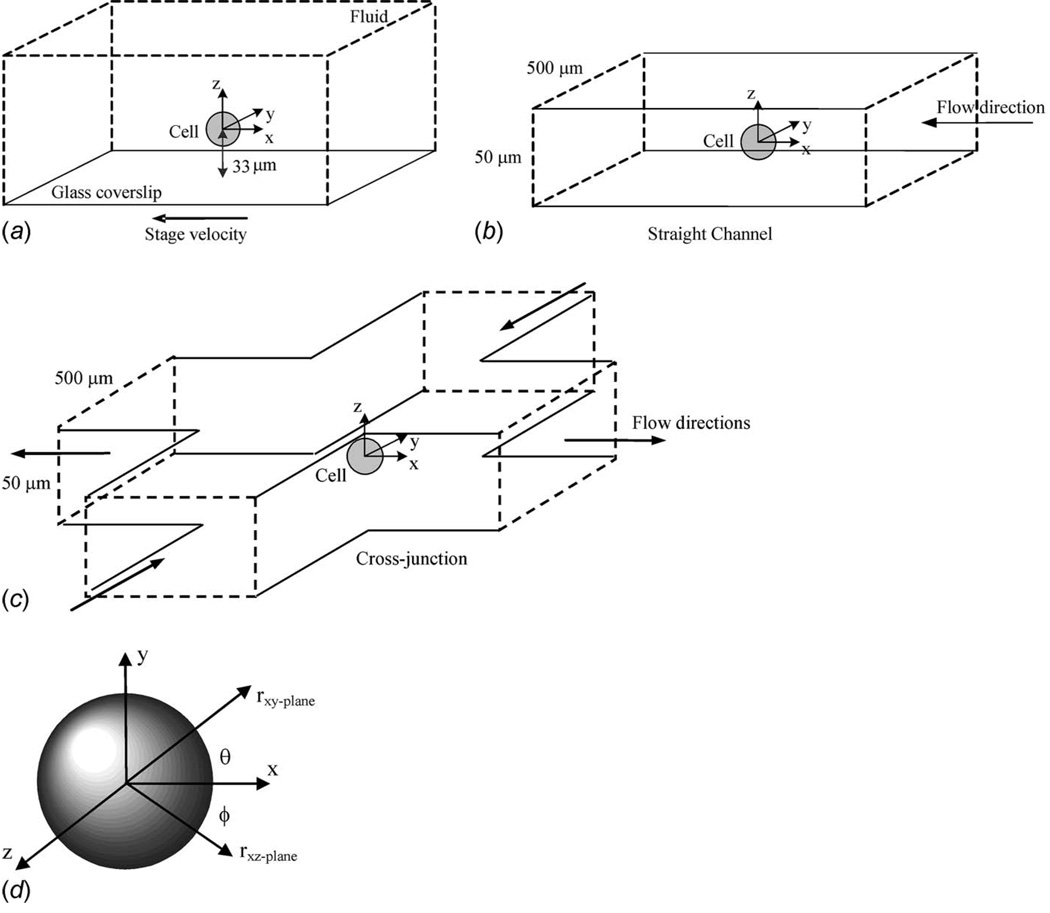
A 21.8 µm diameter polystyrene microsphere (Polystyrene crosslinked DVB copolymer, Duke Scientific, Fremont, CA) was optically trapped in a 50 µl solution of fluorescent nanoparticles (2.5% solid concentration in 2 ml distilled water; Molecular Probes, Carlsbad, CA) contained between two coverslips (Fig. 1(a)). The solution is an incompressible Newtonian fluid with a density (ρ=998 kg/m3) and viscosity (μ=0.992 × 10⁻³ N s/m2) at room temperature (20.5°C). The sphere was trapped at a depth of 1.5 times the sphere diameter from the bottom coverslip. The upper coverslip was ~150 µm from the suspended sphere, inducing a local hydrostatic pressure of p=p∞=−ρgh=−1.469 Pa. The uniform flow field was generated by moving the coverslips on an automated stage (H117 ProScan™ II stage, Prior Scientific, Rockland, MA) at constant velocity. The stage was controlled to execute displacement rates of 50 µm/ s to 500 µm/ s in the −x direction (to create relative flow in the −ix or −x direction) with a linear resolution of 20 nm.
Fig. 1.
Schematics of applied microenvironments including (a) a uniform flow field generated by moving the fluid sample with an automated translation stage, (b) a gravity driven flow through a straight microchannel, and (c) a gravity driven flow through a microchannel cross junction. The Cartesian coordinate system was established at the center of the fixed cell position and converted to (d) spherical polar coordinates during stress analysis (here φ=0 deg).
2.1.2.2 Stationary sphere in a gravity driven straight microchannel flow
A 28.0 µm diameter microsphere was optically trapped in a straight 50×500 µm2 microchannel (Fig. 1(b)). This straight channel was fabricated using a standard soft lithography approach with polydimethylsiloxane (PDMS) (Sylgard 184, Dow Corning, Midland, MI). The chip was then chemically bonded to a coverslip. A gravity driven microchannel flow of the solution described above was generated by attaching input and output open syringes (filled barrel with no plunger) placed at a height differential of h=15 mm, producing a flow driven by p∞=−ρgh=−146.9 Pa. The syringes were connected to the microfluidic chip via Tygon tubing (Fisher Scientific, Pittsburg, PA) attached to metal pins (0.025 in OD × 0.017 in ID, Type 304, New England Small Tubes Corp., Litchfield, NH) that were directly inserted at the entry/exit ports of the microchannel. The microsphere was trapped at a location equally distant from the pressure head losses of the entry/exit ports, such that the local hydrostatic pressure was p=−1/2 ρgh=−73.45 Pa. This setup allowed a controlled and steady centerline midplane flow velocity U∞=460 µ/ s.
2.1.2.3 Stationary sphere in gravity driven extensional flow
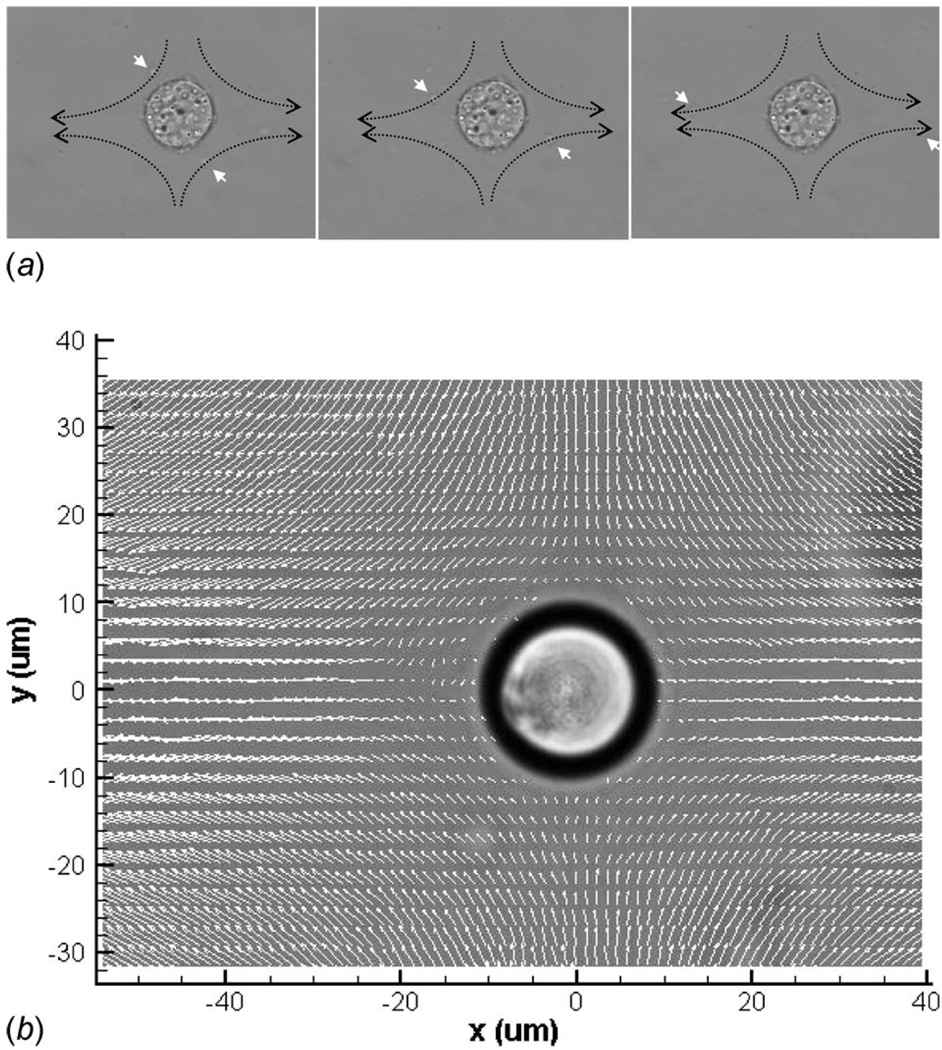
A 20.6 µm diameter microsphere was optically trapped in a 50 × 500 µm2 water-filled microchannel cross junction (Figs. 1(c) and 2) fabricated in a similar manner just described. The radius of curvature at each of the channel wall intersections was maintained at 200 µm for laminar cornering flow. With a pressure head of 24.5 mm and p∞=−239.5 Pa, a gravity driven flow was generated with a far-field channel, centerline midplane velocity of 750 µm/ s, and a local hydrostatic pressure of p=−1/2p∞= −119.75 Pa. This produced a midplane shear rate of γ̇ = 12.4 strain/ s at the cross junction (determined without microsphere perturbation), and thus, a characteristic flow velocity (U = γ̇a) of 128 µm/ s, where “a” is the radius of the sphere.
Fig. 2.
(a) Representative time-lapse image sequence of a living rat osteoblast suspended by an optical trap within the geometric center of the cross-junctional channel design during flow (Fig. 1(c)). The dashed arrows follow the streamline path of a particle within the culture media, as indicated by the white arrow. (b) Velocity flow field surrounding an analogous cell (20.6 µm diameter polystyrene microsphere), as measured with micron resolution particle image velocimetry.
2.2 Theoretical Development and Applied Mechanics
2.2.1 Fluid Imposed Stress States
In the following mathematical development, bold, uppercase letters indicate tensors, while bold, lowercase letters indicate vectors. The constitutive equation for an incompressible Newtonian fluid states that
| (1) |
where T is the stress tensor, I is the identity matrix associated with the local isotropic (hydrostatic) pressure p, and μ is the fluid viscosity. E is the rate of the strain tensor defined by the flow velocity gradient tensor and its transpose
| (2) |
When applied to the layerwise, two-dimensional nature of the PIV experimental technique and the presence of a uniform streaming flow past a solid spherical cell (radius=a), the velocity gradient tensor can be reduced to two-dimensional cylindrical polar (r,θ, z) or spherical polar (r,θ,ϕ) coordinates (Fig. 1(d))
| (3) |
where ur and uθ are the radial and transverse velocity components, respectively (Fig. 1).
Equation (1) then identifies the normal (Trr or σr) and shear (Trθ or τrθ) stress components as
| (4) |
| (5) |
At the cell surface (r=a), radial and transverse flow velocities are zero, in addition to
| (6) |
However, in the flow field adjacent to the cell surface (r>a)
| (7) |
Hence, the stresses imposed on the cell, due to local fluid flow, may not be further reduced. Thus, the imposed normal and shear stress states can be determined directly from experimentally measured or theoretically derived planar velocity fields by calculating differential flow velocities per radial location and per transverse location (radial and transverse velocity gradients). In the approach that follows, gradients were determined at 10 deg increments around the central perimeter of the analyzed cell (θ=0 to ±180 deg at z=0 and ϕ=0 deg), incorporating flow field data from the nearest radial location (~1.1r) out to three radii (3r) away from the cell surface. Due to limitations in finite resolution (velocity spacing of 8×8 pixels with 109 nm/pixel), velocity gradients were not determined at the exact cell surface. Each velocity gradient was assessed with linear regression, and consistently indicated a strong linear fit (|R|>0.90). Regression analysis was also applied to compare experimental and theoretical stress results at coincident locations throughout the examined spherical perimeter region. The theoretical stresses were calculated from the following analytical flow solutions.
2.2.2 Fluid Velocity Analytical Solutions
2.2.2.1 Uniform flow
For a spherical cell suspended in a creeping uniform flow (Reynolds number, Re < 10−2) with freestream velocity U∞, the continuity or momentum equation for an axisymmetric, incompressible flow can be reduced to the single fourth order partial differential equation for the stream function ψ
| (8) |
where the biharmonic operator can be defined for plane flow in polar coordinates as
| (9) |
The velocity components ur and uθ are related to the stream function by the relations
| (10) |
With the boundary conditions ur=uθ=0 at r=a and u→U∞ at r → ∞, the Stokes solution for creeping motion past a sphere is [23–25]
| (11) |
By substituting Eq. (11) into Eq. (10), the velocity components are then
| (12) |
| (13) |
Equations (12) and (13) can then be used to calculate the theoretical normal and shear stresses defined by Eqs. (4) and (5) [26]
| (14) |
| (15) |
Both of these stress states contribute a net drag force component applied to the cell in the direction of flow (here in the −ix or −x direction). The total drag is determined by integrating the stress tensor, as defined by the normal (form drag) and shear (friction drag) stress components, acting on the cell surface n or ir
| (16) |
where finite increments of the surface area dA are defined as
| (17) |
By integrating Eq. (16), the total drag for uniform flow is
| (18) |
where 2πμU∞a is the form drag, and 4πμU∞a is the friction drag. Equation (18) is the classic sphere-drag formula of Stokes and is often used to calibrate optical trapping power by equating the trap force to the imposed fluid drag. Under unidirectional flow conditions and the absence of other external forces, the trapping force (FOT) is statically balanced with the fluid drag force on the cell, that is
| (19) |
The maximum trap force is determined from the maximum applied fluid velocity, where a cell remains trapped. As shear and normal stresses are proportional to the flow velocity, the maximum stress in a unidirectional flow scenario is limited by the maximum trapping power.
In the applied microfluidic environments, wall effects are prevalent. Equation (18) is then modified to create the Faxen drag formula [27], accounting for the influence of two equally spaced walls (L distance from the cell center)
| (20) |
as well as for two unequally spaced walls (L and 3L wall locations from the cell)
| (21) |
2.2.2.2 Planar extensional flow
In a pure two-dimensional extensional flow around a sphere, there is flow inward towards the sphere along the ±y direction, and flow outward directed away from the sphere in the ±x direction, with no out-of-plane (z direction) velocity (Fig. 1(c)). This linear, two-dimensional extensional flow microenvironment is recreated in the microchannel cross junction described above for an x-y plane at a given z location.
For a nonrotating sphere suspended in a general linear flow, the fluid velocity field vector (u) is [25]
| (22) |
For the specific linear case of planar extensional flow, the strain rate tensor (E) is reduced to the shear rate magnitude (γ̇) as components along the matrix diagonal
| (23) |
Substituting the strain rate tensor and the spherical polar coordinate representation of the general position vector (x) into Eq. (22), the velocity components are
| (24) |
| (25) |
| (26) |
where, as stated earlier, the characteristic velocity (U=γ̇a) is the product of the local shear rate environment of the undisturbed flow, multiplied by the perturbing cell boundary location (radius). Note that uϕ and the variations in the ϕ direction, as defined in Eq. (26), are identically zero in the experimental measurement plane (ϕ=0 deg). With Eqs. (24) and (25), and the constitutive Eqs. (4) and (5), the specific normal and shear stresses at the midplane of the sphere in the planar extensional flow are
| (27) |
| (28) |
When integrating the stress tensor, as defined by the normal (form drag) and shear (friction drag) stress components in Eq. (16), the total drag here is equal to zero. This reflects the stable or saddle-point nature of the cross junction’s geometric center.
2.2.3 Numerical Analysis
To assist in the validation of the defined stresses, and extend the analysis beyond the capabilities of theoretical assumption, a computational model established a quantitative comparison for the cross junction flow [19]. With the measured local flow velocities as input, the flow scenario was modeled with computational fluid dynamics (cfd) software (mesh creation in STAR-Design and solution computation in STAR-CCM+, CD-adapco, Seattle, WA). A 25 µm minimum length limitation was discovered in STAR-Design. This limitation required the model to be scaled by 1000 times while keeping the Reynolds number constant, similar to the described experiments. Thus, the modeled characteristic length increased while the characteristic velocity decreased. Symmetry of the cross junction geometry reduced the computational domain to an octant section. Individual mesh properties were adjusted by setting a maximum triangle size and surface thickness while constructing a composite mesh. The mesh resolution on and around the sphere was constructed to exceed the resolution of the experimental PIV data, particularly on the x-y symmetry plane at the channel center, coincident with the flow stagnation point (x, y, z=0). The resulting flow field velocities were generated by iteratively “solving” components within the Navier–Stokes and continuity equations, identifying the final solution based on a minimum residual, now standard practice in CFD calculations [28]. These three-dimensional solutions provided midplane numerical results to calculate cell perimeter velocity gradients, and finally, the local normal and shear stresses, as previously described.
2.2.4 Principal Stresses and Localized Elements
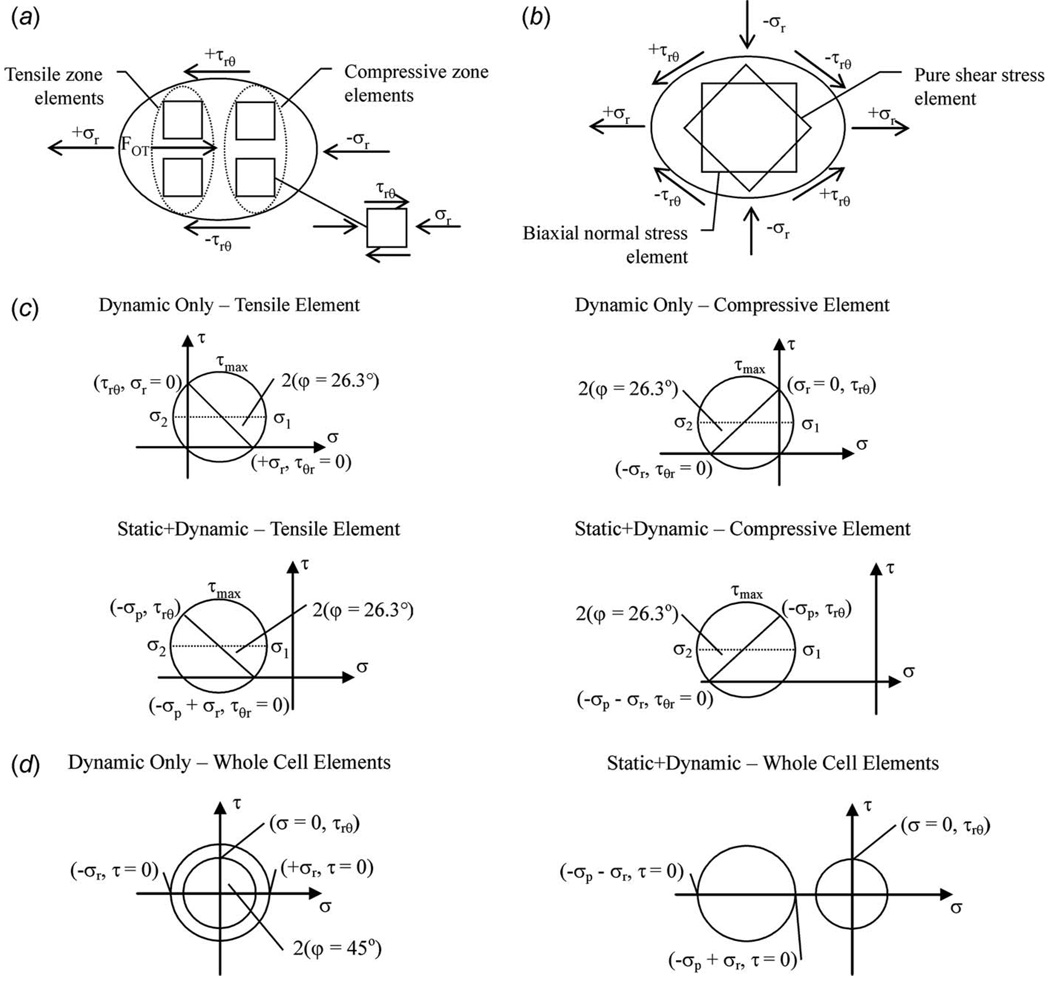
Principal stresses were determined for the applied perimeter stress states, as extended to intracellular elements representing specific cellular zones (Fig. 3). The principal stresses describe internal or whole-cell elements with a rotated perspective, which minimizes or eliminates local shear stresses. Maximum and minimum principal stresses act on mutually perpendicular planes, and are the algebraically largest and smallest normal stresses at a point in the described stress fields [29]. Although the cellular biomechanical microenvironment is a three-dimensional stress state, the layerwise analysis here again examines the perimeter stresses at a central plane (z=0). Thus, the two-dimensional maximum (σ1=σmax) and minimum (σ2=σmin)normal stresses were obtained from
| (29) |
when expressed in Cartesian coordinates or expressed in polar coordinates, as applied here
| (30) |
The principal stress analysis was also expressed graphically through a Mohr’s circle construction (Fig. 3), where the graphed circular components are identified from Eq. (29) as the center(σc), projected segment (s), and radius (R), defined as
| (31) |
The rotation of an internal or whole-cell principal element representing an orientation minimizing (φ) or maximizing (φ+45 deg) shear stress is then calculated as
| (32) |
Fig. 3.
Localized theoretical elastic elements representing applied stresses due to (a) unidirectional and (b) bidirectional flow fields (only hydrodynamic state shown with mild deformation into ellipsoid shape). Mohr’s Circle characterizations of two-dimensional normal (σr with or without σp) and shear (τrθ) stresses with conversion into planar principal stresses (σ1 and σ2) and maximum shear stress (τmax) for (c) straight and (d) cross-junctional channel flow conditions (axes not drawn to scale). The rotation of the element required to minimize or maximize shear stress is also shown (φ).
3 Results
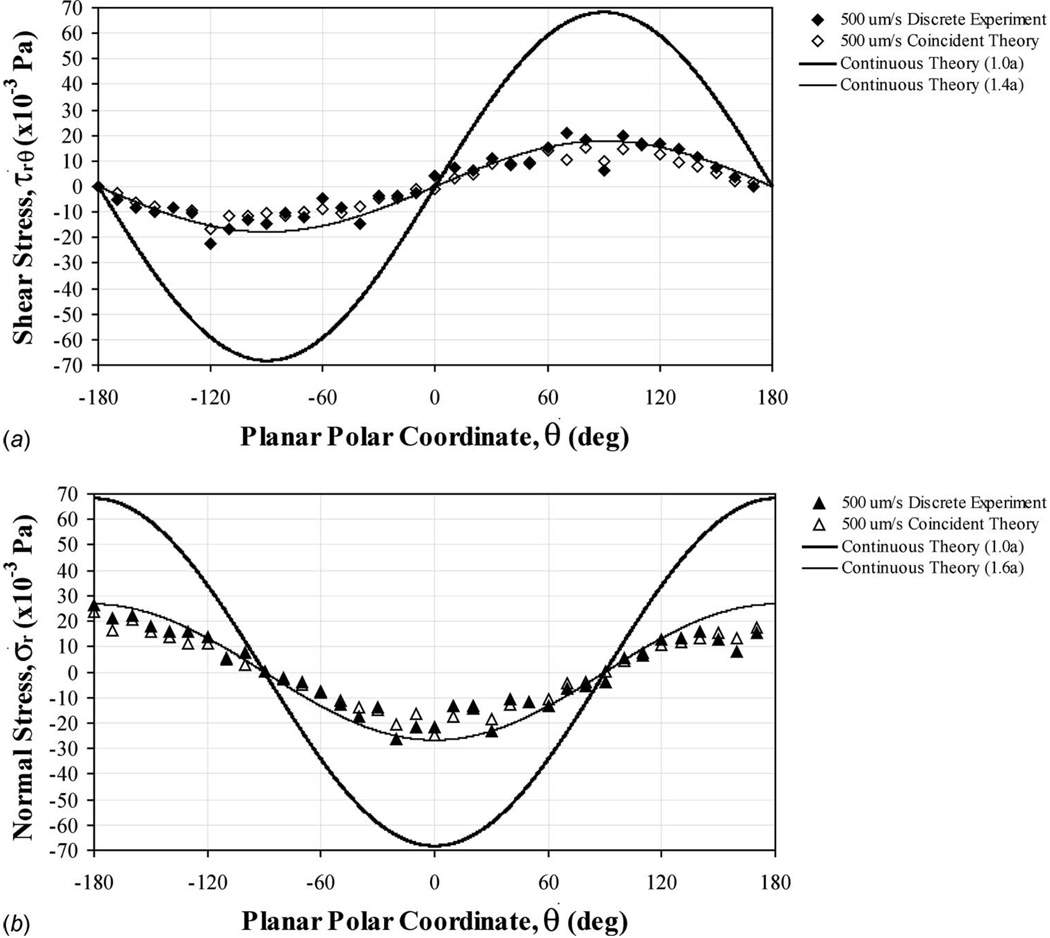
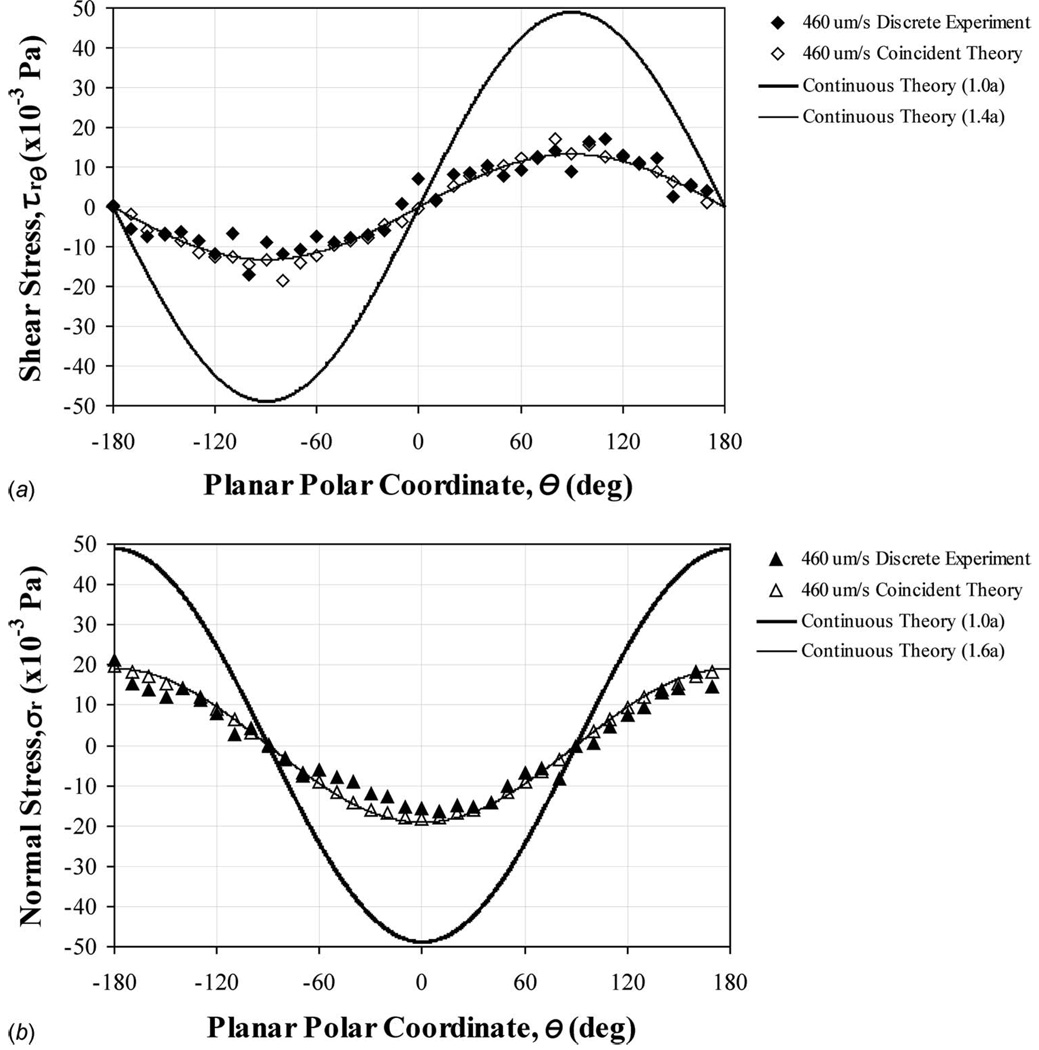
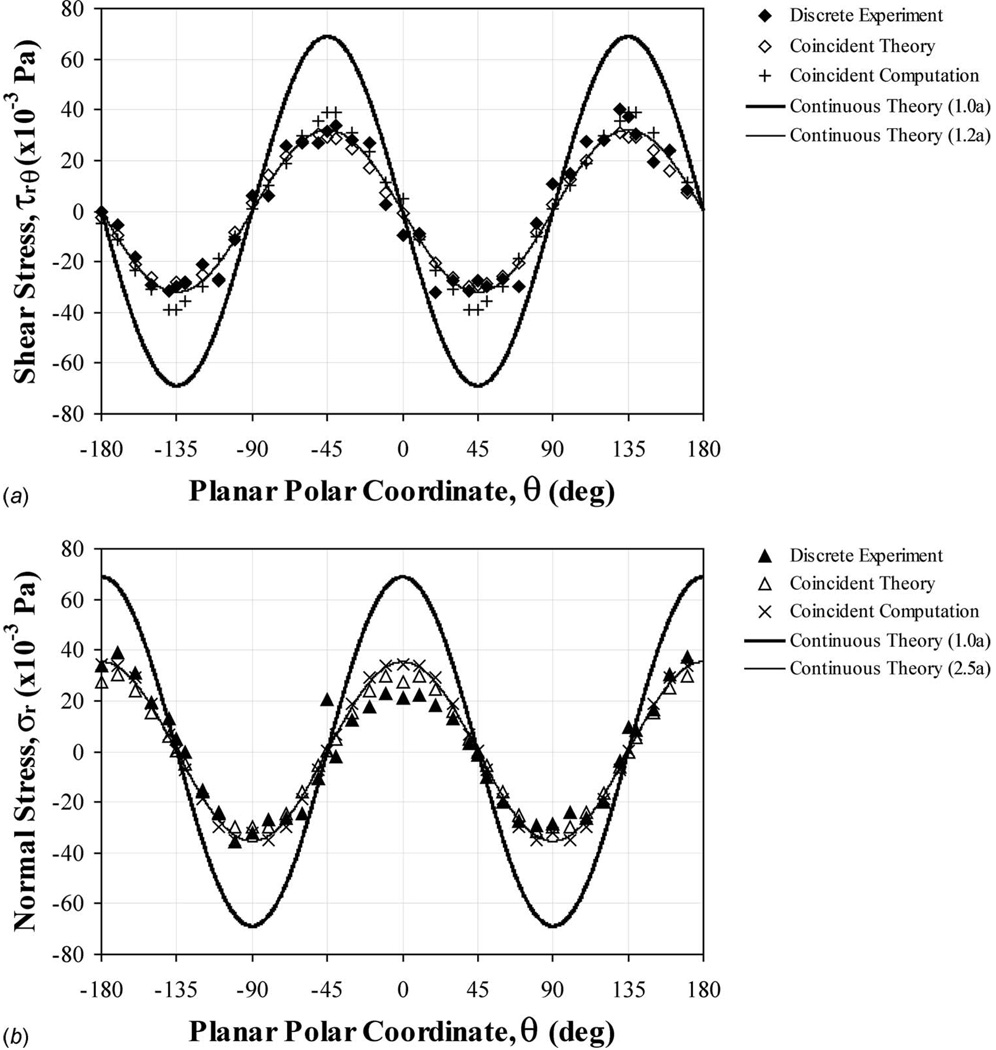
Flow velocities were mapped within a central plane bisecting the tested microspheres, to match the experimental fluid-based loading environments for cell biomechanics (Fig. 1). Applied shear and normal stresses were calculated for both the experimental and the theoretical flow velocity data in the region surrounding the surface perimeter of the analog cell structures (Fig. 2). Hydrodynamic stresses produced sinusoidal patterns indicating localized dependencies. Superimposed hydrostatic pressures (p) were much larger for the uniform flow field generated by moving the fluid sample (−1.469 Pa, Fig. 4), gravity driven flow through a straight microchannel (−73.45 Pa, Fig. 5), and gravity driven flow through a microchannel cross junction (−119.75 Pa, Fig. 6). Correlations were consistently strong when relating experimental to theoretical stresses at coincident points within the region of examination (R2>0.92).
Fig. 4.
(a) Shear and (b) normal hydrodynamic stresses applied around the central perimeter (θ=0 to ±180 deg at z=0) of a stationary microsphere (a=10.9 µm radius) in uniform flow (nonchannelized, stage motion). Coincident experimental and theoretical data were compared in the region near the microsphere surface. These experimental and theoretical values were strongly correlated for both shear (R2=0.938) and normal (R2=0.964) stresses. Continuous theoretical data were produced to explore surface stresses (Eqs. (14) and (15)). The total normal stress (static plus dynamic) would have an additional pressure, p=−1.469 Pa, superimposed over the entire surface (Eq. (4)).
Fig. 5.
Experimental and theoretical (a) shear and (b) normal stresses applied around the central perimeter (θ=0 to ±180 deg at z=0) of a stationary microsphere (a=14.0 µm radius) in gravity driven unidirectional flow (straight channel). Coincident data were compared in the region near the microsphere surface. These experimental and theoretical values were strongly correlated for both shear (R2=0.916) and normal (R2=0.974) stresses. Continuous theoretical data were produced to explore surface stresses (Eqs. (14) and (15)). The total normal stress (static plus dynamic) would have an additional pressure, p=−73.45 Pa, superimposed over the entire surface (Eq. (4)).
Fig. 6.
Experimental, theoretical, and numerical (a) shear and (b) normal stresses, as applied around the central perimeter (θ=0 to ±180 deg at z=0) of a stationary microsphere (a=10.3 µm radius) in gravity driven bidirectional flow (cross junction channel). Coincident experimental and theoretical values were strongly correlated for both shear (R2=0.964) and normal (R2=0.927) stresses. Continuous theoretical data were produced to explore surface stresses (Eqs. (24) and (25)). The total normal stress (static plus dynamic) would have an additional pressure, p=−119.75 Pa, superimposed over the entire surface (Eq. (4)).
The experimental applied algebraic maximum and minimum stresses were used to determine principal stresses within intracellular and whole-cell stress elements as a precursor to future localized strain analysis. The static influence of fluid pressure tended to dominate the principal stress state in all three loading scenarios (Fig. 3). However, the rotation of the hypothetical elements needed to minimize or maximize shear stress remained the same in all unidirectional flow combinations (τmin at φ=26.3 deg, τmax at φ=71.3 deg). In extensional flow, the shear stress-only element would require a rotation of φ=45 deg to minimize shear (representing its current maximized state). The normal stress-only element is by definition, without shear stress, and would require an opposite rotation (φ=−45 deg) in order to isolate shear stress. Superposition allowed the combination of these two element arrangements into an overall principal stress state. All applied forces and stresses are summarized, clarifying the micromechanical manipulation environments designed for cell biomechanics (Table 1). Microfluidics provided a refined and subtle manipulation of single cells, in contrast with more dramatic loading found in population assessments.
Table 1.
Summary of applied forces and stress states in flow environments designed for microscale biomechanical manipulation of cells
| Uniform flow: U∞=500 µm/s automated stage driven |
Straight channel flow: U∞=460 µm/s gravity driven |
Cross junction flow: U=128 µm/s gravity driven |
|||
|---|---|---|---|---|---|
| Representative microsphere | Polystyrene, diameter | 21.8 µm | 28.0 µm | 20.6 µm | |
| Optical trap manipulation | Single (FOT) | ≥FD | ≥FD | ~0 pN | |
| Dual (FOT) | NA | NA | NA | ||
| Trap stiffness (k) a | 4–70 pN/µm | 4–70 pN/µm | NA | ||
| Hydrostatic pressure | p∞=−ρgh | −1.469 Pa | −146.9 Pa | −239.5 Pa | |
| (h=150 µm) | (h=15 mm) | (h=24.5 mm) | |||
| −1.469 Pa(p=p∞) | −73.45 Pa | −119.75 Pa | |||
| Hydrodynamic drag forces | Δp | 0 | ~0 Pa | ~0 Pa | |
| Stokes drag (FD) | 101.9 pN | 120.4 pN | 0 | ||
| Faxen drag (FD−u or FD−e) | 129.6 pN | 230.5 pN | 0 | ||
| (wall effects) | (unequally spaced) | (equally spaced) | |||
| Peak normal stress | Measured σr | ±0.026 Pa | ±0.021 Pa | ±0.039 Pa | |
| Calculated-theory σr | ±0.024 Pa | ±0.020 Pa | ±0.030 Pa | ||
| Calculated-numerical σr | ±0.035 Pa | ||||
| Calculated-surface σr | ±0.068 Pa | ±0.049 Pa | ±0.069 Pa | ||
| Peak shear stress | Measured τrθ | ±0.022 Pa | ±0.017 Pa | ±0.038 Pa | |
| Calculated-theory τrθ | ±0.017 Pa | ±0.019 Pa | ±0.031 Pa | ||
| Calculated-numerical τrθ | ±0.039 Pa | ||||
| Calculated-surface τrθ | ±0.068 Pa | ±0.049 Pa | ±0.069 Pa | ||
| Principal stresses | Dynamic-only | ||||
| Tension σ1, σ2,τmax | 0.039, −0.013, 0.037 | 0.030, −0.009, 0.028 | 0.077, −0.077, 0.077 | ||
| Compression σ1, σ2, τmax | 0.013, −0.039, 0.037 | 0.009, −0.030, 0.028 | |||
| Static+Dynamic | |||||
| Tension σ1, σ2, τmax | −1.430, −1.482, 0.037 | −73.42, −73.46, 0.028 | −119.67, −119.83, 0.077 | ||
| Compression σ1, σ2, τmax | −1.456, −1.508, 0.037 | −73.44, −73.48. 0.028 |
Reported in Ref. [16].
Note: For principal stress analysis, tensile and compression zone elements were identified in cells exposed to unidirectional flow. In bidirectional flow, the entire cell treated as the superposition of two elements. Units are in Pa.
4 Discussion
In the struggle to further understand and control living systems, research is increasingly focused on single cell investigation. This work calculated the local normal and shear stresses applied to suspended microspheres in order to determine the magnitude of hydrodynamic stresses experienced by single cells suspended in fluidic environments, and more specifically, to clarify the performance of the µPIVOT for single cell analysis. This approach characterizes biological cell geometries currently being examined in µPIVOT environments.
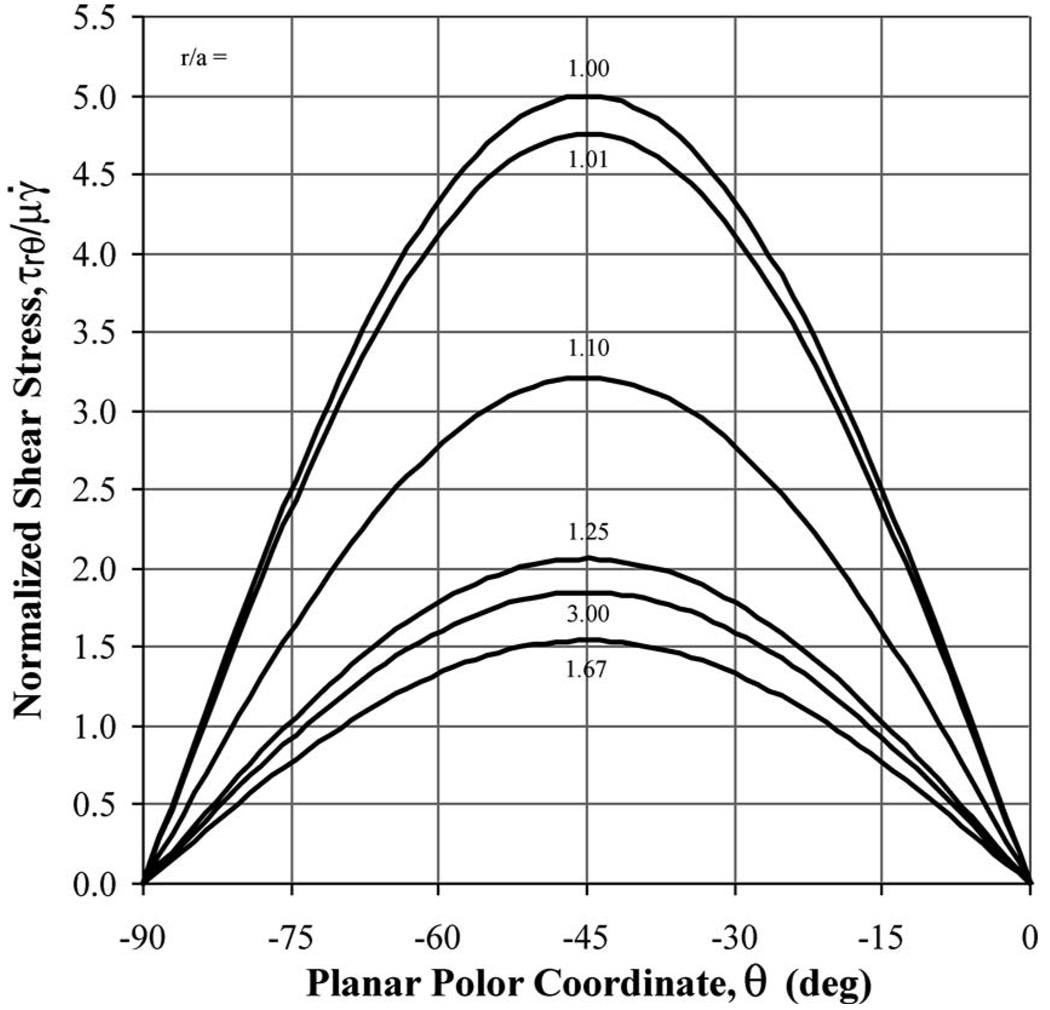
Although revealing, specific limitations were evident in the presented experimental approach. In the µPIV experimental technique, velocities were calculated in interrogation regions by cross correlating two image pairs within the same pixel subdomain. The resolution of velocity measurements is set by the size of the interrogation region. For the experimental results reported above, the interrogation region was set at 16 × 16 pixels or 1.74 × 1.74 µm2. As a result in the analysis, fluid stresses were calculated in the vicinity of the suspended sphere and not at the sphere surface. The theoretical shear stress, as a function of angle for different radial positions away from the sphere (Fig. 7), has a maximum amplitude at the sphere surface, decreases to a minimum amplitude at r / a= 1.67, then rebounds to the freestream stress value for r / a>3. As a result, the shear stress value at r / a=1.25 is nearly indistinguishable (within experimental error) from the freestream value. Therefore, to accurately measure the shear stress near a suspended cell, and capture the actual disturbance flow generated by the cell, measurements must be made within 0.25 radii from the cell surface. For a 10 µm radius cell, velocity measurements within 2.5 µm of the cell membrane would be required to capture this influence. The 16×16 pixels interrogation used in this study provides velocity measurements within this range. However, to truly measure stress at the cell surface, dramatically smaller interrogation regions are required. As shown here, stress measurements at r / a=1.01 are nearly equal (again within experimental error) to the actual stress at the surface. For a 10 µm radius cell, measurements within 100 nm would be required to accurately measure surface stresses. With the current µPIV system, a single pixel corresponds to an imaged area of 109×109 nm2. Thus, single pixel interrogation PIV, a technique currently being developed [30,31], is required to truly resolve stresses at the cell surface. However, this may not be necessary. As shown here, the disturbance flow shear stress is resolvable for r / a<1.1. An interrogation region of 8×8 pixels is within this range for disturbance flow around a 10 µm sphere, and can be resolved with the current µPIV technique [18]. Additionally, the local disturbance flow can be modeled computationally with the imaged cell morphology combined with the undisturbed flow state to extrapolate the stresses on the cell surface when it is introduced to the flow environment.
Fig. 7.
Normalized and thereby dimensionless shear stress (τrθ/μγ̇) plotted as a function of dimensionless radial position (r /a) for a quarter section of a sphere suspended in planar extensional flow. Shear stress is at maximum at the sphere surface, at minimum for r/a=1.67, and approximately equal to the freestream value for r/a>3.
Recent single cell biomechanics studies applied a range of stresses typically in unidirectional flow states over attached cells. Adhered single leukocytes experienced much larger shear (1.10 Pa) and normal (0.35 Pa) stresses within a parallel-plate flow chamber with higher applied flow velocities (14 mm/s), as modeled with finite element analysis [32]. Similarly, a single adhered leukocyte was analyzed with both particle image velocimetery and computational fluid dynamics during a large flow (15.8 mm/s) in a microfluidic channel, creating a maximum shear stress of 0.386 Pa [33]. These flow velocities were enabled by adhesion forces, which are sufficiently large to overcome the applied fluid drag. For optically trapped cells, the maximum trapping force is substantially smaller than the adhesion forces in monolayer studies (Table 1). While higher trapping forces can theoretically be generated by increasing the trapping laser power, adverse heating of the cell becomes significant as power increases [18,34]. As a result, the maximum trapping power is limited to tens of pN. Therefore, the maximum hydrodynamic stress that may be applied to a cell suspended in a straight microchannel or uniform flow is limited to hundredths of a Pa. When compared with hydrostatic pressure (1–100 Pa), this relatively small hydrodynamic stress may be insufficient to induce cell deformation, let alone biological responses.
While hydrodynamic stresses are limited in uniform and straight channel flow scenarios, no such limitation exists for the two-dimensional extensional flow generated in a cross junction. Following the drag force calculation method previously described, integration of the normal and shear stresses around the surface of a suspended sphere produces a zero net drag in all directions if the sphere is positioned at the stagnation point (center) of the two-dimensional extensional flow. Theoretically, if a cell is positioned perfectly at the stagnation point, no trapping force is required to maintain its position, regardless of the applied shear rate, effectively creating a hydrodynamic trap. In reality, the stagnation point represents a saddle point and is unstable to perturbations along the x axis. However, only a small force, much less than the maximum trapping force, is required to maintain the sphere at the stagnation point (Table 1). For the extensional environment described here, a relatively low shear rate was examined. However, the potential exists for dramatically higher hydrodynamic stresses (at least 100 times greater than reported). In addition, the dominant nature of the hydrostatic stress state may be mitigated by proper cross junction design. Therefore, while the biological effects of hydrodynamic stresses in uniform and straight channel flows around suspended cells appear limited, significant cell deformation and biological responses are at least possible for single cells suspended in cross junction flows.
The advantage in the presented line of research is the opportunity to assess isolated cell biomechanics with eventual correlations to mechanotransduction and diseases, with or without cellular adhesion responses. With an improved resolution, applied stresses to cell membrane structures, and the elastic membrane itself, can be assessed in a detailed stress versus strain response.
Acknowledgment
Cell culture experiments were facilitated by Dr. Shelley R. Winn of the Oregon Health and Science University. Funding for the resources and activities described herein were provided by the National Science Foundation Major Research Instrumentation Program (Grant No. CBET-0521637), an Academic Research Enhancement Award (Grant No. EB007077) and an Exploratory Program Award (Grant No. MD003350) both from the National Institutes of Health, the Oregon Engineering Technology and Industry Council, the Collins Medical Trust, and a Portland State University Faculty Enhancement Grant.
Contributor Information
Sean S. Kohles, Department of Mechanical and Materials Engineering, Portland State University, Portland, OR 97207; Department of Surgery, Oregon Health and Science University, Portland, OR 97239, kohles@cecs.pdx.edu.
Nathalie Nève, Department of Mechanical and Materials Engineering, Portland State University, Portland, OR 97207.
Jeremiah D. Zimmerman, Department of Mechanical and Materials Engineering, Portland State University, Portland, OR 97207.
Derek C. Tretheway, Department of Mechanical and Materials Engineering, Portland State University, Portland, OR 97207.
References
- 1.Lee GY, Lim CT. Biomechanics Approaches to Studying Human Diseases. Trends Biotechnol. 2007;25(3):111–118. doi: 10.1016/j.tibtech.2007.01.005. [DOI] [PubMed] [Google Scholar]
- 2.Afoke NY, Byers PD, Hutton WC. Contact Pressures in the Human Hip Joint. J. Bone Joint Surg. Br. 1987;69:536–541. doi: 10.1302/0301-620X.69B4.3611154. [DOI] [PubMed] [Google Scholar]
- 3.Hodge WA, Carlson KL, Fijan RS, Burgess RG, Riley PO, Harris WH, Mann RW. Contact Pressures From an Instrumented Hip Endoprosthesis. J. Bone Joint Surg. Am. 1989;71:1378–1386. [PubMed] [Google Scholar]
- 4.Buschmann MD, Gluzband YA, Grodzinsky AJ, Hunziker EB. Mechanical Compression Modulates Matrix Biosynthesis in Chondrocyte/Agarose Culture. J. Cell Sci. 1995;108:1497–1508. doi: 10.1242/jcs.108.4.1497. [DOI] [PubMed] [Google Scholar]
- 5.Ehrlich MG, Armstrong AL, Treadwell BV, Mankin HJ. The Role of Proteases in the Pathogenesis of Osteoarthritis. J. Rheumatol. 1987;14:30–32. [PubMed] [Google Scholar]
- 6.Buckwalter JA, Martin JA, Brown TD. Perspectives on Chondrocyte Mechanobiology and Osteoarthritis. Biorheology. 2006;43:603–609. [PubMed] [Google Scholar]
- 7.Kohles SS, Wilson CG, Bonassar LJ. A Mechanical Composite Spheres Analysis of Engineered Cartilage Dynamics. J. Biomech. Eng. 2007;129(4):473–480. doi: 10.1115/1.2746366. [DOI] [PMC free article] [PubMed] [Google Scholar]
- 8.Cross SE, Jin Y-S, Rao J, Gimzewski JK. Nanomechanical Analysis of Cells From Cancer Patients. Nat. Nanotechnol. 2007;2:780–783. doi: 10.1038/nnano.2007.388. [DOI] [PubMed] [Google Scholar]
- 9.Sipe JD. Tissue Engineering and Reparative Medicine. Ann. N. Y. Acad. Sci. 2002;961:1–9. doi: 10.1111/j.1749-6632.2002.tb03040.x. [DOI] [PubMed] [Google Scholar]
- 10.Hunt TP, Westervelt RM. Dielectrophoresis Tweezers for Single Cell Manipulation. Biomed. Microdevices. 2006;8(3):227–230. doi: 10.1007/s10544-006-8170-z. [DOI] [PubMed] [Google Scholar]
- 11.Evander M, Johansson L, Lilliehorn T, Piskur J, Lindvall M, Johansson S, Almqvist M, Laurell T, Nilsson J. Noninvasive Acoustic Cell Trapping in a Microfluidic Perfusion System for Online Bioassays. Anal. Chem. 2007;79(7):2984–2991. doi: 10.1021/ac061576v. [DOI] [PubMed] [Google Scholar]
- 12.Lutz BR, Chen J, Schwartz DT. Hydrodynamic Tweezers: 1. Noncontact Trapping of Single Cells Using Steady Streaming Microeddies. Anal. Chem. 2006;78(15):5429–5435. doi: 10.1021/ac060555y. [DOI] [PubMed] [Google Scholar]
- 13.Walker LM, Holm A, Cooling L, Maxwell L, Oberg A, Sundqvist T, El Haj AJ. Mechanical Manipulation of Bone and Cartilage Cells With Optical Tweezers. FEBS Lett. 1999;459:39–42. doi: 10.1016/s0014-5793(99)01169-2. [DOI] [PubMed] [Google Scholar]
- 14.Guck J, Ananthakrishnan R, Mahmood H, Moon TJ, Cunningham CC, Kas J. The Optical Stretcher: A Novel Laser Tool to Micromanipulate Cells. Biophys. J. 2001;81:767–784. doi: 10.1016/S0006-3495(01)75740-2. [DOI] [PMC free article] [PubMed] [Google Scholar]
- 15.Bao G, Suresh S. Cell and Molecular Mechanics of Biological Materials. Nature Mater. 2003;2(11):715–725. doi: 10.1038/nmat1001. [DOI] [PubMed] [Google Scholar]
- 16.Nève N, Lingwood JK, Zimmerman J, Kohles SS, Tretheway DC. The µPIVOT: An Integrated Particle Image Velocimetry and Optical Tweezers Instrument for Microenvironment Investigations. Meas. Sci. Technol. 2008;19(9):095403. doi: 10.1088/0957-0233/19/9/095403. [DOI] [PMC free article] [PubMed] [Google Scholar]
- 17.Kohles SS, Nève N, Lingwood JK, Zimmerman J, Winn SR, Zelick RD, Tretheway DC. An Integrated Optical Instrument and Microfluidics for Isolated Chondrocyte, Osteoblast, and Fibroblast Biomechanics. Transactions of the 54th Annual Meeting of the ORS; 2008. Paper No. 1168. [Google Scholar]
- 18.Nève N, Lingwood JK, Winn SR, Tretheway DC, Kohles SS. Microfluidics Supporting an Optical Instrument for Multimodal Single Cell Biomechanics. 2007 ASME Paper No, 42004. [Google Scholar]
- 19.Zimmerman JD, Kohles SS, Tretheway DC. Computational Microfluidic Models Supporting Studies in Cell Biomechanics. Proceedings of the Sigma Xi, Annual Meeting and Student Research Conference; Nov. 20–23; Washington, D.C.. 2008. Paper No. EN-04. [Google Scholar]
- 20.Neuman KC, Block SM. Review Article: Optical Trapping. Rev. Sci. Instrum. 2004;75(9):2787–2809. doi: 10.1063/1.1785844. [DOI] [PMC free article] [PubMed] [Google Scholar]
- 21.Santiago JG, Wereley ST, Meinhart CD, Beebe DJ, Adrian RJ. A Particle Image Velocimetry System for Microfluidics. Exp. Fluids. 1998;25:316–319. [Google Scholar]
- 22.Meinhart CD, Wereley ST, Santiago JGA. PIV Algorithm for Estimating Time-Averaged Velocity Fields. ASME J. Fluids Eng. 2000;122(2):285–289. [Google Scholar]
- 23.Papanastasiou TC, Georgio GC, Alexandrou AN. Viscous Fluid Flow. New York: CRC; 2000. [Google Scholar]
- 24.White FM. Viscous Fluid Flow. 3rd ed. New York: McGraw-Hill; 2006. [Google Scholar]
- 25.Leal LG. Advanced Transport Phenomena: Fluid Mechanics and Convective Transport Processes. New York: Cambridge University Press; 2007. [Google Scholar]
- 26.Bird RB, Stewart WE, Lightfoot EN. Transport Phenomena. New York: Wiley; 1960. [Google Scholar]
- 27.Happel J, Brenner H. Low Reynolds Number Hydrodynamics: With Special Application to Particulate Media. Groningen: Noordhoff; 1983. [Google Scholar]
- 28.Patankar SV, Spalding DB. A Calculation Procedure for Heat, Mass and Momentum Transfer in Three-Dimensional Parabolic Flows. Int. J. Heat Mass Transfer. 1972;15:1787–1806. [Google Scholar]
- 29.Cook RD, Young WC. Advanced Mechanics of Materials. New York: Macmillan; 1985. [Google Scholar]
- 30.Westerweel J, Geelhoed PF, Lindken R. Single-Pixel Resolution Ensemble Correlation for Micro-PIV Applications. Exp. Fluids. 2004;37:375–384. [Google Scholar]
- 31.Wereley S, Meinhart C, Gui L, Tretheway DC, Sud A. Single Pixel Evaluation of Microchannel Flows. Proceedings of the IMECE. 2005 Paper No. 83065. [Google Scholar]
- 32.Su SS, Schmid-Schönbein GW. Fluid Stresses on the Membrane of Migrating Leukocytes. Ann. Biomed. Eng. 2008;36(2):298–307. doi: 10.1007/s10439-007-9406-7. [DOI] [PMC free article] [PubMed] [Google Scholar]
- 33.Leyton-Mange J, Yang S, Hoskins MH, Kunz RF, Zahn JD, Dong C. Design of a Side-View Particle Imaging Velocimetry Flow System for Cell-Substrate Adhesion Studies. J. Biomech. Eng. 2006;128(2):271–278. doi: 10.1115/1.2165689. [DOI] [PMC free article] [PubMed] [Google Scholar]
- 34.Neuman KC, Chadd EH, Liou GF, Bergman K, Block SM. Characterization of Photodamage to Escherichia Coli in Optical Traps. Biophys. J. 1999;77(5):2856–2863. doi: 10.1016/S0006-3495(99)77117-1. [DOI] [PMC free article] [PubMed] [Google Scholar]


