Abstract
Motion of patients undergoing cardiac SPECT perfusion imaging causes artifacts in the acquired images which may lead to difficulty in interpretation. Our work investigates a technique of obtaining patient motion estimates from retro-reflective markers on stretchy bands wrapped around the chest and abdomen of patients being imaged clinically. Motion signals obtained from the markers consist of at least two components, body motion (BM) and periodic motion (PM) due to respiration. We present a method for separating these components from the motion-tracking data of each marker, and then report a method for combining the BM estimated from chest markers to estimate the 6-degree-of-freedom (6-DOF) rigid-body motion (RBM) of the heart. Motion studies of volunteers and patients are used to evaluate the methods. Illustrative examples of the motion of the heart due to patient body movement and respiration (upward creep) are presented and compared to estimates of the motion of the heart obtained directly from SPECT data. Our motion-tracking method is seen to give reasonable agreement with the motion-estimates from the SPECT data while being considerably less noisy.
Keywords: Index Terms, Motion estimation, signal processing, single photon emission computed tomography
I. Introduction
In cardiac SPECT imaging, motion of the heart occurs due to voluntary patient movement, respiration, and cardiac contraction. Herein we are interested in correcting patient studies for the first two of these. It has been reported [1], [2] that voluntary patient motion occurs in about 25% of studies and causes significant artifacts in 5%. Due to the lengthy acquisition duration all patients breathe during SPECT imaging. Thus the development of methods to correct for both voluntary body motion of the patient and respiratory motion are of interest to reduce these sources of degradation.
Respiratory motion of the abdomen results primarily from the motion of the diaphragm and can be accurately measured using systems which track retro-reflective markers such as the Varian RPM [3]. It has been shown that the respiratory motion (RM) of the heart is correlated with the motion of the diaphragm [4], and hence with that of markers on the anterior of the abdomen. Thus the vertical motion of the markers on the abdomen when acquired in temporal synchrony with list-mode emission studies can be used to create either phase- [5], [6] or amplitude- [7]–[9] binned projections. These in turn can be used to correct for respiratory motion of the heart [7]–[9]. External devices which track the motion of markers on patient bodies can also be used to follow body motion [10]–[12]. If the body motion can be approximated as that of a rigid-body, then methods have been developed to correct it during reconstruction [13].
Our setup for motion-tracking during cardiac SPECT by stereo-imaging of retro-reflective markers attached to stretchy bands wrapped about the chest and abdomen of patients is shown in Fig. 1. Since both periodic respiratory motion (PM) and body motion (BM) of patients will be reflected in the motion-tracking data obtained from the markers and are corrected differently, it is essential to develop methods to estimate each from this data.
Fig. 1.
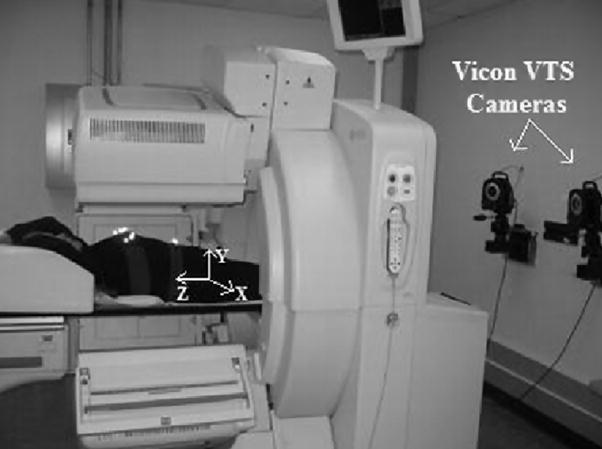
SPECT and Vicon Visual-Tracking System (VTS) setup. Shown are two near-infra-red cameras mounted on the wall at the foot-end of the gantry. Three more cameras (not shown) are mounted on the wall at the head-end of the gantry. The retro-reflective markers on stretchy bands may be seen as bright spots on the chest and the abdomen of the subject. The coordinate system for the VTS as calibrated to the SPECT coordinate system is shown with X being lateral, Y vertical, and Z axial. The arrows indicate positive direction of the axes. The coordinate system of the projections is X′, and Y′.
Previously, separation of these two types of motion has been investigated by us and we have shown that the correction of these motions brings an obvious improvement in image quality [14]. However, our previous studies used mostly phantoms or simulated motion. The objective of this study was to develop a method which was more robust when applied to actual patient studies. We now take a combined approach in estimating the motion components from the multiple markers placed on the patients, as opposed to analyzing the markers completely individually. We start with separation of the PM component for the vertical-axis of the abdominal markers because this is where we have observed respiratory motion (RM) to make its largest contribution to the motion-tracking signal. The dominant frequency obtained from this analysis is used as the starting point for separating BM from PM for all 3 axes for the chest markers. Then, the rigid-body motion (RBM) of the heart is computed using the BM components from all available chest markers, and the respiratory motion of the heart (RM) is computed using both the vertical PM component and the vertical BM component (corrected for patient motion) of the abdominal markers. The PM component of abdominal markers provides the periodic component of respiration, while the BM component provides the non-periodic respiratory trends. This combined signal is then used for amplitude binning the list-mode emission data for correction of RM of the heart. The details of our methods are given in the following section. Our preliminary studies of the Vicon VTS used to acquire the volunteer and patient data employed herein are reported elsewhere by McNamara, et al. [15].
II. Materials & Methods
A. Vicon Motion-Tracking System
The patients were setup for motion tracking as in Fig. 2, using five or more markers on the chest belt, and three markers on the abdominal belt. The chest belt is chosen to be wider than the abdominal belt, with markers arranged in a non-linear configuration on a single thin Velcro base. The attenuation introduced by a marker was estimated as the fractional % difference in counts obtained by imaging a Tl-201 flood source with and without a belt with 10 markers on it. The level of attenuation was found to be 2.4 ± 0.4%. Any added attenuation has the potential to impact image quality, thus all SPECT acquisitions are reconstructed with attenuation correction to minimize any impact. The marker arrangement is adapted to the patient geometry before acquisition is started by moving the markers around for better visibility by the cameras and also to reduce phantoms. The chest belt markers are used to obtain the rigid-body motion estimate of the heart. The abdominal belt is used primarily for extracting the respiration signal. During simultaneous acquisition of SPECT data and motion data, sometimes the Vicon VTS cameras cannot view some of the markers, and this may lead to gaps in the marker traces. This may happen due to obstruction of the line of sight of the Vicon cameras either by the camera-heads of the SPECT system itself, or by the patient’s arms, other parts of the body, or clothing. In a separate study [15] reporting motion-tracking in 77 patients under going cardiac-SPECT imaging we determined we could track the motion of 3 out of the 4 markers present on the chest belt with no gap in 94% of the studies. We need at least 3 markers to determine six-degree-of-freedom rigid-body-motion (6-DOFRBM). To increase the likelihood of success we have increased the number on markers on the chest belt as illustrated in Fig. 2.
Fig. 2.
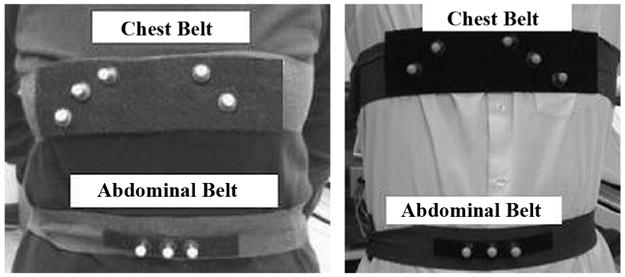
Marker configuration of the chest and abdomen for a female (left) and male (right) subject. The number of markers on the left and the right side are not fixed but changed according to the subject’s geometry. The marker position on the chest belt is adjusted to eliminate wobbling of markers placed on a part of the belt not making proper contact with the subject’s body. For the same reason, no markers are placed towards the center of the chest belt.
All motion tracking of volunteers and patients was performed with IRB approval and informed consent.
B. SPECT Imaging
Patients were imaged using the IRIX SPECT Imaging system post-administration of Tl-201 for assessment of relative cardiac perfusion. The SPECT system was set to acquire from two camera heads at 102 degrees apart acquiring 34 frames at 3 degrees each. Thus, the data consisted of 68 28-sec 2D projections acquired over 204 degrees, with 102 degrees each from the 2 heads. The first projection from head 2 and the last projection from head 1 (acquired 3 degrees apart but separated in time by the acquisition duration, i.e., about 15 min.) were used for determining if motion caused a net displacement of the patient’s heart between start and end of the study. Also, any movement of the patient along the axial (Z) direction causing a displacement of the heart can be seen as a shift in it’s location in the projections along vertical (Y′) dimension. Movement in the lateral (X) or vertical (Y) direction is more difficult to assess from the 2D projections, but can be observed as a shift or break in the sinogram of the heart along the lateral dimension of projections (X′-axis).
The SPECT studies were acquired in list-mode to enable temporal synchronization between the motion-tracking and the counts acquired by the Gamma-camera heads. The Irix SPECT system records up to 2 digital and 2 analog inputs in the list-mode file along with the counts from the camera-heads and timing marks every 10 msec. As described in more detail elsewhere [12], [15] we take advantage of these inputs to record a VTS generated square-wave input signal which fluctuates between +2.78 volts and 0 volts every 5 sec. This signal is generated by the operator initiating through a button click on the GUI controlling VTS operation the collection of the motion-tracking information. Clicking of this button also sends a signal to the Irix SPECT system to start the SPECT acquisition. There is however a delay between the actual start of list-mode acquisition and the receiving of the signal of typically around 2 sec. That is why we also record the square-wave signal. The portion of the square-wave missing enables us to determine when initiation of SPECT acquisition actually occurred relative to the VTS. In tests we have determined the temporal agreement between the VTS and SPECT system to be on the order of 100 msec [12], [15]. The software to bin the list-mode data to frame was written by our group based on prototype software supplied by Philips.
C. Motion Tracking of Volunteers
Motion experiments involving volunteers were aimed at evaluating the performance of the motion separation algorithm discussed in the following section. The volunteers were asked to execute rotational movements at pre-determined times while lying in the gantry in supine position, and the motion of the volunteers was tracked using the Vicon Visual-Tracking System. Pure translational movement was produced by moving the patient bed in and out of the gantry.
D. Separation of Body Motion and Periodic Motion Components
The signal from each marker consists of 3 one-dimensional traces corresponding to the absolute X, Y and Z location of the marker in 3-D space of the SPECT coordinate system over time. In this coordinate system X is the lateral, Y is the vertical, and Z is the axial direction (see Fig. 1). Each of these traces have at least a periodic component (PM) due to respiration and a non-periodic component (BM) that manifests itself as sudden baseline changes (step-like waveform) due to patient motion, or slow drifts (ramp-like waveform) due to either patient motion or settling of respiration. In this paper, total-variation (TV) based iterative-smoothing [16] is used to remove oscillations due to respiration, while preserving edges that correspond to sudden movements. The non-periodic signal extracted is the BM, and the oscillation subtracted is the PM signal. The BM-PM separation algorithm is briefly outlined in the flowchart of Fig. 3.
Fig. 3.
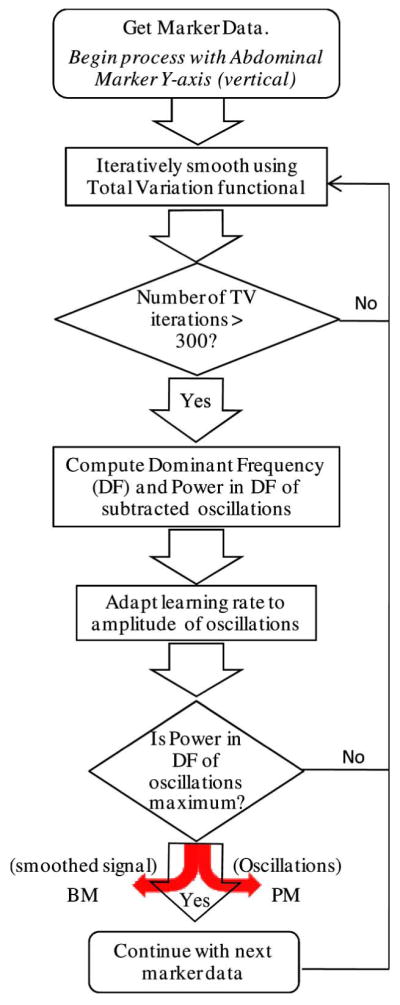
Flowchart for BM-PM separation from combined data. Difference between total marker motion and BM is taken as estimate of the PM of markers.
The motion separation algorithm is adapted to the patient’s respiratory frequency and amplitude to produce optimal smoothing. The PM component of the Y-axis (vertical) signal from the abdominal marker with the largest average amplitude of PM is extracted first before processing other markers because we have found that RM best manifests itself there. The respiratory frequency of the patient is assumed to be the dominant frequency of this component. Therefore, the exit criterion for iterative-smoothing of the first marker signal i.e., the Y-axis signal from an abdominal marker, is to maximize the power in the dominant frequency of the extracted oscillations. For all the signals that are smoothed thereafter, smoothing is continued until the power in the patient’s respiratory frequency (estimated above) of the oscillatory signal removed is maximized. The amplitude of oscillations in the marker signals due to respiration may vary over time, as in the case of stress studies or patients with breathing difficulties, thus the learning rate of iterative-smoothing is adjusted to be proportional to the amplitude of oscillations so that larger oscillations are smoothed more. As the TV-smoothing proceeds, the amplitude of oscillations subtracted reaches maximum. If TV is continued further, low-frequency trends will also be subtracted. Therefore, TV-smoothing is stopped after the power in the respiratory frequency of the oscillation signal reaches maximum.
The TV functional used herein is modified to include a non-linear function ϕ to preserve edges better:
| (1) |
where, ut is the derivative of the marker signal u(t), and ϕ is defined by:
| (2) |
This function suppresses very-high positive or negative values of the gradient ut, which occurs typically at jumps or discontinuities and is a commonly used sigmoidal non-linearity in neural networks [17].
E. Estimation of Respiratory Motion (RM) of the Heart From Abdominal Markers
The respiratory motion of the heart has been shown to be very well correlated with the anterior-posterior motion of the abdomen [3], [4]. This corresponds to the Y-axis signal of our abdominal markers. Thus we extract the signal to be used in binning our list-mode SPECT for respiration solely from this signal. If more than one marker is seen throughout imaging, then the one with the largest average amplitude for PM is employed. If the respiration of the patient varies with monotonic or slow trends such as upward creep (slow upward movement of the heart in the chest [18]), they appear in the BM extracted in the vertical Y-direction of abdominal markers. Therefore, the BM signal along Y-axis of the chosen abdominal marker is further analyzed to separate such trends from those due to patient motion, and add them to the PM signal along Y-axis to give the estimated RM of the heart. This is important for respiration correction using amplitude-binning. To determine if a change in the BM signal along Y-axis is due to motion or respiratory trend variations, the magnitude of the change is compared to the local peak-to-peak amplitude of the oscillatory respiration signal (PM). If the change is significant relative to the peak-to-peak amplitude of respiration and lasts longer than a minute, then it is considered to be due to motion. However, the RM estimated this way may contain small patient motion artifacts. This possibility and the resulting error in RM correction is currently being investigated through MRI studies of motion. In summary the main usage of the initial separation of PM from BM for the vertical component of the abdominal markers is to obtain an estimate of the dominant respiratory frequency for usage in the BM-PM separation for the chest markers as in most cases for the abdominal markers the two are combined back together for usage in amplitude binning list-mode studies to correct RM.
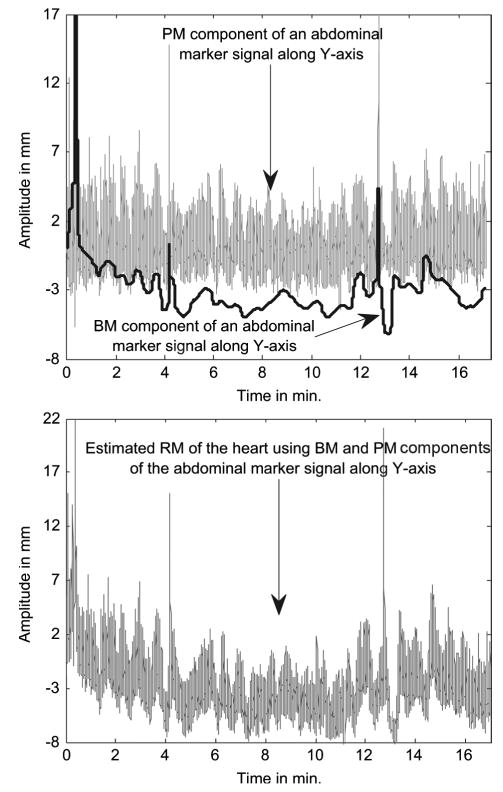
Fig. 4 shows an example of RM signal estimation for a patient. In this case, the BM has no evidence of significant patient motion, and all the trends correspond to variation in the respiration of the patient. Thus, the RM of the heart is obtained by adding back these trends to the PM along Y-axis extracted from this marker.
Fig. 4.
(Top) Example of periodic respiratory motion (PM) signal extracted from an abdominal marker’s Y-axis (vertical) signal, and the body-motion (BM) extracted from the same marker. The BM signal shows a downward trend in the first 4 min. along with slow sinusoidal variations in amplitude. These trends actually correspond to changes in the respiration of the patient and not real motion. (Bottom) The respiratory trends are subtracted from the BM and added to the PM signal to get the final RM signal that would be used for correction of respiratory motion of the heart.
F. Estimation of Rigid-Body Motion (RBM) of the Heart From Chest Markers
The 6-DOF RBM of the heart is estimated using the BM signals (in X, Y, and Z) from at least 3 chest markers which are in a non-coplanar configuration. The motion is computed using singular-value decomposition (SVD). The SVD method [19] finds the 6-DOF rotation and translation parameters given two sets of point locations. In our case, the chest markers are placed in a non-coplanar configuration as shown in the Fig. 2, and their BM signals are used to compute the frame-to-frame 6-DOF parameters. The SVD algorithm seeks to minimize the sum-squared error (SSE) between two sets of points (p0 and p1) in order to compute the rotation matrix (R) and translation (T) in the presence of noise (n). Thus,
| (3) |
where the subscript i refers to each point within the sets 0 and 1, and N is the total number of points within each set. Then, the sum-squared error (SSE) is
| (4) |
where i = 1, 2 … N. The sum-squared error is minimized by defining
| (5) |
where p̄0 and p̄1 are the centroids of the two point sets.
Then, the SVD of H is given by
| (6) |
where U and V are unitary matrices and A is a diagonal matrix. The rotation matrix (R) and translation vector (T) are then obtained as
| (7) |
| (8) |
G. Projection Data Based Check of Marker Motion Estimation
To check our estimated RBM of the heart we used patient SPECT data that had one of the three following indicators of motion:
A visible displacement of the heart between the start and end of the acquisition. Such motion of the heart would appear as a discontinuity (jump) of the location of the heart between the projections taken at the start and end of the study.
A visible displacement in the vertical (Y′) dimension of the 2D projections (i.e., axial or Z direction w.r.t. 3D SPECT space) at any point of time between the start and end of the study.
A break or shift in the sinogram (X′-axis) of the center-of-mass of the heart as an indicator of motion along lateral (X) or vertical (Y) directions w.r.t. 3D SPECT space.
In the case of upward creep, the motion is observed in the Y-direction in abdominal markers that causes the heart to move upwards in the axial Z-direction in 3D SPECT space, which corresponds to the vertical (Y′) direction in 2D projections. BM along Z-axis causing motion of the heart will also be seen along the vertical (Y′) direction in 2D SPECT projections. However, BM along X or Y directions is difficult to observe in the 2D projections, but some evidence may be found in the sinogram (as in 3 above).
For estimating the position of the heart in the 2D projections, the heart was segmented in some of the projections around LAO (left anterior oblique) using Fast Marching Level Set Segmentation [20]. In projections closer to RAO and RPO, the heart was barely visible in the projections, so no motion indicators could be faithfully extracted. The segmented image of the heart was used to compute the center-of-mass of the heart pixels and determine motion.
As stated earlier the last projection from camera head 1, and first projection from head 2 are separated by 3 degrees and the time elapsed between acquisition of these projections is the same as the duration of the SPECT imaging (about 15 min.). Thus, these projections are used to examine motion indicator 1. Also, the axial center-of-mass computed from these projections is used to examine motion indicator 2. For SPECT 2D projections, the motion indicator 3 is calculated as the lateral (X′) center-of-mass of the segmented heart pixels (x′comSPECT) The computation from external markers of this motion (x′commarker) is performed as follows:
| (9) |
where θ = 2π * k/M, k = projection index, M = total number of projections, xcenter = pixel location of the center of the detectors (= 63.5 for 128 × 128 matrix), and x and y correspond to the pixel location of the heart in X and Y directions w.r.t. 3D SPECT space. The displacement in X and Y direction of the centroid of chest markers is obtained from their BM signals in these directions. The displacement is relative to the position of the centroid at time zero, i.e., the start of the study. Also, the displacement computed above is added to the position of the heart at time zero and converted to pixels to get the x and y location in (9). The position of the heart at time zero is obtained from the reconstructed data.
III. Results and Discussion
A. Motion Tracking of Volunteers
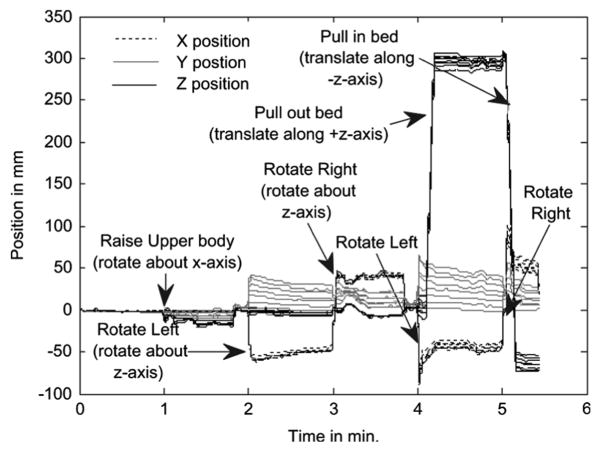
In Fig. 5 the different volunteer and bed movements relative to their starting value are marked at the times when they occurred. It can be seen there from the marker BM traces (X, Y, Z), that the volunteer movements correspond to step-like changes. In particular, at 1 min the subject rotated about X, and then at 2 min, 3 min, 4 min, and 5 min the subject rotated about the Z-axis alternating between positive and negative. Also at 4 min, and 5 min the bed was translated axially (Z direction) about +30 cm and −35 cm.
Fig. 5.
XYZ body motion signals as a function of time relative to positions at time zero for each of 8 chest markers in a volunteer motion study. Also shown are notes as to the type of motion the volunteer underwent.
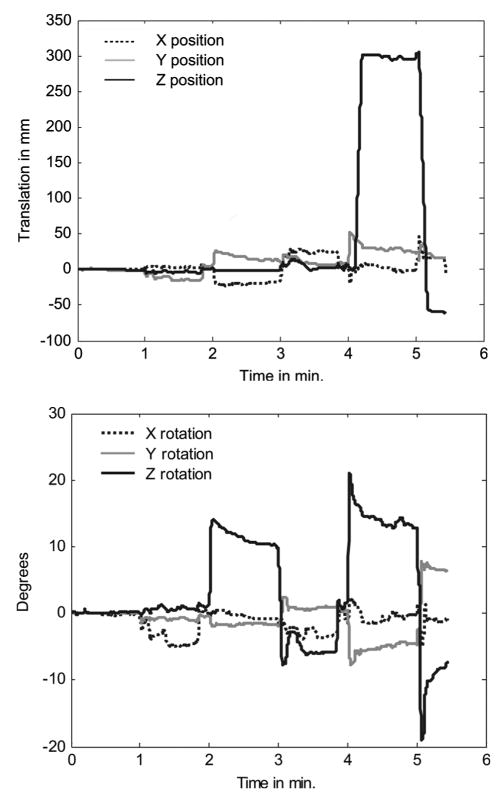
Fig. 6 shows the RBM rotations and translations for the volunteer data of Fig. 5 computed from the markers using the SVD algorithm described before. In Fig. 6(a) the computed translation at 4 and 5 min matches the expected values as noted from the display of the SPECT system. Also, in Fig. 6(b), the computed rotations, i.e., about X-axis at 1 min, and alternating positive and negative rotations about Z-axis at 2, 3, 4 and 5 min can be seen to match the movements in Fig. 5. Note that as the volunteer raised or rotated there were small translations measured as seen in Fig. 6(a) in addition to rotations.
Fig. 6.
(a) The translations in mm along X, Y and Z directions computed by SVD. (b) The rotations about X, Y and Z in degrees computed by SVD.
B. Patient Motion Tracking Studies
The patient data used in this study were chosen based on the evidence of motion in the cine of 2D SPECT projections, or in the marker traces. Two examples from patients undergoing perfusion imaging following exercise stress were selected for illustration purposes. The first one shows a downward drift in the average vertical height of markers on the abdomen during imaging which correlates with a drift superiorly (upward towards patient head) in the axial location of the heart as evidenced from the SPECT projection data. Such a superior drift in the location of the heart during imaging has been known to occur for sometime during cardiac SPECT imaging and is called upward creep [18]. Our data provides evidence that this is associated with a change in the respiratory pattern, at least in some patients. The second patient study shows an example of patient motion which is observed via the Vicon VTS and correlated with a change in location of the heart as estimated from the SPECT projection data. In the comparisons note that the duration of acquisition of the Vicon data is longer than the duration of SPECT emission imaging which lasts for about 15 min. At the end of SPECT imaging the patient underwent sequential transmission imaging so the Vicon VTS motion-tracking was continued after the completion of SPECT imaging to allow tracking during transmission imaging. Also note that SPECT projections were acquired simultaneously from two camera-heads with the first head ending angular sampling just before the second head started. Thus comparison of motion state between the last frame acquired by head 1 and the first frame acquired by head 2 allows for comparison between the start and end of acquisition.
Table I allows comparison of the motion magnitude as computed from the Vicon VTS and SPECT 2D projections. The column Type of Motion describes the kind of motion predominantly observed in the patient in which other small motions may also be present. The columns Chest X, Y and Z refer to the RBM motion of the chest markers along the three directions computed from the BM traces of the chest markers. The column Abd Y refers to the motion along Y-axis computed from the BM trace of the abdominal marker with largest average respiratory amplitude. In the case of upward creep, the total extent of motion between the start and the end of the acquisition is listed. For RBM the maximum motion observed in each direction is listed. The comparison between SPECT and Vicon VTS motion estimates is done only for translational movements as the rotations cannot be estimated from the projections.
TABLE I.
Comparison of the Motion During ~ 15 Minute Period of SPECT Imaging Estimated Externally Using Vicon VTS and Internally From SPECT 2D Projections
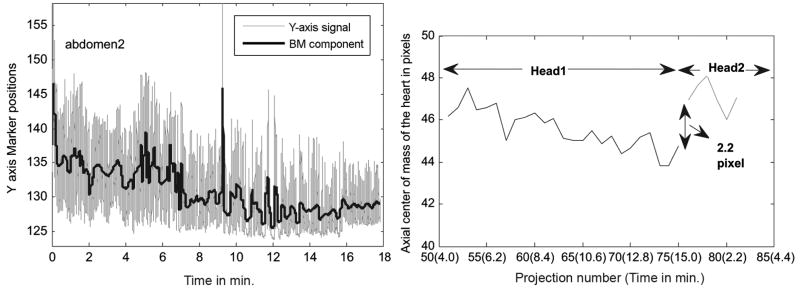
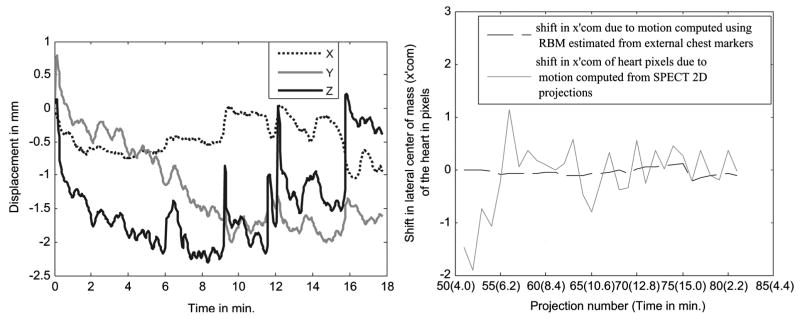
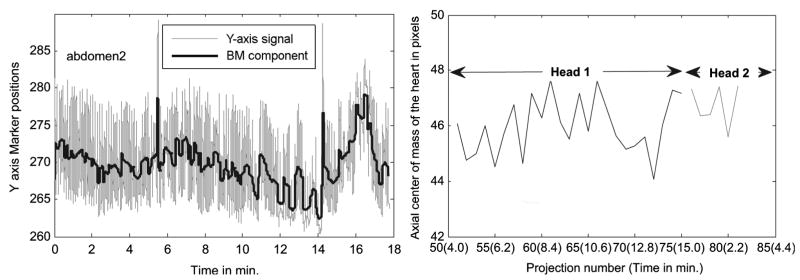
Fig. 7 (Left) shows the trace from an abdominal marker placed on subject 1 along with the extracted BM. The respiration trace shows a downward trend of about 10 mm, and in the same subject the SPECT 2D projections show an upward creep of the heart of about 9 mm. This can be seen at the right in Fig. 7 as a jump of about 2.2 pixels between projection number 76 and 75 which correspond to the projections taken at the start of acquisition for head 2 and the end for head 1, respectively. The X and Y RBMs estimated from the markers for this patient are 2 mm or less as seen in Fig. 8 (Left). Fig. 8 (Right) shows the shift in lateral center-of-mass due to patient motion. This is obtained by subtracting the component due to rotation of the Gamma-camera from the lateral center-of-mass computed from SPECT projections (x′comSPECT) and that computed from the X and Y RBM signals of the markers (x′commarker). In the figure, x′comSPECT curve (gray line) shows reasonable agreement with the x′commarker curve (black dotted line) with differences well within ±1 pixel. The likely cause of the variations of x′comSPECT is problems with segmentation of the 2D projection data at angles where the heart was not clearly visible, or had lower counts. Except for those angles, the shift in x′comSPECT curve from zero is in the subpixel range (i.e., less than 4 mm), which is expected as the external motion measured is less than 2 mm. The noise in the SPECT determined motion illustrates the difficulty of patient motion tracking using just the SPECT emission data.
Fig. 7.
Illustration of upward creep of heart during imaging from subject 1 of Table I. (Left) A downward trend of about 10 mm is seen in the Y-direction of an abdominal marker. The marker continues to track motion in the transmission imaging phase which is after 15 min., so the displacement during emission imaging is the value at the 15 min. mark. (Right) The axial center-of-mass of the segmented heart pixels shows a similar movement of the heart in the axial (Z) direction between the start and end of the study.
Fig. 8.
(Left) The 3-DOF RB translations estimated from the BM component of chest markers in subject 1 in Table I showing small movements (< 2 mm) in X and Z directions, and a small downward trend in Y of ~ 2 mm. (Right) The shift in lateral center-of-mass of the heart from the trajectory followed as the camera rotates is shown. The shift in x′com computed using the segmented heart pixels from the SPECT 2D projections (gray line) agrees approximately with the shift computed using external markers (black dotted line). The variation in the x′com calculated from the SPECT projections illustrates the problem of trying to estimate motion from the SPECT data itself. This is especially true near the start of acquisition for head 1 (left side of plot) and the end of acquisition for head 2 (not shown) when the heart is significantly attenuated by overlying tissues as viewed by the camera head.
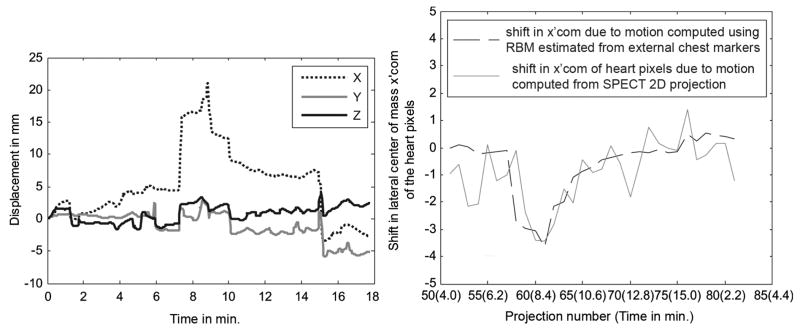
Subject 2 has significant RBM in the transverse plane but little net gradual change in the respiratory pattern during imaging. Fig. 9 shows the respiratory pattern (left) of this subject and the axial motion of the center-of-mass of the heart pixels (right). Notice that this patient does show a decrease in the average Y-axis location between 8 and 14 minutes. However, this trend is reversed such that there is little net change between the start and end of acquisition which matches the observation of only a small change in the axial center-of-mass being detected in the SPECT projection data. Fig. 10 shows the RBM computed from the chest markers (left) and as in Fig. 8 (Right), the shift in lateral center-of-mass due to motion estimated from the RBM on left (black dotted line), and that estimated from SPECT projections (gray line). Notice the relatively good agreement between the motion determined from the SPECT data and that predicted from the tracking of the Vicon markers on the chest. In addition, note that near the end of the curves at the left in Fig. 10 there is significant motion in X, Y, and Z occurring at the end of emission imaging and the start of transmission imaging. This observation points out the potential for patient motion occurring in multimodality imaging and illustrates the possibility that such motion can be detected by marker tracking.
Fig. 9.
(Left) The Y-direction signal of an abdominal marker of subject 2 in Table I showing upward and downward trends. The downward trend is clearly seen from about 8 to 14 minutes, after which the trend shifts upward ending (at 15 min.) at around the same value as at the start of the acquisition. (Right) The axial center-of-mass of the segmented heart pixels in the same subject shows a negligible displacement between the start and end of the study. However, there is a downward trend between 10–14 minutes, which matches the downward trend seen at the left.
Fig. 10.
(Left) The 3-DOF RB translations estimated from the BM component of chest markers in subject 2 in Table I showing movement in X (of ~ 15 mm) with little Y or Z direction motion during SPECT imaging (first ~ 15 minutes). However, note that X, Y, and Z all change significantly at the time of transition from emission to transmission imaging when the camera heads move away from the patient and the transmission source is deployed. (Right) Again, the shift in lateral center-of-mass (x′com) of the heart from the trajectory followed as the camera rotates is shown. The shift in x′com computed using the segmented heart pixels from SPECT 2D projections (gray line) in the same subject agrees with that computed using external markers (black dotted line) as shown. There is a clear displacement of the xcom curve around 7 minutes, which matches the time of the sudden displacement in the X curve in the figure on the left. Also, there is a maximum displacement of about 3.4 pixels in the heart location as computed from the SPECT 2D projections around 8 minute, which is close to the displacement in X direction of about 16 mm.
IV. Conclusions
The respiration signal required for respiratory motion binning of list-mode acquisitions can be extracted from the abdominal markers. For amplitude binning of respiratory motion, the respiration signal should also reflect the trend changes such that upward creep can be corrected. Our motion separation algorithm looks for such trends and leaves it in the respiration signal for correction as part of respiratory motion correction.
The rigid-body motion signal required to correct for 6-DOF motion correction of the heart can be extracted from a non-coplanar configuration of the chest markers. The signal extracted from the chest markers has relatively less interference from respiratory motion as most subjects are abdominal breathers especially in supine position. The rigid-body motion estimated seems to correlate well with the internal heart motion as assessed from SPECT projection data.
Future work in this project will focus on validating the motion estimates obtained externally using Vicon VTS with estimates of heart motion obtained from MRI images for different types of motion. MRI will also be used to study the correspondence between different types of motion commonly observed in the patients to the actual motion of the heart.
Acknowledgments
This work was supported by the National Institute of Biomedical Imaging and Bioengineering (NIBIB) Grant R01 EB001457. The contents are solely the responsibility of the authors and do not necessarily represent the official views of NIBIB.
Footnotes
Color versions of one or more of the figures in this paper are available online at http://ieeexplore.ieee.org.
References
- 1.Botvinick EH, Zhu YY, O’Connell WJ, Dae MW. A quantitative assessment of patient motion and its effect on myocardial perfusion SPECT images. J Nucl Med. 1993;34:303–310. [PubMed] [Google Scholar]
- 2.Prigent FM, Hyun M, Berman DS, Rozanski A. Effect of motion on Thallium-201 SPECT studies: A simulation and clinical study. J Nucl Med. 1993;34:1845–1850. [PubMed] [Google Scholar]
- 3.Vedam SS, Kini VR, Keall PJ, Ramakrishnan V, Mostafavi H, Mohan R. Quantifying the predictability of diaphragm motion during respiration with a non-invasive external marker. Med Phys. 2003;30(4):505–513. doi: 10.1118/1.1558675. [DOI] [PubMed] [Google Scholar]
- 4.Nehrke K, Börnert P, Manke D, Böck JC. Free-breathing cardiac MR imaging: Study of implications of respiratory motion-initial results. Radiology. 2001;220:810–815. doi: 10.1148/radiol.2203010132. [DOI] [PubMed] [Google Scholar]
- 5.Boucher L, Rodrigue S, Lecomte R, Benard F. Respiratory gating for 3-dimensional PET of the thorax: Feasibility and initial results. J Nucl Med. 2004;45:214–219. [PubMed] [Google Scholar]
- 6.Nehmeh SA, et al. Effect of respiratory gating on reducing lung motion artifacts in PET imaging of lung cancer. Med Phys. 2002;29:366–371. doi: 10.1118/1.1448824. [DOI] [PubMed] [Google Scholar]
- 7.Klein GJ, Reutter BW, Huesman RH. Four-dimensional affine registration models for respiratory-gated PET. IEEE Trans Nucl Sci. 2001 Jun;48(3):756–760. [Google Scholar]
- 8.Livieratos L, Stegger L, Bloomfield PM, Schafers K, Bailey DL, Camici PG. Rigid-body transformation of list-mode projection data for respiratory motion correction in cardiac PET. Phys Med Biol. 2005;50:3313–3322. doi: 10.1088/0031-9155/50/14/008. [DOI] [PubMed] [Google Scholar]
- 9.Kovalski G, Israel O, Keidar Z, Frenkel A, Sachs J, Azhari H. Correction of heart motion due to respiration in clinical myocardial perfusion SPECT scans using respiration gating. J Nucl Med. 2007;48:630–636. doi: 10.2967/jnumed.106.037390. [DOI] [PubMed] [Google Scholar]
- 10.Fulton RR, Eberl S, Meikle SR, Mutton BF, Braun M. A practical 3D tomographic method for correcting patient head motion in clinical SPECT. IEEE Trans Nucl Sci. 1999 Jun;46(3):667–672. [Google Scholar]
- 11.Buhler P, Just U, Will E, Kotzerke J, van den Hoff J. An accurate method for correction of head movement in PET. IEEE Trans Med Imag. 2004;23:1176–1185. doi: 10.1109/TMI.2004.831214. [DOI] [PubMed] [Google Scholar]
- 12.Beach RD, Pretorius PH, Boening G, Bruyant PP, Feng B, Fulton RR, Gennert MA, Nadella S, King MA. Feasibility of stereo-infrared tracking to monitor patient motion during cardiac SPECT imaging. IEEE Trans Nucl Sci. 2004 Oct;51(5):2693–2698. doi: 10.1109/TNS.2004.835786. [DOI] [PMC free article] [PubMed] [Google Scholar]
- 13.Feng B, Gifford HC, Beach RD, Boening G, Gennert MA, King MA. Use of three-dimensional gaussian interpolation in the projector/backprojector pair of iterative reconstruction for compensation of known rigid-body motion of SPECT. IEEE Trans Med Imag. 2006;25:838–844. doi: 10.1109/tmi.2006.871397. [DOI] [PMC free article] [PubMed] [Google Scholar]
- 14.Beach RD, Depold H, Boening G, Bruyant PP, Feng B, Gifford H, Gennert MA, Nadella S, King MA. An adaptive approach to decomposing patient-motion tracking data acquired during cardiac SPECT imaging. IEEE Trans Nucl Sci. 2007 Feb;54(1):130–139. doi: 10.1109/TNS.2006.887471. [DOI] [PMC free article] [PubMed] [Google Scholar]
- 15.McNamara JE, Feng B, Johnson KL, Gu S, Gennert MA, King MA. Motion capture of chest and abdominal markers using a flexible multi-camera motion-tracking system for correcting motion-induced artifacts in cardiac SPECT; Proc Nuclear Science Symp Medical Imaging Conf Rec; 2007. pp. 4289–4293. [Google Scholar]
- 16.Rudin LI, Osher S, Fatemi E. Non-linear total variation based noise removal algorithms. Physica D. 1992;60:259–268. [Google Scholar]
- 17.Haykin S. Neural Network: A Comprehensive Foundation. 2. Upper Saddle River, NJ: Prentice Hall; 1998. p. 169. [Google Scholar]
- 18.Friedman J, et al. Upward creep of the heart: A frequent source of false-positive reversible defects during thallium-201 stress-redistribution SPECT. J Nucl Med. 1989 Oct;30(10):1718–1722. [PubMed] [Google Scholar]
- 19.Beach RD, Feng B, Shazeeb MS, King MA. Determining patient 6-degrees of freedom motion from stereo infrared cameras during supine medical imaging. Proc SPIE. 2006;6143:614337. [Google Scholar]
- 20.Sethian JA. Level Set Methods and Fast Marching Methods. Cambridge, U.K: Cambridge Univ. Press; 1996. [Google Scholar]


