

Abstract
Sterol-regulatory element binding protein-1c (SREBP-1c) is a transcription factor that controls lipogenesis in the liver. Hepatic SREBP-1c is nutritionally regulated, and its sustained activation causes hepatic steatosis and insulin resistance. Although regulation of SREBP-1c is known to occur at the transcriptional level, the precise mechanism by which insulin signaling activates SREBP-1c promoter remains to be elucidated. Here we show that protein kinase C beta (PKCbeta) is a key mediator of insulin-mediated activation of hepatic SREBP-1c and its target lipogenic genes. Activation of SREBP-1c in the liver of refed mice was suppressed by either adenoviral RNAi-mediated knockdown or dietary administration of a specific inhibitor of protein kinase C beta. The effect of PKCbeta inhibition was cancelled in insulin depletion by streptozotocin (STZ) treatment of mice. Promoter analysis indicated that PKCbeta activates SREBP-1c promoter through replacement of Sp3 by Sp1 for binding to the GC box in the sterol regulatory element (SRE) complex, a key cis-element of SREBP-1c promoter. Knockdown of Sp proteins demonstrated that Sp3 and Sp1 play reciprocally negative and positive roles in nutritional regulation of SREBP-1c, respectively. This new understanding of PKCbeta involvement in nutritional regulation of SREBP-1c activation provides a new aspect of PKCbeta inhibition as a potential therapeutic target for diabetic complications.
Keywords: SREBP, lipogenesis, fatty acid, triglyceride, glucose
Mammals have evolved a system for lipid synthesis to maintain nutritional homeostasis. Sterol regulatory element-binding protein (SREBP) is a transcription factor belonging to bHLH family (1) that controls genes involved in lipid synthesis. SREBP consists of three isoforms (SREBP-1a, SREBP-1c, and SREBP-2). SREBPs bind to specific elements (SRE) in the promoter of their target genes. The physiological role of each of the isoforms has been studied in transgenic mice overexpressing their nuclear forms (2–4). In liver, SREBP-1c is predominantly expressed and is the master regulator of fatty acid and triglyceride synthesis due to its enhancement of the transcription of fatty acid synthase (FAS), acetyl-CoA carboxylase (ACC), and stearoyl-CoA desaturase (SCD-1), which results in the conversion of excessive carbohydrates to lipid (5–8).
The processing and regulation of SREBP genes have been extensively studied. SREBPs are initially translated as endoplasmic reticulum (ER)-membrane-bound proteins that remain in the ER until they are released by SREBP cleavage-activating protein (SCAP)-mediated proteolytic cleavage, allowing the active form to enter the nucleus and activate transcription. The cleavage of SREBP-2 is strictly regulated by cellular cholesterol concentrations and is a key process for sterol regulation (9, 10). In contrast, transcriptional regulation of SREBP-1c depends upon nutritional status and controls lipogenic genes in the liver. In physiological conditions, SREBP-1c transcription is repressed in the fasted state and is drastically activated in the fed state, leading to storage of carbohydrates (11). Factors related to nutrition, such as insulin (12), insulin signal- related kinase (13, 14), glucose (15, 16), protein kinase A (PKA) (17), polyunsaturated fatty acid (PUFA) (18, 19), and nuclear receptor Liver X receptor (LXR) (20) have been reported to regulate SREBP-1c expression. However, the precise molecular mechanism of SREBP-1c transcription is not fully understood.
Accumulating evidence suggests that protein kinase C (PKC) is involved in signals of insulin, glucose, and nutrients relating to a variety of signals systems, such as diacyl-glycerol (DAG) and phosphatidylserine (PS). Thus we postulated that PKC may regulate SREBP-1c cleavage and activation. PKC is a serine/threonine kinase and is categorized into three subfamilies (classical, novel, and atypical) based on distinct N-terminal regulatory domains. As a nutrient sensor, it has been reported that several PKCs are activated by insulin and glucose. The atypical PKC isoforms (zeta/lambda) have been also implicated to participate in insulin signaling, and PKC lambda liver-specific knockout attenuates expression of SREBP-1c in mRNA level (14). Recent reports suggest that other isoforms also modulate insulin signal-related proteins through phosphorylation or direct interaction (21). PKCbeta belongs to the classical PKC subfamily and is activated by both glucose and insulin. Chronic exposure to hyperglycemia is believed to activate PKCbeta in a variety of vascular tissues, leading to the diabetic microangiopathy (22).
In the current study, we examine whether classical and/or novel PKCs are involved in nutritional induction of SREBP-1c. Using in vivo and in vitro techniques, we demonstrate that PKCbeta is a regulator for induction of SREBP-1c in a fed state.
EXPERIMENTAL PROCEDURES
Animals
Male C57BL/6J mice and male SD rat were purchased from CLEA (Tokyo, Japan) and maintained on a 14-h light/10-h dark cycle. Mice were sacrificed between 9:00 and 12:00. Before being killed, mice were weighed and blood samples were taken. Streptozotocin (STZ) mice were produced as follows: C57BL/6J mice (7-weeks old) were administered streptozotocin (100 mg/kg) via intraperitoneal injection two times every other day. One week following the last injection, blood glucose level was checked and mice with high glucose (350 mg/dl or above) were used in the experiments. Animals were treated according the guidelines for ethical use of animals established at the University of Tsukuba.
Materials
Control chow diet containing a PKCbeta selective inhibitor (LY333531, 10 mg/kg) was provided by Elli Lilly and Co. (Indianapolis, IN). Anti-HA (12CA5) antibody and anti-c- myc antibody were purchased from Roche. Anti-SREBP-1 (H-160) antibody (sc-8984), anti-LXRalpha (H-144) antibody (sc-13068), anti-RXR (D-20) antibody (sc-553), anti-PKCbeta1 (C-16) antibody (sc-209), anti-PKCbeta2 (C-18) antibody (sc-210), anti-PKCepsilon (C-15) antibody (sc-214), anti-Sp1 (1C6) antibody (sc-420), anti-Sp2 (K-20) antibody (sc-643), anti-Sp3 (D-20) antibody (sc-644), anti-USF-1 (C-20) antibody (sc-229), anti-USF-2 (C-20) antibody (sc-862), and anti-CBF-C (N-19) (NF-Y) antibody (sc-7715) were purchased from Santa Cruz Biotechnology (Santa Cruz, CA). Anti-α-Tubulin antibody, PMA (phorbol-12-myristate-13-acetate), bisindolylmaleimide I (GF 109203X), U0126, and U0124 were purchased from Calbiochem. Streptozotocin, mithramycin A, and insulin were purchased from Sigma. LY333531 was purchased from A. G. Scientific (San Diego, CA), and oligo DNA primers were purchased from Operon Biotechnologies.
Culture of cell-line cells
HepG2 cells, HEK293T cells, and human mesangial-derived MES cells were purchased from ATCC. Culture medium (MEM, DMEM, and F-12) were purchased from Sigma. HepG2 cells were maintained in MEM medium (10% FBS, 1% penicillin-streptomycin solution stabilized, 1 mM sodium pyruvate), HEK293T cells in DMEM medium (5% FBS and 1% penicillin-streptomycin solution stabilized), and MES13 cells in DMEM:F-12 = 3:1 medium (5% fetal bovine serum, 1% penicillin-streptomycin solution stabilized, 14 mM HEPES) in monolayer culture at 37°C in a 5% CO2 incubator.
Isolation and culture of rat primary hepatocytes
Hepatocytes were isolated from rat liver by collagenase methods as previously described (23). Cell viability was assessed by the Trypan Blue exclusion test and was always higher than 80%.
PKC assay
The measurement of liver PKC activity was measured by using SignaTECT Protein Kinase C (PKC) Assay System (Promega) according to manufacturer's instruction. Briefly, whole liver samples were homogenized and passed over DEAE column [HiTrap DEAE FF (GE Healthcare)] by using HPLC [ÄKTAexplorer 10S (GE Healthcare)]. The collected fractions were assayed for PKC activity using [γ-32P] ATP, and the radioactivity was determined by using a liquid scintillation counter.
Northern blot analysis
Northern blot analysis was performed as previously described (24). mRNA was isolated by using PolyATract (R) mRNA Isolation System (Promega). All cDNA probes were radiolabeled with [α-32P] dCTP using RediprimeII Random Prime Labeling System. cDNA probe for 36B4 was used as a loading control.
Real-time PCR
Total RNA was prepared from mouse liver using TRIzol Reagent. First-strand cDNA was synthesized from total RNA (2 μg) with mixture of random hexamer and oligo dT using ThermoScript RT-PCR System (Invitrogen). Real-time PCR using the SYBR green reagents was performed with the ABI PRISM 7000 Sequence Detector (Applied Biosystems). The relative amount of all mRNA was calculated, and 36B4 mRNA was used as the loading control. Primer sequences of genes used are as follows: SREBP-1a: (5′-aggcggctctggaacaga-3′) (5′-tcaaaaccgctgtgtccagtt-3′); SREBP-1c: (5′-cggcgcggaagctgt-3′) (5′-tgcaatccatggctccgt-3′); and 36B4: (5′-cctgaagtgctcgacatcaca-3′) (5′-gcgcttgtacccattgatga-3′).
Plasmid construction and generation of recombinant adenoviruses
SREBP-1c-Luc vectors (pBP-1c-2600, pBP-1c-550, and pBP-1c-90) were previously described (20). SREBP-1c (TATA)-Luc (pBP-1c-TATA-Luc) and SREBP-1c (-550(ΔSRE complex))-Luc (pBP-1c-550(ΔSRE complex)-Luc) were constructed by cloning these sequences to pGL2basic (Promega). Expression vector for SREBP-1a was previously described (24). Expression vector for HA-tagged Sp3 was generated by PCR amplification and cloned into pcDNA3 (Invitrogen). Expression vectors for PKCbetaCA (pCO2) and PKCepsilonCA (pMT2) were kindly provided by Dr Peter Parker.
Recombinant adenoviruses were produced by ViraPower Adenoviral Expression System (Invitrogen) according to manufacturer's protocol. PKCbeta wild-type sequence was cloned into pENTR (Invitrogen) carrying CAG promoter. Adenoviruses targeting lacZ, PKCbeta, PKCepsilon, Sp1 and Sp3 were generated by using BLOCK-iT U6 RNAi Entry Vector Kit (Invitrogen). Briefly, targeting sequences for knockdown of lacZ, PKCbeta (NM_008855), PKCepsilon (NM_011104), Sp1 (NM_013672), and Sp3 (NM_001018042) were synthesized and ligated into pENTR/U6 (Invitrogen). By homologous recombination procedure, these fragments were integrated in pAd/PL-DEST (Invitrogen) followed by transfection into 293A cells for adenovirus production.
Transient transfection and luciferase assay
Transfection and luciferase assay were performed as previously described (24) using OPTI-MEM I (GIBCO) and FuGENE 6 Transfection Reagent (Roche). As control of transfection efficiency, Renilla luciferase (pRL-SV40, Promega) was used as described in the figure legend. Total DNA for transfection was adjusted to 0.5 μg/well by using empty vector. All experiments were performed in triplicate. Similar experiments were repeated at least two times.
Chromatin immunoprecipitation (ChIP) assay
Preparation of nuclear fraction from mouse liver as previously described (7). Each group of nuclear fraction was pooled and washed by ice-cold PBS. After adding of formaldehyde to samples, cross-linking was performed by incubation at 37°C for 10 min and stopped by glycine. After washing of hepatic nuclear samples by PBS, pellets were dissolved in SDS lysis buffer [50 mM Tris-HCl (pH 8.0), 10 mM EDTA (pH8.0), 1% SDS and protease inhibitor cocktail (Roche)]. DNA fragmentation was performed by sonication (Sonifer 250) for 30 s (power 1, duty cycle 20%) five times. After centrifugation for 10 min at room temperature 15000 rpm, supernatant was diluted by 9 vol of dilution buffer [50 mM Tris-HCl (pH 8.0), 167 mM NaCl, 1.1% Triton X-100, 0.11% sodium deoxycholate and protease inhibitor cocktail (Roche)]. To remove unspecific binding, protein G beads were added and rotated for 30 min at 4°C. Supernatant was mixed with antibodies overnight and 50% protein G beads [Protein G Sepharose 4 Fast Flow (GE Healthcare)] were added and rotated for 3 h at 4°C. After washing by low salt wash buffer [50 mM Tris-HCl (pH 8.0), 150 mM NaCl, 1 mM EDTA (pH8.0), 1% Triton X-100, 0.1% SDS, 0.1% sodium deoxycholate], high-salt wash buffer [50 mM Tris-HCl (pH 8.0), 500 mM NaCl, 1 mM EDTA (pH8.0), 1% Triton X-100, 0.1% SDS, 0.1% sodium deoxycholate], LiCl wash buffer [10 mM Tris-HCl (pH8.0), 0.25 M LiCl, 1 mM EDTA (pH 8.0), 0.5% NP40 and 0.5% sodium deoxycholate], and TE buffer. DNA-protein complex was eluted by incubation with elution buffer (1% SDS, 0.1 M NaHCO3) for 30 min at room temperature. After incubation overnight at 65°C, DNA samples was purified as previously described (23) and subjected to PCR experiment. Antibodies for the ChIP assay were anti-Sp1 antibody (07-645), anti-Sp3 antibody (sc-644X) and normal rabbit IgG (sc-2027). PCR conditions were as follows: denature one cycle (95°C for 3 min); amplification 30 cycles (94°C 1 min, 55.5°C 30 s, 72°C 30 s). PCR primer sequences were as follows: sense (gaaccagcggtgggaacacagagc); antisense (aggctttaaagcccgccgat).
Other assays
Preparation of nuclear protein from mouse liver and cultured cells was as previously described (7). EMSA and Western blot analysis were performed as previously described (24). Sequences for EMSA probe are as follows (antisense strand omitted). SREBP-1c SRE complex (-92 to -35): (5′-gcggctgctgattggccatgtgcgctcacccgaggggcggggcacggaggcgatcgg-3′); SREBP-1c SRE complex mut: (5′-gcggctgctgattggccatgtgcgctcacccgaggtttaaagcacggaggcgatcgg-3′); -90bp region (-46 to +8): (5′-ggcggggcacggaggcgatcggcgggctttaaagcctcgcggggcctgacaggtgaaatcggcgc-3′); 90bp region (-6 to +43): (5′-ggtgaaatcggcgcggaagctgtcggggtagcgtctgcacgccctagg-3′); NFkappaB consensus site: (5′-gagttgaggggactttcccagg-3′).
Plasma glucose, triglycerides, nonesterified fatty acid, and cholesterol were determined with a kit purchased from WAKO. Plasma insulin levels were determined with insulin kit (mouse-T) purchased from Shibayagi.
Statistics
All animal experiments were performed at least two times. Luciferase assay, PKC activity, plasma parameters, body weight, tissue weight, and mRNA expression levels are presented as means ± SD. The significance was tested by Dunnett test or Student's t-test.
RESULTS
Activation of PKCs induced SREBP-1c promoter activity
A mouse SREBP-1c promoter construct spanning a 2.6 kb 5′ flanking region containing LXR and SREBP binding sites (schematized in Fig. 1A) was used in reporter assays in the hepatic cell line HepG2. PMA, a general activator of all PKC isoforms, dose-dependently and saturably elevated SREBP-1c promoter activity, suggesting that PKC activates the SREBP-1c promoter (Fig. 1B). Deletion studies indicated that the region of the SREBP-1c promoter responsible for PMA activation was located within the proximal 90 bp region, which contains the SRE complex (Fig. 1C, D). Deletion constructs was confirmed by LXR synthetic ligand T0901317 (indicated as T1317 in Fig. 1D). T1317 robustly activates the SREBP-1c promoter in pBP-1c550 and pBP-1c550 (ΔSRE complex) constructs containing LXRE but not in pBP-1c90 and pBP-1cTATA-Luc constructs. Activation of this minimal promoter by PMA was dose-dependently inhibited by GF 109203X (GFX), an inhibitor of PKC, confirming that PMA activation of the SREBP-1c promoter was mediated by PKC (Fig. 2A). It is well established that mitogen-activated protein kinases are downstream of PKC (25–27). PMA activation of the 90 bp-Luc promoter was also abolished by U0126, an inhibitor of MEK, but not by U0124, its inactive analog, indicating that MEK activation mediates the process in PMA activation of the SREBP-1c promoter.
Fig. 1.

Activation of SREBP-1c promoter by PMA via −90bp region in the promoter. A: Schematic illustration of mouse SREBP-1c promoter. LXRE complex including two LXRE (LXR responsive element) exists between −250 and −150bp. SRE complex, including NF-Y, E-box, SRE, and GC-box, exists downstream of −90bp. B: Effect of PMA on SREBP-1c promoter activity. HepG2 cells were cotransfected with pBP-1c2600-Luc (containing −2.6kbp region of SREBP-1c promoter). After transfection, PMA (0, 3, 10, 100, 300 nM) or vehicle was added for 20 h. RLU (firefly luciferase activity:renilla luciferase activity ratio) is shown. *P < 0.01 versus vehicle. C: Effect of PMA on several deletion constructs of SREBP-1c Luc. HepG2 cells were cotransfected with pBP-1c2600-Luc, pBP-1c550-Luc, pBP-1c90-Luc, or pGL2basic. After transfection, PMA (100 nM) or vehicle was added for 20 h. Fold activation by PMA is shown with values from vehicle-treated cells set at 1. Relative promoter activity of each construct without PMA is 12.7-fold in pBP-1c2600-Luc, 14.4-fold in pBP-1c550-Luc, and 4.6-fold in pBP-1c90-Luc compared with prompter activity in empty vector. *P < 0.005 versus each promoter construct with no treatment. D: Effect of PMA on −90bp region deleted promoter construct. HepG2 cells were cotransfected with pBP-1c550, pBP-1c90, pBP-1c550 (ΔSRE complex), or pBP-1cTATA-Luc followed by adding PMA (100 nM), T0901317 indicated as T1317 (1 μM), or vehicle for 20 h. RLU (firefly luciferase activity:renilla luciferase activity ratio) is shown. *P < 0.01 versus each promoter construct with no treatment. LUC, luciferase; LXR, liver X receptor; PMA, phorbol-12-myristate-13-acetate; Sp, specificity protein; SRE, sterol regulatory element; SREBP, sterol regulatory element-binding protein; TATA, TATA-like sequence.
Fig. 2.

Activation of SREBP-1c promoter by PKCbeta and PKCepsilon. A: Effect of PKC inhibitor on SREBP-1c promoter activity. HepG2 cells were cotransfected with pBP-1c2600-Luc. After transfection, PMA, GFX, U0126, U0124, or vehicle were added for 20 h as indicated in figure. RLU (firefly luciferase activity:renilla luciferase activity ratio) is shown. *P < 0.01 versus PMA treatment. B: Effect of PKCbeta inhibition by LY333531 on SREBP-1c promoter. HepG2 cells were cotransfected with pBP-1c2600-Luc. After transfection, PMA (0.1 μM) and LY333531 (0, 10, 30, 100, 300, 1000 nM) were added for 20 h. RLU (firefly activity:renilla luciferase activity ratio) is shown. *P < 0.01 versus PMA treatment. C: Effect of PKCbeta and PKCepsilon on SREBP-1c promoter. HepG2 cells were cotransfected with pBP-1c2600-Luc and PKCbetaCA (constitutive active form) vector, PKCepsilonCA, or empty vector. RLU (firefly luciferase activity:renilla luciferase activity ratio) is shown. *P < 0.01 versus empty vector. LXR, liver X receptor; GFX, GF 109203X; LXRE, LXR response element; PKC, protein kinase C; PMA, phorbol-12-myristate-13-acetate; Sp, specificity protein; SRE, sterol regulatory element; SREBP, sterol regulatory element-binding protein.
PKCbeta and PKCepsilon dose-dependently activate the SREBP-1c promoter
Because of the potential involvement of several different PKC isoforms, we tested the effect of LY333531, a specific inhibitor of PKCbeta. This PKCbeta inhibitor dose-dependently abolished PMA-induced activation of the SREBP-1c promoter, although its effect on the basal activity was minimal (Fig. 2B). Conversely, expression of PKCbeta, as well as PKCepsilon, dose-dependently activated the SREBP-1c promoter (Fig. 2C).
PKC activation of the SREBP-1c promoter requires SRE and Sp proteins
Gel-shift assay focusing on the responsible 90 bp region demonstrated that nuclear extract from HepG2 cells treated with PMA exhibited a robust and consistent binding to the SRE complex probe (−92bp and −35bp) (Fig. 3A), whereas no signal was obtained from other probes to other sections of the SREBP-1c promoter (data not shown). These data suggest that the SRE complex could be the site for PMA activation. The signal was slightly diminished by addition of antibodies against transcription factors that bind to the SRE complex, such as SREBP-1, upstream transcription factors, Sp proteins, and nuclear transcription factor-Y (28). Antibody to Sp3 strongly attenuated the signal (Fig. 3A). Furthermore, dose-dependent and specific binding of Sp3 to this probe was demonstrated using in vitro translated protein, whereas Sp3 did not bind to the mutant probe with the changed sequence of GC box (Fig. 3B, C). Thus, this result indicated that GC box (-59 to -50) of SRE complex is the one and only binding site of Sp family in -90bp region of SREPB-1c promoter. PKC activation and inactivation by PMA and GFX, respectively, did not cause changes in the binding of Sp3 to the SRE complex, unlike their effects on nuclear factor kappa B (NFkappaB), which is known to be regulated by PKC and change binding to its cis-element (Fig. 3D, E). In a similar manner to PKC inhibitors, the Sp protein inhibitor mithramycin also abolished activation of the SREBP-1c promoter by PMA, supporting the concept that Sp protein is involved in the action of PKC (Fig. 4A). However, in luciferase- reporter assays, cotransfection of Sp1 significantly activated SREBP-1c promoter activity compared with Sp3. Sp1 and PKCbetaCA synergistically activated SREBP-1c promoter activity, whereas Sp3 attenuated this effect (Fig. 4B). Inhibitory effect of Sp3 on the SREBP-1c promoter was also observed in activation by PKCepsilonCA (Fig. 4C). These results were consistent with the recent report that Sp1 and Sp3 transcription factors differentially regulate the rat SREBP-1c promoter (29).
Fig. 3.

Identification of Sp3 as a factor binding to −90bp region on SREBP-1c promoter. Nuclear proteins were prepared from HepG2 cells and subjected to EMSA. A probe containing SRE complex (see Fig. 1A) was labeled and incubated with nuclear extract (A–E). A: Identification of binding factor interacting with SREBP-1c promoter. To identify unknown binding protein, antibodies for supershift assay were added. B: Sp3 binding to −90bp region in SREBP-1c promoter. SRE complex and its mutational probe were labeled and incubated with HA-tagged Sp3 (HA-Sp3) produced with in vitro translation kit. C: Identification of Sp3 binding site in −90bp region of SREBP-1c promoter. SRE complex and two different probes corresponding to −90bp region were labeled and incubated with HA-tagged Sp3 (HA-Sp3) produced with in vitro translation kit. D: Confirmation of PMA effect on PKC. PKC activation in the nuclear extracts was confirmed by measuring NFkB binding activity. Probe containing an NFkB consensus sequence was labeled and incubated with the same set of HepG2 nuclear extracts. E: No effect of PMA on Sp3 binding. HepG2 cells were pretreated with PMA and GFX as indicated. EMSA, electrophoretic mobility shift assay; GFX, GF 109203X; PKC, protein kinase C; PMA, phorbol-12-myristate-13-acetate; Sp, specificity protein; SRE, sterol regulatory element; SREBP, sterol regulatory element-binding protein.
Fig. 4.

Sp family inhibition or knockdown abolishing activation of SREBP-1c promoter by PMA. A: Effect of Sp family inhibitor on SREBP-1c promoter activity. HepG2 cells were cotransfected with pBP-1c-90-Luc. Four h after adding GFX, LY333531, mithramycin, or vehicle, PMA were treated for 16 h as indicated in the figure. RLU (firefly luciferase activity:renilla luciferase activity ratio) is shown. *P < 0.05 and §P < 0.01 versus PMA treatment. B: Effect of Sp1 and Sp3 on SREBP-1c promoter activity induced by PKCbeta. HepG2 cells were cotransfected with pBP-1c-90-Luc (100 ng/well), expression vector for PKCepsilon CA (200 ng/well), Sp1 (100 ng/well), and HA-Sp3 (100 ng/well). RLU (firefly luciferase activity:renilla luciferase activity ratio) is shown. §P < 0.001 versus empty vector or Sp1+PKCbCA as indicated in figure. C: Effect of Sp3 on SREBP-1c promoter activity. HepG2 cells were cotransfected with pBP-1c-90-Luc, expression vector for PKCepsilon CA, and HA-Sp3 as indicated. RLU (firefly luciferase activity:renilla luciferase activity ratio) is shown. *P < 0.01 versus PKCepsilon CA. GFX, GF 109203X; PKC, protein kinase C; PMA, phorbol-12-myristate-13-acetate; Sp, specificity protein; SREBP, sterol regulatory element-binding protein.
These data demonstrated that binding of Sp proteins to the SRE complex are involved in PKC activation of the SREBP-1c promoter with distinctive effects between Sp1 and Sp3 in HepG2 cells.
SREBP-1c is activated by PKC in vivo and in vitro
PKC activation of SREBP-1c was also tested in vivo. PMA administration to C57BL/6J mice dose-dependently increased hepatic expression of SREBP-1c, but not SREBP-1a, as determined by Northern blot analysis and real-time RT-PCR (Fig. 5A, B). PMA treatment caused a dose-dependent decrease in plasma insulin levels, indicating that plasma insulin levels per se did not account for PMA activation of SREBP-1c (Table 1). PKC activation in the liver was validated by upregulation of LDL-R (30) and suppressor of cytokine signaling 3 (SOCS3) (31, 32) (Fig. 5A). Dose-dependent activation of SREBP-1c expression was also observed in rat primary hepatocytes at lower concentration of PMA in the medium than required for SOCS3 activation, indicating that SOCS3/signal transducer and activator of transcription 3 (STAT3)/SREBP-1c pathway previously reported (33, 34) is unlikely to be the primary cause of PMA activation of SREBP-1c (Fig. 6A).
Fig. 5.

Induction of SREBP-1c expression by PKC activation in vivo. Overnight-fasted C57BL/6J mice were administrated PMA (0, 1.2, 4 μg/mouse), followed by euthanasia 2 h later. A: SREBP-1 mRNA amounts measured by Northern blot analysis. Extracted liver RNA were pooled (N = 3) and RNA aliquots (10 μg/lane) were subjected to Northern blot analysis measured with indicated cDNA probes. A cDNA probe for 36B4 was used as a loading control. B: mRNA amounts of SREBP-1a and SREBP-1c assessed by real-time RT-PCR. cDNAs were synthesized from mRNA and measured by ABI7000. Loading amount is normalized by copy number of 36B4. Relative expression level (SREBP-1a or SREBP-1c/36B4) is shown as mean ± SD. *P < 0.05 versus vehicle-treated mice. NB, Northern blot; PKC, protein kinase C; PMA, phorbol-12-myristate-13-acetate; SOCS3, suppressor of cytokine signaling 3; Sp, specificity protein; SREBP, sterol regulatory element-binding protein.
TABLE 1.
Plasma glucose and insulin levels of PMA-administrated mice
| PMA (µg/mouse) | |||
|---|---|---|---|
| 0 | 1.2 | 4 | |
| Glucose (mg/dl) | 119 ± 9 | 158 ± 3 | 143 ± 44 |
| Insulin (ng/ml) | 0.52 ± 0.43 | 0.19 ± 0.24 | 0.08 ± 0.03 |
All mice were euthanized in overnight-fasted state followed by PMA administration. Values are means ± SD (n = 3). Abbreviations: PMA, phorbol-12-myristate-13-acetate.
Fig. 6.

PKC activation and inhibition altering SREBP-1c expression in rat primary hepatocytes. A: Effect of PKC activation by PMA on SREBP-1c expression in hepatocytes. Rat primary hepatocytes were treated with PMA (0, 0.01, 0.03, 0.1 μM) for 6 h. Total RNA was extracted, and RNA aliquots (10 μg/lane) were subjected to Northern blot analysis using labeled cDNA probes as indicated in figure. B: Effect of PKC selective inhibitor on SREBP-1c expression induced by insulin in rat primary hepatocytes. After overnight serum starvation, rat primary hepatocytes were treated with LY333531 (150 nM) and/or insulin (100 nM) for 24 h under a high glucose (540 mg/dl) medium. Extracted RNA aliquots (10 μg/lane) were subjected to Northern blot analysis using labeled cDNA probes as indicated in figure. NB, Northern blot; PKC, protein kinase C; PMA, phorbol-12-myristate-13-acetate; SOCS3, suppressor of cytokine signaling 3; SREBP, sterol regulatory element-binding protein.
Physiological relevance of PKCbeta-mediated activation of SREBP-1c
Next, the physiological relevance of PKCbeta-mediated activation of SREBP-1c to the nutritional regulation of hepatic SREBP-1c was estimated. Insulin is a strong activator of SREBP-1c expression and its targets, such as FAS in rat primary hepatocytes (Fig. 6B). This insulin activation of SREBP-1c was completely attenuated by LY333531 adding to the medium (Fig. 6B). In vivo, hepatic SREBP-1c expression is markedly elevated by refeeding mice after fasting. Dietary supplementation with LY333531 essentially abolished this induction with a concomitant repression of FAS, consistent with our observation in rat primary hepatocytes (Fig. 7). We previously reported the effect of STZ treatment on hepatic SREBP-1c expression to show that even in insulin depletion, hyperglycemia can fully activate hepatic SREBP-1c expression in the mice (16). To dissociate the roles of plasma insulin and glucose in refeeding induction of hepatic SREBP-1c, mice were treated with STZ before administration of the PKC inhibitor. STZ treatment completely abolished the inhibitory effect of LY333531 on hepatic SREBP-1c. These data demonstrated that PKCbeta controls insulin-mediated activation of hepatic SREBP-1c independent of changes in plasma glucose levels. Lack of insulin by STZ treatment decreased total PKC activity by 30%, which was abolished by LY333531 treatment. Inhibition of PKCbeta by LY333531 was associated with an ∼70% inhibition of total PKC activity in the liver in a fed state (Table 2). STZ treatment decreased total PKC activity by ∼30% but caused no decrease in the LY333531-treated group. On the assumption of PKCbeta-specific inhibition by LY333531, these data indicated that insulin-mediated PKC activity in a refed state is primarily mediated by PKCbeta. PKCbeta inhibition did not affect food intake or body weight, irrespective of STZ treatment (Table 2). Plasma insulin and free fatty acid levels were decreased, and phosphoenolpyruvate carboxykinase (PEPCK) expression was increased (Table 2 and Fig. 7).
Fig. 7.
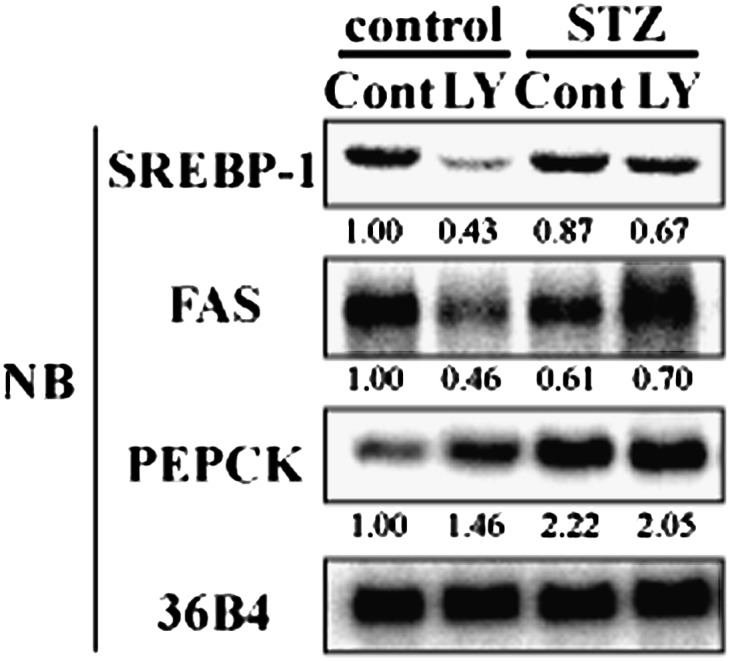
Hepatic SREBP-1c expression induced by refeeding abolished PKCbeta selective inhibitor on hepatic SREBP-1 expression. 24-h-fasted mice (control and STZ-treated mice) were followed by 12-h refeeding. Food was prepared as normal diet (Cont) and LY333531-contained normal diet (LY). mRNA level of hepatic SREBP-1 in Cont or LY administrated control and STZ mice. Extracted liver total RNA was pooled and RNA aliquots (10 μg/lane) were subjected to Northern blot analysis using labeled cDNA probes as indicated in figure (n = 4–6). NB, Northern blot; PEPCK, phosphoenolpyruvate carboxykinase; PKC, protein kinase C; Sp, specificity protein; SREBP, sterol regulatory element-binding protein; STZ, streptozotocin.
TABLE 2.
Metabolic parameters of LY333531-administrated mice
| Control |
STZ |
|||
|---|---|---|---|---|
| Cont | LY | Cont | LY | |
| N | 4 | 4 | 6 | 6 |
| Body weight (g) | 26.0 ± 1.9 | 25.1 ± 0.72 | 22.8 ± 1.2 | 21.1 ± 1.7 |
| Liver weight (g) | 1.69 ± 0.17 | 1.51 ± 0.01 | 1.55 ± 0.18 | 1.25 ± 0.02b |
| Glucose (mg/dl) | 198 ± 27 | 200 ± 18 | 550 ± 80 | 675 ± 53b |
| Triglyceride (mg/dl) | 166.0 ± 30 | 159.3 ± 17 | 205 ± 59 | 197 ± 38 |
| Nonesterified fatty acid (mEq/l) | 0.442 ± 0.06 | 0.661 ± 0.09a | 0.687 ± 0.13 | 0.655 ± 0.18 |
| Cholesterol (mg/dl) | 116.0 ± 8.6 | 117.6 ± 8.0 | 150.3 ± 12 | 120.1 ± 22b |
| Insulin (ng/ml) | 4.61 ± 0.48 | 2.70 ± 0.72a | 0.258 ± 0.28 | 0.146 ± 0.12 |
| Food intake (g/mouse) | 3.43 | 3.48 | 4.28 | 4.47 |
| PKC activity (pmol/min/μg) | 2.00 ± 1.1 | 0.715 ± 0.42a | 1.38 ± 0.18 | 0.90 ± 0.57 |
Food was prepared as normal diet (Cont) and LY333531-containing normal diet (LY). STZ or vehicle was administrated 100 mg/kg two times. After one week, glucose level was measured. Insulin-depleted mice were subjected to experiment. All mice were euthanized after 12-h refeeding state (on indicated diet) following 24-h fasting. Values are mean ± SD (n = 5). Abbreviations: Cont, normal diet; LY, LY333531-containing normal diet; PKC, protein kinase C; STZ, streptozotocin.
P < 0.05 versus STZ-untreated control mice on control diet.
P < 0.05 versus STZ-treated mice on control diet.
Suppression of PKCbeta blunts SREBP-1c activation in the refed state
Knockdown of PKCbeta in the liver by adenoviral shRNA caused complete suppression of PKCbeta protein and a marked inhibition of hepatic SREBP-1c expression in a refed state (Fig. 8A–C). SREBP-1c inhibition by PKCbeta knockdown was accompanied by a reduction in FAS expression with a reciprocal elevation in insulin receptor substrate-2 and PEPCK expression (23, 24) (Fig. 8A). Conversely, overexpression of PKCbeta enhanced SREBP-1c mRNA (Fig. 8D). Suppression of PKCepsilon by adenoviral shRNA did not induce inhibition of SREBP-1c or changes in SREBP-1-regulated genes as observed in PKCbeta knockdown (Fig. 8A). PKCbeta knockdown and hepatic SREBP-1c suppression resulted in changes in plasma parameters (Table 3). Although food intake was not changed, plasma glucose was reduced without changes in plasma insulin levels. Plasma triglycerides and free fatty acids were also reduced. PKCepsilon knockdown also decreased plasma glucose, but no other changes were observed. These data support the contention that PKCbeta mediates the physiological regulation of hepatic SREBP-1c by insulin, and its inhibition impacts glucose and lipid metabolism in the body.
Fig. 8.

Effect of PKCbeta knockdown or overexpression on mRNA level of hepatic SREBP-1c in C57BL/6J mice. A: C57BL/6J mice were administrated recombinant adenoviruses for knockdown (targeting lacZ, PKCbeta, and PKCepsilon). After 8 days, these mice were euthanized in the refed state. Liver total RNA was extracted and pooled. RNA aliquots (10 μg/lane) were subjected to Northern blot analysis using labeled cDNA probes as indicated in figure (n = 5). B: Confirmation of knockdown efficiency and specificity of RNAi. Mouse kidney-derived MES13 cells were infected with adenovirus expressing shRNA for 24 h. Whole cell proteins were extracted and subjected to Western blot analysis (40 μg protein/lane) using indicated antibodies. Loading control was confirmed by α-Tubulin. C: Confirmation of knockdown of liver PKCbeta and PKCepsilon. Whole liver proteins and mRNA were extracted and subjected to Western blot analysis (100 μg/lane) or Northern blot analysis (1 μg/lane). Loading control was confirmed by α-Tubulin. D: C57BL/6J mice were administrated recombinant adenovirus for overexpression (GFP and PKCbeta wild-type). After 12 days, these mice were euthanized in the ad libitum state. Liver total RNA was extracted and pooled. RNA aliquots (10 μg/lane) were subjected to Northern blot analysis using labeled cDNA probes as indicated in figure (n = 3). CAG, chicken beta-actin; FAS, fatty acid synthase; IRS, insulin receptor substrate; PKC, protein kinase C; Sp, specificity protein; SREBP, sterol regulatory element-binding protein; WT, wild type.
TABLE 3.
Metabolic parameters of PKCbeta or epsilon knockdown mice
| Knockdown | LacZ | PKCbeta | PKCepsilon |
|---|---|---|---|
| Body weight (g) | 20.9 ± 0.9 | 20.5 ± 0.9 | 20.5 ± 0.6 |
| Liver weight (g) | 1.92 ± 0.24 | 1.51 ± 0.17a | 1.73 ± 0.10 |
| Stomach weight (g) | 1.310 ± 0.13 | 1.328 ± 0.24 | 1.180 ± 0.32 |
| Glucose (mg/dl) | 250 ± 68 | 165.3 ± 26a | 175.8 ± 32a |
| Triglyceride (mg/dl) | 382.1 ± 44 | 94.30 ± 34b | 192.8 ± 23b |
| Nonesterified fatty acid (mEq/l) | 0.517 ± 0.08 | 0.352 ± 0.13 | 0.417 ± 0.02 |
| Cholesterol (mg/dl) | 84.36 ± 12 | 87.49 ± 12 | 79.45 ± 9.3 |
| Insulin (ng/ml) | 12.25 ± 10 | 12.25 ± 3.4 | 10.68 ± 3.5 |
All mice were euthanized after refeeding for 12 h (high sucrose low fat diet) following fasting for 24 h. Values are means ± SD (n = 5). Abbreviations: PKC, protein kinase C.
P < 0.05 versus AdlacZ-treated control mice.
P < 0.01 versus AdlacZ-treated control mice.
Sp1 and Sp3 are reciprocally involved in PKCbeta activation of the SREBP-1c promoter
Finally, we assessed whether Sp1 and Sp3 are involved in the transcriptional regulation of SREBP-1c in vivo. Suppression of Sp1 and Sp3 proteins was validated by immunoblot analysis. Knockdown of Sp1 in the liver caused a partial inhibition of hepatic SREBP-1c expression in the refed state (Fig. 9A). As a result, the expression of FAS, a target gene of SREBP-1c, was also suppressed. In contrast, knockdown of Sp3 in the liver caused a slight upregulation of SREBP-1c and FAS expression. Meanwhile, in a feeding cycle, amounts of Sp1 and Sp3 proteins in the nucleus were not altered by fasting or refeeding in wild-type mice, while induction of nuclear SREBP-1 protein in a refed state was marked (Fig. 9B). ChIP assay demonstrated that Sp3 could bind the GC box-containing region in the SREBP-1c promoter in nuclei of fasted mice. Refeeding diminished this binding. Reciprocally, Sp1 did not show binding during fasting but replaced Sp3 on the region upon refeeding (Fig. 9C). Finally, to ascertain the influence of PKCbeta on Sp1 action under refeeding state, LY333531 was administrated to fasted mice. Hepatic SREBP-1c expression induced by refeeding was attenuated by LY333531. Sp1 binding to the GC box-containing region in SREBP-1c promoter during refeeding was suppressed by LY333531 (Fig. 9D). Food intake, confirmed by the stomach weight of each mouse, was the same level (data not shown). These results imply that Sp1 and Sp3 could serve as positive and negative regulators, respectively, controlling SREBP-1c expression in response to nutritional states and that these transcription factors might have opposing effects on the SREBP-1c promoter. Therefore, the PKCbeta-Sp family pathway participates, at least in part, in the control of lipid metabolism via transcriptional regulation of SREPB-1c gene.
Fig. 9.

Effect of Sp1 and Sp3 knockdown on expression of SREBP-1c in vivo. A: C57BL/6J mice were administrated recombinant adenovirus for knockdown (targeting lacZ, Sp1, and Sp3). After 8 days, these mice were subjected to the fasting/refeeding procedure and euthanized. Liver total RNA was extracted and pooled. RNA aliquots (10 μg/lane) were subjected to Northern blot analysis using labeled cDNA probes as indicated in figure. Knockdown efficiency and specificity of adenoviruses expressing shRNA were confirmed by Western blot analysis using whole liver proteins (50 μg protein/lane) and indicated antibodies. Loading control was confirmed by α-Tubulin. B: Nuclear protein level of Sp1 and Sp3. Liver nuclear extracts (20 μg/lane) from fasting and refeeding mice were subjected to Western blot analysis using indicated antibodies. C: DNA binding of Sp1 and Sp3 to GC box- containing region in SREBP-1c promoter. ChIP analysis was performed using liver nuclear samples extracted from liver of fasting and refeeding mice. After coimmunoprecipitation using indicated antibodies, DNA was extracted. PCR primers were set in upstream and downstream of GC box in SREBP-1c promoter. D: Effect of PKCbeta inhibition on Sp1 binding to GC box-containing region under refeeding state. After 24 h fasting, LY333531 (10 mg/kg) or vehicle were intraperitoneally administrated to C57BL/6J mice. After 12 h refeeding of high-sucrose, low-fat diet, liver samples were subjected to ChIP assay and Northern blotting. Relative expression level (SREBP-1c/36B4) was shown as means ± SD. *P < 0.001 versus vehicle-treated refed mice. N = 3–5 of each group. NB, Northern blot; PEPCK, phosphoenolpyruvate carboxykinase; PKC, protein kinase C; Sp, specificity protein; SREBP, sterol regulatory element-binding protein; USF, upstream transcription factor; WB, Western blot; WT, wild type.
DISCUSSION
Our current study clearly demonstrates that PKCbeta plays a crucial role in hepatic nutritional expression of SREBP-1c. Although PKCepsilon can also activate the SREBP-1c promoter, adenoviral overexpression, knockdown, and inhibitor experiments indicate that PKCbeta is the primary mediator of physiological activation of hepatic SREBP-1c expression in a fed state. PKCbeta is also responsible for insulin-mediated activation of SREBP-1c, based upon the data from insulin treatment of primary hepatocytes and STZ-treated mice. PKCbeta-mediated regulation of SREBP-1c was accompanied by changes in expression of downstream lipogenic genes, validating the PKCbeta/SREBP-1c pathway as an important lipogenic signal.
PKCbeta has been recognized as a pathogenic pathway for diabetic microangiopathic complications that are caused by chronic hyperglycemia. Unexpectedly, our current studies establish PKCbeta-induced hepatic SREBP-1c expression as a mediator of insulin signaling (but not hyperglycemia) in addition to PKClambda (35). As reported previously, insulin depletion by STZ sustained high levels of expression of SREBP-1c in a refed state (16). Our current data further demonstrate that STZ treatment actually increased SREBP-1c expression in the presence of the PKCbeta inhibitor LY333531, implicating both an insulin- and PKCbeta-independent mechanism for activation of SREBP-1c expression. The factor or pathway responsible for this hyperglycemia-mediated activation of SREBP-1c is currently unknown. In this study, PKCepsilon did not participate in SREBP-1c activation in a refeeding state. However, some evidence revealed that PKCepsilon could be involved in nonalcoholic fatty liver in addition to PKClambda (36–38). Therefore, these PKC isoforms could play a role of SREBP-1c activation in pathological states.
Recently, it has been reported that triglyceride accumulation was decreased in liver and muscle with reduced adiposity in PKCbeta knockout mice (39). Interestingly, adipocyte SREPB-1c expression was attenuated in PKCbeta knockout mouse. Thus, the PKCbeta-SREBP-1c pathway might regulate adipocyte differentiation and lipid metabolism in addition to a role in hepatocytes.
High-fat feeding and obesity derived from genetic deletions (such as ob/ob mice) also sustain activation of hepatic SREBP-1c despite hepatosteatosis (40, 41). In this lipotoxic state, PKCepsilon could be involved. In our current data on fasting/refeeding and STZ experiments, direct involvement of endogenous PKC involvement in regulation of SREBP-1c was not detected. However, we observed that SREBP-1c expression can be induced by overexpression of PKCepsilon in a more efficient manner than PKCbeta. Thus, it is conceivable that activation of PKCepsilon by high-fat feeding is responsible for SREBP-1c activation in hepatosteatosis and may also contribute to insulin resistance.
A series of promoter analyses indicated that PKCbeta activation of the SREBP-1c promoter is mediated through modifying the action of Sp1/Sp3 on the Sp1 site in the SRE complex of the promoter. This SRE complex was originally found during our previous analysis of the SREBP-1c promoter, and it was anticipated that this autoloop activation system could be a part of mechanism of the overshooting phenomenon of hepatic SREBP-1c expression in the refed state (28). Direct interaction and synergistic transactivation by SREBP and Sp1 are known to occur in various SREBP target promoters. A recent report on involvement of Sp1 in insulin induction of rat SREBP-1c promoter also supports our hypothesis (42). Our current data suggest that PKC mediates this process in the SREBP-1c promoter. At fasting, in the absence of insulin and PKCbeta action, Sp3 dominates the site and is likely to have a negative impact on SREBP-1c transcription. It has been reported that Sp3 works as a repressor of transcription because it contains an inhibitory domain. In a fed state, PKCbeta leads to a shift to Sp1, which contributes to activation of SREBP-1c transcription. However, the functions of Sp1 and Sp3 vary among Sp target genes, and the precise molecular mechanism by which PKCbeta enhances Sp protein-mediated regulation of the SREBP-1c promoter is currently unknown. Accumulating evidence suggests that Sp1 is an important regulator of expression of genes crucial for biological actions, including growth and metabolism. Other types of modification of Sp family, such as phosphorylation (43), acetylation (44), glycosylation (45, 46), and sumolyation (47), should be investigated in the light of nutritional regulation.
Our current study contributes to understanding of the molecular mechanism by which excess sugars and carbohydrates are converted to triglycerides through insulin action. Further studies are needed to clarify how insulin activates PKCbeta, linking to transactivation of Sp1 and Sp3 (Fig. 10). The molecular mechanism for hyperglycemia activation of SREBP-1c is another unsolved issue. Insulin-signaling pathways and protein kinases are highly connected, linking to transcriptional regulation of energy metabolism. Molecular dissection of this system should help understanding pathophysiological states, such as hyperlipidemia, insulin resistance, and diabetes.
Fig. 10.

Schematic illustration of SREBP-1c transcription in fed state. PKC, protein kinase C; SOCS, suppressor of cytokine signaling; Sp, specificity protein; SREBP, sterol regulatory element-binding protein STAT, signal transducer and activator of transcription.
Acknowledgments
The authors are grateful to Dr. Peter Parker for generously providing expression plasmids for PKCbetaCA and PKCepsilonCA. We also thank Dr. Alyssa H Hasty for careful reading of this manuscript.
Footnotes
Abbreviations:
- ACC
- acetyl-CoA carboxylase
- LXR
- liver X receptor
- LXRE
- LXR response element
- PKC
- protein kinase C
- PMA
- phorbol-12-myristate-13-acetate
- SCD
- stearoyl-CoA desaturase
- SRE
- sterol regulatory element
- Sp
- special protein
- SREBP
- sterol-regulatory element binding protein
- STZ
- streptozotocin
This study was supported in part by the Japanese Ministry of Education, Science, Sports and Culture, Grant-in-Aid for Scientific Research.
REFERENCES
- 1.Brown M. S., Goldstein J. L. 1997. The SREBP pathway: regulation of cholesterol metabolism by proteolysis of a membrane-bound transcription factor. Cell. 89: 331–340. [DOI] [PubMed] [Google Scholar]
- 2.Shimano H., Horton J. D., Hammer R. E., Shimomura I., Brown M. S., Goldstein J. L. 1996. Overproduction of cholesterol and fatty acids causes massive liver enlargement in transgenic mice expressing truncated SREBP-1a. J. Clin. Invest. 98: 1575–1584. [DOI] [PMC free article] [PubMed] [Google Scholar]
- 3.Shimano H., Horton J. D., Shimomura I., Hammer R. E., Brown M. S., Goldstein J. L. 1997. Isoform 1c of sterol regulatory element binding protein is less active than isoform 1a in livers of transgenic mice and in cultured cells. J. Clin. Invest. 99: 846–854. [DOI] [PMC free article] [PubMed] [Google Scholar]
- 4.Horton J. D., Shimomura I., Brown M. S., Hammer R. E., Goldstein J. L., Shimano H. 1998. Activation of cholesterol synthesis in preference to fatty acid synthesis in liver and adipose tissue of transgenic mice overproducing sterol regulatory element-binding protein-2. J. Clin. Invest. 101: 2331–2339. [DOI] [PMC free article] [PubMed] [Google Scholar]
- 5.Shimomura I., Shimano H., Horton J. D., Goldstein J. L., Brown M. S. 1997. Differential expression of exons 1a and 1c in mRNAs for sterol regulatory element binding protein-1 in human and mouse organs and cultured cells. J. Clin. Invest. 99: 838–845. [DOI] [PMC free article] [PubMed] [Google Scholar]
- 6.Shimano H. 2000. Sterol regulatory element-binding protein-1 as a dominant transcription factor for gene regulation of lipogenic enzymes in the liver. Trends Cardiovasc. Med. 10: 275–278. [DOI] [PubMed] [Google Scholar]
- 7.Shimano H., Yahagi N., Amemiya-Kudo M., Hasty A. H., Osuga J., Tamura Y., Shionoiri F., Iizuka Y., Ohashi K., Harada K., et al. 1999. Sterol regulatory element-binding protein-1 as a key transcription factor for nutritional induction of lipogenic enzyme genes. J. Biol. Chem. 274: 35832–35839. [DOI] [PubMed] [Google Scholar]
- 8.Liang G., Yang J., Horton J. D., Hammer R. E., Goldstein J. L., Brown M. S. 2002. Diminished hepatic response to fasting/refeeding and liver X receptor agonists in mice with selective deficiency of sterol regulatory element-binding protein-1c. J. Biol. Chem. 277: 9520–9528. [DOI] [PubMed] [Google Scholar]
- 9.Korn B. S., Shimomura I., Bashmakov Y., Hammer R. E., Horton J. D., Goldstein J. L., Brown M. S. 1998. Blunted feedback suppression of SREBP processing by dietary cholesterol in transgenic mice expressing sterol-resistant SCAP(D443N). J. Clin. Invest. 102: 2050–2060. [DOI] [PMC free article] [PubMed] [Google Scholar]
- 10.Matsuda M., Korn B. S., Hammer R. E., Moon Y. A., Komuro R., Horton J. D., Goldstein J. L., Brown M. S., Shimomura I. 2001. SREBP cleavage-activating protein (SCAP) is required for increased lipid synthesis in liver induced by cholesterol deprivation and insulin elevation. Genes Dev. 15: 1206–1216. [DOI] [PMC free article] [PubMed] [Google Scholar]
- 11.Horton J. D., Bashmakov Y., Shimomura I., Shimano H. 1998. Regulation of sterol regulatory element binding proteins in livers of fasted and refed mice. Proc. Natl. Acad. Sci. USA. 95: 5987–5992. [DOI] [PMC free article] [PubMed] [Google Scholar]
- 12.Shimomura I., Bashmakov Y., Ikemoto S., Horton J. D., Brown M. S., Goldstein J. L. 1999. Insulin selectively increases SREBP-1c mRNA in the livers of rats with streptozotocin-induced diabetes. Proc. Natl. Acad. Sci. USA. 96: 13656–13661. [DOI] [PMC free article] [PubMed] [Google Scholar]
- 13.Ono H., Shimano H., Katagiri H., Yahagi N., Sakoda H., Onishi Y., Anai M., Ogihara T., Fujishiro M., Viana A. Y., et al. 2003. Hepatic Akt activation induces marked hypoglycemia, hepatomegaly, and hypertriglyceridemia with sterol regulatory element binding protein involvement. Diabetes. 52: 2905–2913. [DOI] [PubMed] [Google Scholar]
- 14.Matsumoto M., Ogawa W., Akimoto K., Inoue H., Miyake K., Furukawa K., Hayashi Y., Iguchi H., Matsuki Y., Hiramatsu R., et al. 2003. PKClambda in liver mediates insulin-induced SREBP-1c expression and determines both hepatic lipid content and overall insulin sensitivity. J. Clin. Invest. 112: 935–944. [DOI] [PMC free article] [PubMed] [Google Scholar]
- 15.Hasty A. H., Shimano H., Yahagi N., Amemiya-Kudo M., Perrey S., Yoshikawa T., Osuga J., Okazaki H., Tamura Y., Iizuka Y., et al. 2000. Sterol regulatory element-binding protein-1 is regulated by glucose at the transcriptional level. J. Biol. Chem. 275: 31069–31077. [DOI] [PubMed] [Google Scholar]
- 16.Matsuzaka T., Shimano H., Yahagi N., Amemiya-Kudo M., Okazaki H., Tamura Y., Iizuka Y., Ohashi K., Tomita S., Sekiya M., et al. 2004. Insulin-independent induction of sterol regulatory element-binding protein-1c expression in the livers of streptozotocin-treated mice. Diabetes. 53: 560–569. [DOI] [PubMed] [Google Scholar]
- 17.Yamamoto T., Shimano H., Inoue N., Nakagawa Y., Matsuzaka T., Takahashi A., Yahagi N., Sone H., Suzuki H., Toyoshima H., Yamada N. 2007. Protein kinase A suppresses sterol regulatory element-binding protein-1c expression via phosphorylation of liver X receptor in the liver. J. Biol. Chem. 282: 11687–11695. [DOI] [PubMed] [Google Scholar]
- 18.Yoshikawa T., Shimano H., Yahagi N., Ide T., Amemiya-Kudo M., Matsuzaka T., Nakakuki M., Tomita S., Okazaki H., Tamura Y., et al. 2002. Polyunsaturated fatty acids suppress sterol regulatory element-binding protein 1c promoter activity by inhibition of liver X receptor (LXR) binding to LXR response elements. J. Biol. Chem. 277: 1705–1711. [DOI] [PubMed] [Google Scholar]
- 19.Ou J., Tu H., Shan B., Luk A., DeBose-Boyd R. A., Bashmakov Y., Goldstein J. L., Brown M. S. 2001. Unsaturated fatty acids inhibit transcription of the sterol regulatory element-binding protein-1c (SREBP-1c) gene by antagonizing ligand-dependent activation of the LXR. Proc. Natl. Acad. Sci. USA. 98: 6027–6032. [DOI] [PMC free article] [PubMed] [Google Scholar]
- 20.Yoshikawa T., Shimano H., Amemiya-Kudo M., Yahagi N., Hasty A. H., Matsuzaka T., Okazaki H., Tamura Y., Iizuka Y., Ohashi K., et al. 2001. Identification of liver X receptor-retinoid X receptor as an activator of the sterol regulatory element-binding protein 1c gene promoter. Mol. Cell. Biol. 21: 2991–3000. [DOI] [PMC free article] [PubMed] [Google Scholar]
- 21.Sampson S. R., Cooper D. R. 2006. Specific protein kinase C isoforms as transducers and modulators of insulin signaling. Mol. Genet. Metab. 89: 32–47. [DOI] [PMC free article] [PubMed] [Google Scholar]
- 22.Way K. J., Katai N., King G. L. 2001. Protein kinase C and the development of diabetic vascular complications. Diabet. Med. 18: 945–959. [DOI] [PubMed] [Google Scholar]
- 23.Ide T., Shimano H., Yahagi N., Matsuzaka T., Nakakuki M., Yamamoto T., Nakagawa Y., Takahashi A., Suzuki H., Sone H., et al. 2004. SREBPs suppress IRS-2-mediated insulin signalling in the liver. Nat. Cell Biol. 6: 351–357. [DOI] [PubMed] [Google Scholar]
- 24.Yamamoto T., Shimano H., Nakagawa Y., Ide T., Yahagi N., Matsuzaka T., Nakakuki M., Takahashi A., Suzuki H., Sone H., et al. 2004. SREBP-1 interacts with hepatocyte nuclear factor-4 alpha and interferes with PGC-1 recruitment to suppress hepatic gluconeogenic genes. J. Biol. Chem. 279: 12027–12035. [DOI] [PubMed] [Google Scholar]
- 25.Kaneki M., Kharbanda S., Pandey P., Yoshida K., Takekawa M., Liou J. R., Stone R., Kufe D. 1999. Functional role for protein kinase Cbeta as a regulator of stress-activated protein kinase activation and monocytic differentiation of myeloid leukemia cells. Mol. Cell. Biol. 19: 461–470. [DOI] [PMC free article] [PubMed] [Google Scholar]
- 26.Zhang J., Anastasiadis P. Z., Liu Y., Thompson E. A., Fields A. P. 2004. Protein kinase C (PKC) betaII induces cell invasion through a Ras/Mek-, PKC iota/Rac 1-dependent signaling pathway. J. Biol. Chem. 279: 22118–22123. [DOI] [PubMed] [Google Scholar]
- 27.Schonwasser D. C., Marais R. M., Marshall C. J., Parker P. J. 1998. Activation of the mitogen-activated protein kinase/extracellular signal-regulated kinase pathway by conventional, novel, and atypical protein kinase C isotypes. Mol. Cell. Biol. 18: 790–798. [DOI] [PMC free article] [PubMed] [Google Scholar]
- 28.Amemiya-Kudo M., Shimano H., Yoshikawa T., Yahagi N., Hasty A. H., Okazaki H., Tamura Y., Shionoiri F., Iizuka Y., Ohashi K., et al. 2000. Promoter analysis of the mouse sterol regulatory element-binding protein-1c gene. J. Biol. Chem. 275: 31078–31085. [DOI] [PubMed] [Google Scholar]
- 29.Cagen L. M., Deng X., Wilcox H. G., Park E. A., Raghow R., Elam M. B. 2005. Insulin activates the rat sterol-regulatory-element-binding protein 1c (SREBP-1c) promoter through the combinatorial actions of SREBP, LXR, Sp-1 and NF-Y cis-acting elements. Biochem. J. 385: 207–216. [DOI] [PMC free article] [PubMed] [Google Scholar]
- 30.Auwerx J. H., Chait A., Deeb S. S. 1989. Regulation of the low density lipoprotein receptor and hydroxymethylglutaryl coenzyme A reductase genes by protein kinase C and a putative negative regulatory protein. Proc. Natl. Acad. Sci. USA. 86: 1133–1137. [DOI] [PMC free article] [PubMed] [Google Scholar]
- 31.Russell A. P. 2004. Lipotoxicity: the obese and endurance-trained paradox. Int. J. Obes. Relat. Metab. Disord. 28(Suppl 4): S66–S71. [DOI] [PubMed] [Google Scholar]
- 32.Terstegen L., Gatsios P., Bode J. G., Schaper F., Heinrich P. C., Graeve L. 2000. The inhibition of interleukin-6-dependent STAT activation by mitogen-activated protein kinases depends on tyrosine 759 in the cytoplasmic tail of glycoprotein 130. J. Biol. Chem. 275: 18810–18817. [DOI] [PubMed] [Google Scholar]
- 33.Ueki K., Kondo T., Kahn C. R. 2004. Suppressor of cytokine signaling 1 (SOCS-1) and SOCS-3 cause insulin resistance through inhibition of tyrosine phosphorylation of insulin receptor substrate proteins by discrete mechanisms. Mol. Cell. Biol. 24: 5434–5446. [DOI] [PMC free article] [PubMed] [Google Scholar]
- 34.Ueki K., Kondo T., Tseng Y. H., Kahn C. R. 2004. Central role of suppressors of cytokine signaling proteins in hepatic steatosis, insulin resistance, and the metabolic syndrome in the mouse. Proc. Natl. Acad. Sci. USA. 101: 10422–10427. [DOI] [PMC free article] [PubMed] [Google Scholar]
- 35.Taniguchi C. M., Kondo T., Sajan M., Luo J., Bronson R., Asano T., Farese R., Cantley L. C., Kahn C. R. 2006. Divergent regulation of hepatic glucose and lipid metabolism by phosphoinositide 3-kinase via Akt and PKClambda/zeta. Cell Metab. 3: 343–353. [DOI] [PubMed] [Google Scholar]
- 36.Samuel V. T., Liu Z. X., Qu X., Elder B. D., Bilz S., Befroy D., Romanelli A. J., Shulman G. I. 2004. Mechanism of hepatic insulin resistance in non-alcoholic fatty liver disease. J. Biol. Chem. 279: 32345–32353. [DOI] [PubMed] [Google Scholar]
- 37.Samuel V. T., Liu Z. X., Wang A., Beddow S. A., Geisler J. G., Kahn M., Zhang X. M., Monia B. P., Bhanot S., Shulman G. I. 2007. Inhibition of protein kinase Cepsilon prevents hepatic insulin resistance in nonalcoholic fatty liver disease. J. Clin. Invest. 117: 739–745. [DOI] [PMC free article] [PubMed] [Google Scholar]
- 38.Sajan M. P., Standaert M. L., Nimal S., Varanasi U., Pastoor T., Mastorides S., Braun U., Leitges M., Farese R. V. 2009. The critical role of atypical protein kinase C in activating hepatic SREBP-1c and NFkappaB in obesity. J. Lipid Res. 50: 1133–1145. [DOI] [PMC free article] [PubMed] [Google Scholar]
- 39.Bansode R. R., Huang W., Roy S. K., Mehta M., Mehta K. D. 2008. Protein kinase C deficiency increases fatty acid oxidation and reduces fat storage. J. Biol. Chem. 283: 231–236. [DOI] [PubMed] [Google Scholar]
- 40.Shimomura I., Matsuda M., Hammer R. E., Bashmakov Y., Brown M. S., Goldstein J. L. 2000. Decreased IRS-2 and increased SREBP-1c lead to mixed insulin resistance and sensitivity in livers of lipodystrophic and ob/ob mice. Mol. Cell. 6: 77–86. [PubMed] [Google Scholar]
- 41.Yahagi N., Shimano H., Hasty A., Matsuzaka T., Ide T., Yoshida K., Amemiya-Kudo M., Tomita S., Okazaki H., Tamura Y., et al. 2002. Absence of sterol regulatory element-binding protein-1 (SREBP-1) ameliorates fatty livers but not obesity or insulin resistance in Lep(ob)/Lep(ob) mice. J. Biol. Chem. 277: 19353–19357. [DOI] [PubMed] [Google Scholar]
- 42.Deng X., Yellaturu C., Cagen L., Wilcox H. G., Park E. A., Raghow R., Elam M. B. 2007. Expression of the rat sterol regulatory element-binding protein-1c gene in response to insulin is mediated by increased transactivating capacity of specificity protein 1 (Sp1). J. Biol. Chem. 282: 17517–17529. [DOI] [PubMed] [Google Scholar]
- 43.Milanini-Mongiat J., Pouyssegur J., Pages G. 2002. Identification of two Sp1 phosphorylation sites for p42/p44 mitogen-activated protein kinases: their implication in vascular endothelial growth factor gene transcription. J. Biol. Chem. 277: 20631–20639. [DOI] [PubMed] [Google Scholar]
- 44.Braun H., Koop R., Ertmer A., Nacht S., Suske G. 2001. Transcription factor Sp3 is regulated by acetylation. Nucleic Acids Res. 29: 4994–5000. [DOI] [PMC free article] [PubMed] [Google Scholar]
- 45.Yang X., Su K., Roos M. D., Chang Q., Paterson A. J., Kudlow J. E. 2001. O-linkage of N-acetylglucosamine to Sp1 activation domain inhibits its transcriptional capability. Proc. Natl. Acad. Sci. USA. 98: 6611–6616. [DOI] [PMC free article] [PubMed] [Google Scholar]
- 46.Yao D., Taguchi T., Matsumura T., Pestell R., Edelstein D., Giardino I., Suske G., Ahmed N., Thornalley P. J., Sarthy V. P., et al. 2006. Methylglyoxal modification of mSin3A links glycolysis to angiopoietin-2 transcription. Cell. 124: 275–286. [DOI] [PubMed] [Google Scholar]
- 47.Ross S., Best J. L., Zon L. I., Gill G. 2002. SUMO-1 modification represses Sp3 transcriptional activation and modulates its subnuclear localization. Mol. Cell. 10: 831–842. [DOI] [PubMed] [Google Scholar]