Abstract
We developed a straightforward method to form non close-packed highly ordered fcc direct and inverse opal silica photonic crystals. We utilize an electrostatically self assembled crystalline colloidal array (CCA) template formed by monodisperse, highly charged polystyrene particles. We then polymerize a hydrogel around the CCA (PCCA) and condense the silica to form a highly ordered silica impregnated (siPCCA) photonic crystal. Heating at 450 °C removes the organic polymer leaving a silica inverse opal structure. By altering the colloidal particle concentration we independently control the particle spacing and the wall thickness of the inverse opal photonic crystals. This allows us to control the optical dielectric constant modulation in order to optimize the diffraction; the dielectric constant modulation is controlled independently of the photonic crystal periodicity. These fcc photonic crystals are better ordered than typical close-packed photonic crystals because their self assembly utilizes soft electrostatic repulsive potentials. We show that colloidal particle size and charge polydispersity has modest impact on ordering, in contrast to that for close-packed crystals.
Introduction
The last two decades has seen the emergence of the important field of photonic crystals. The name photonic crystals was coined to describe materials which control light propagation through periodic variations in their optical dielectric constants.1–3
Photonic crystal materials are of major technological significance in areas such as optical computing and communications where photonic devices are being developed to replace electronic devices.3–9 Photonic crystal materials also offer the possibility to fabricate complete 3-D photonic bandgap materials which exclude electromagnetic radiation (including the vacuum field) within its finite spectral bandgap.10, 11 Phenomena such as spontaneous emission are suppressed in these materials.2, 12
Lithography is the most straightforward method to fabricate two and three dimensional photonic crystal materials for photonic applications.13–21 This top down fabrication methodology is highly successful in fabricating complex photonic crystal materials. These fabricated structures are extremely useful in demonstrating proof of concept for photonic crystal devices. However, lithographic processes are expensive, and this cost is likely to prevent commercialization of many photonic crystal devices.
Thus, much of the recent work in photonic crystal fabrication has utilized colloidal particle self assembly. The utility of colloidal particle self assembly is evident from the photonic crystal materials found in nature. For example, earth mined opals are photonic crystals formed from the close packed self assembly of silica colloidal particles.22 The first work fabricating artificial opals used gravity sedimentation to obtain photonic crystal periodic structures.23–25
Much of the recent colloidal particle self assembly work has emphasized methods that form close packed photonic crystal materials. These methods utilize variances of vertical colloidal particle deposition methods.26–30 Surprisingly, many of these close packed assembly methods claim formation of fcc crystals25, 31–33 which require that the self assembly select for the fcc crystal form, rather than the random stacked crystal forms, which would normally result from simple hard sphere interparticle interactions; the fcc crystal assembly process requires long range interparticle interactions that select for fcc ABCABC layer packing.
A major limitation of close packed photonic crystal systems is that their ordering, and therefore their photonic crystal properties depend upon the colloidal particle size polydispersity. Clearly, increasing size polydispersity will degrade ordering34. Further, charge polydispersity will degrade ordering to the extent that electrostatic interactions are involved in the close packing mechanism. Disorder in the photonic crystals degrade the magnitude and increase the widths of the Bragg diffraction peaks.34–36
Fabrication of a complete 3-D photonic bandgap material requires specific crystal structures and a very large periodic variation in its optical dielectric constant. The most straightforward approach to forming a complete 3-D photonic bandgap crystal would utilize an inverse opal fcc crystal structure that requires a minimum refractive index ratio of 2.8.37 The inverse opal structure is formed within an fcc photonic crystal by infiltrating an fcc photonic crystal structure with a high refractive index material, and then removing the original fcc spheres, leaving an inverse fcc lattice of air holes with a refractive index of n=1.
Optimization of the inverse opal crystal structure would permit decreasing the required refractive index modulation. For example, it was recently found that an inverted non close packed fcc lattice shows a wider photonic band gap (10 %) than does a close packed inverted fcc crystal structure with the same lattice constant.38, 39
The recent work which has attempted to generate non close packed photonic crystals has utilized thermal sintering and etching of close packed colloidal crystals40–42. This work has also employed conformally backfilling38, 43, 44 these close packed colloidal crystals. It should be noted that the resulting photonic crystal materials retain the disorder present in the original close packed crystals.
In the work here we demonstrate a straightforward method to form non close-packed highly ordered fcc direct and inverse opal silica photonic crystals materials. We show that size and charge polydispersity has surprisingly little impact on ordering for colloidal particle systems that are formed through electrostatic self assembly. Our group has utilized the high ordering of electrostatically self assembled crystalline colloidal array (CCA) photonic crystal materials since the mid-1980’s45–50
More recently we polymerized a hydrogel around electrostatically self assembled CCA to form a polymerized CCA (PCCA). This PCCA is a responsive photonic crystal material51 which proved useful for chemical sensing. 52–57, as well as for sensing temperature.58, 59 We also developed magnetically responsive superparamagnetic and ferrimagnetic photonic crystal materials60–62, as well as, photonic crystals that respond to light as optical switching materials. 63–67
Electrostatic CCA self assembly relies on the electrostatic repulsions between colloidal particles of like charge. For the systems used here the colloidal particle surface groups are strong acid sulfonic acids which ionize in aqueous environments. For low ionic strength aqueous solutions the electrostatic interactions are large and occur over long distances (~1 µm) which enable formation of macroscopic fcc CCA crystals. The ordering appears superior to that which can occur for close packed crystals because the soft electrostatic potentials avoid glass formation, they allow crystal annealing and they should ameliorate the disorder penalty for particle size and charge polydispersity.
Here we describe the fabrication of new highly ordered photonic crystal materials that utilize electrostatic CCA self assembly to form a highly ordered template. We then form a soft photonic crystal material where we lightly crosslink a hydrogel around the CCA template. We then condense solid silica within the PCCA hydrogel. This allows us to control the photonic crystal periodicity independently from the diameter of the colloidal particles making up the fcc crystal. This also allows us to tune the form of the dielectric constant modulation of the photonic crystal separate from its periodicity. We also demonstrate that we can remove the organic polymer and form an inverse opal structure. Thus, we can independently vary the periodicity and the silica wall thickness.
We show that our simple, electrostatic self assembly process gives rise to a photonic crystal with higher ordering compared to typical close-packed photonic crystal structure. We use DLVO theory to model interparticle interactions to gain insight into why electrostatic self assembly results in high order.
Experimental Methods
Materials
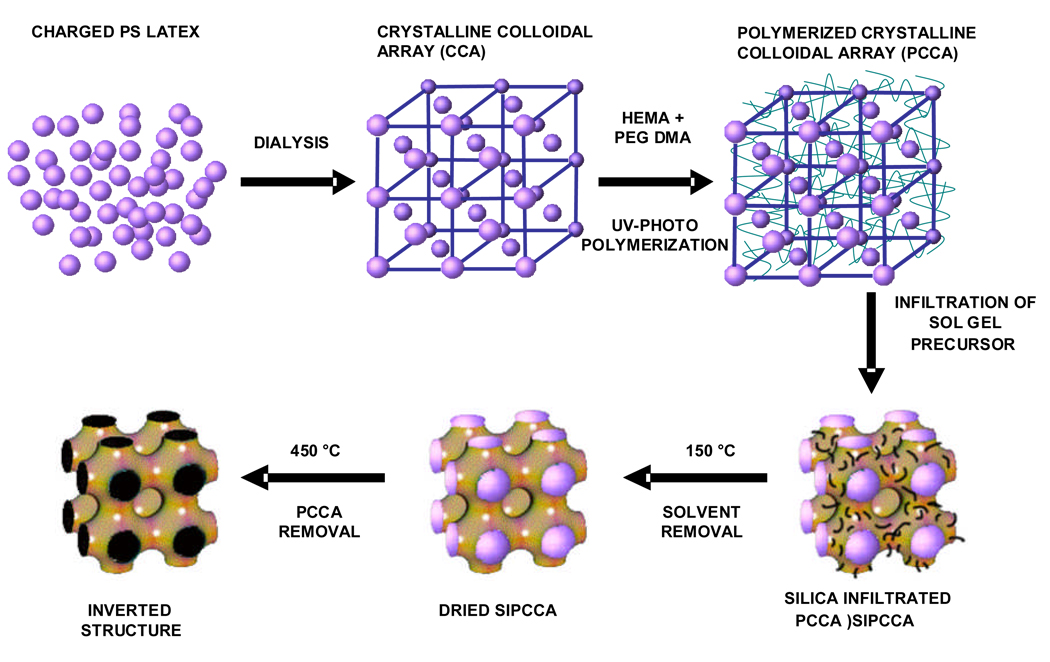
2, 2-diethoxyacetophenone (DEAP, 98%, Acros Organics), polyethylene glycol dimethacrylate 200 (Polysciences Inc.), 2-hydroxyethyl acrylate (98%, Polysciences Inc.), diethylene glycol (Sigma), anhydrous ethyl alcohol (Pharmco Inc.) and tetraethyl ortho silicate (TEOS, Fluka) were used as received. Figure 1 shows our synthetic scheme for fabricating an inverted photonic crystal (IPC) structure by using a CCA template.
Figure 1.
Charged polystyrene colloidal particles are dialyzed. Non ionic monomers are added. The system electrostatically self assembles into an fcc CCA which is UV-photopolymerized to fabricate a PCCA. A TEOS precursor is infiltrated into the hydrogel network and silica is condensed within the PCCA. The newly formed siPCCA is then heat treated to remove solvent and organic polymer forming the inverted structure.
Preparation of PCCA
The highly-charged, non-cross-linked, monodisperse polystyrene colloids (Figure 1) used to fabricate the siPCCA were prepared by emulsion polymerization.68 The colloidal particle size as measured by TEM is 180 nm ± 4nm. The colloidal particles were cleaned by dialysis against deionized water followed by shaking with mixed bed ion-exchange resin (Bio-Rad AG501-X8 (D)) In a typical PCCA recipe 2,2-hydroxyethyl methacrylate (6 g, 4.6×10⁻² mol, Polysciences) and polyethylene glycol dimethacrylate (0.174 g, 5.3×10⁻⁴ mol, Polysciences) were mixed together in a 2 dram vial. Aluminum oxide was added to remove the inhibitor contained in the monomer solutions. The solutions were centrifuged for 5 min to remove the aluminum oxide. 0.5 g of the deinhibited monomer solution supernatant was added to 2 g of the cleaned, highly charged colloidal particle dispersion.
The resulting mixture was shaken for 30 sec. 10% diethoxyacetophenone (DEAP; 10 µL, 3.84 µmol; Aldrich) was added to the mixture which was then vortexed for 30 sec. The mixture was injected between two quartz plates separated by a 125 µm Parafilm spacer. UV-photopolymerization was performed by using two UV mercury lamps (Black Ray) for 13 min. The PCCA film was removed from the quartz cell and equilibrated in a deionized water bath.
Infiltration of sol-gel precursor
A silica sol-gel precursor solution was prepared using a 1:1:3 molar ratio of TEOS/EtOH/water adjusted to a pH of 2 with concentrated HCl. The fabricated PCCA film template was immersed into two ml of the precursor solution.
Polymerization and condensation of the TEOS occurred around and within the PCCA hydrogel matrix over the course of 5 days, generating an alcogel within the PCCA template. The silica network was allowed to age and strengthen for an additional five days before further processing.
Solvent Removal
The silica sol-gel infiltrated PCCA was solvent-exchanged for one week in ethanol. This ethanol-containing, silica-infiltrated PCCA (siPCCA) was then heated at 85 °C for 1 day, followed by heating to 150 °C for 5 hrs to remove all solvent.
Polymer Removal
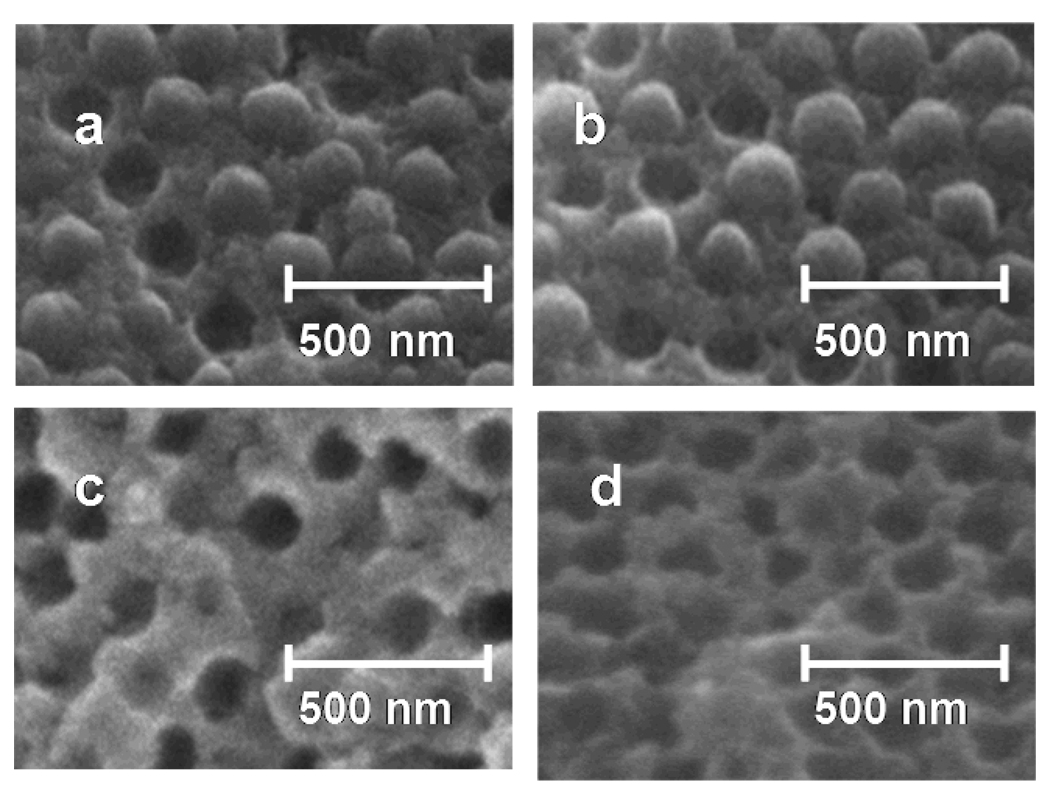
After solvent removal, the temperature was increased to 250 °C and held for 6 hours to melt the polystyrene colloidal particles as shown in Fig. 2. Higher temperature treatment at 450 °C removed all organic polymer materials, leaving behind only the infiltrated silica.69 Upon firing the sample cracked into small fragments consisting of monoliths approximately 2 mm on a side.
Figure 2.
SEM images of a room temperature cleaved siPCCA showing its evolution through the heat treatment process. a. At 85 °C the colloidal particle lattice remains intact. b. After 150 °C heat treatment little deformation of polystyrene colloidal particles is evident. c. 250 °C heat treatment melts the colloidal particles leaving some polymer behind. d. The 450 °C heat treatment removes all of the organic polymer material leaving behind a highly ordered inverted opal of pure silica.
Physical Measurements
Transmission electron microscopy was used to measure particle size. We used a Phillips FEG XL-30 FESEM operating in the ranges of 10–50 KeV to image the inverted structures. Diffraction spectra were obtained at room temperature using an Ocean Optics USB2000 spectrophotometer with a six-around-one reflectance probe. Solvent refractive indices were measured by using a Bausch & Lomb refractometer.
Results and Discussion
Photonic Crystal Structure
Fig. 2 shows four positions on a cleaved (111) surface of a silica filled PCCA (siPCCA) sample at room temperature after heat treatments at 85 °C, 150 °C, 250 °C, and 450 °C. This siPCCA was formed as shown in Fig. 1 by polymerizing a hydrogel around a CCA, which self-assembled due to the electrostatic repulsions between colloidal particles. The CCA generally forms as a face centered cubic (fcc) lattice with a spacing determined by the particle number density.
The hydrogel polymerizes around the fcc lattice without altering the CCA order. TEOS was then infiltrated and condensed into the PCCA. Figs. 2a and b show that the PCCA colloidal lattice remains intact upon condensation of silica within the PCCA hydrogel matrix. Some polystyrene particles have fallen out of the surface which proves that the PCCA hydrogel embeds the CCA lattice and does not covalently attach to the colloidal particles.
Figure 2c shows the siPCCA after heat treatment at 250 °C, which exceeds the 240 °C melting point of the non-cross-linked polystyrene70. The colloidal particles appear to have significantly melted, leaving holes in the surface. The siPCCA at this stage turned brown indicating that polymer degradation occurred. Energy dispersive x-ray analysis of the wall space shows both silicon and carbon peaks indicating the presence of both organic material and the infused silica.
Heat treatment at 450 °C (Fig. 2d) removed the brown color of the siPCCA. Energy dispersive x-ray analysis shows the absence of a carbon peak in the wall space. The organic polymer material has burnt out during this heat treatment, leaving a pristine non-close-packed silica inverted opal structure. Thermogravimetric analysis shows a decreasing mass as the structure is heated from 150 °C to 450 °C. However, it was impossible to measure the relative organic polymer loss because of a pure silica coat of unknown thickness formed around the siPCCA during the condensation of the TEOS precursor solution within the PCCA.
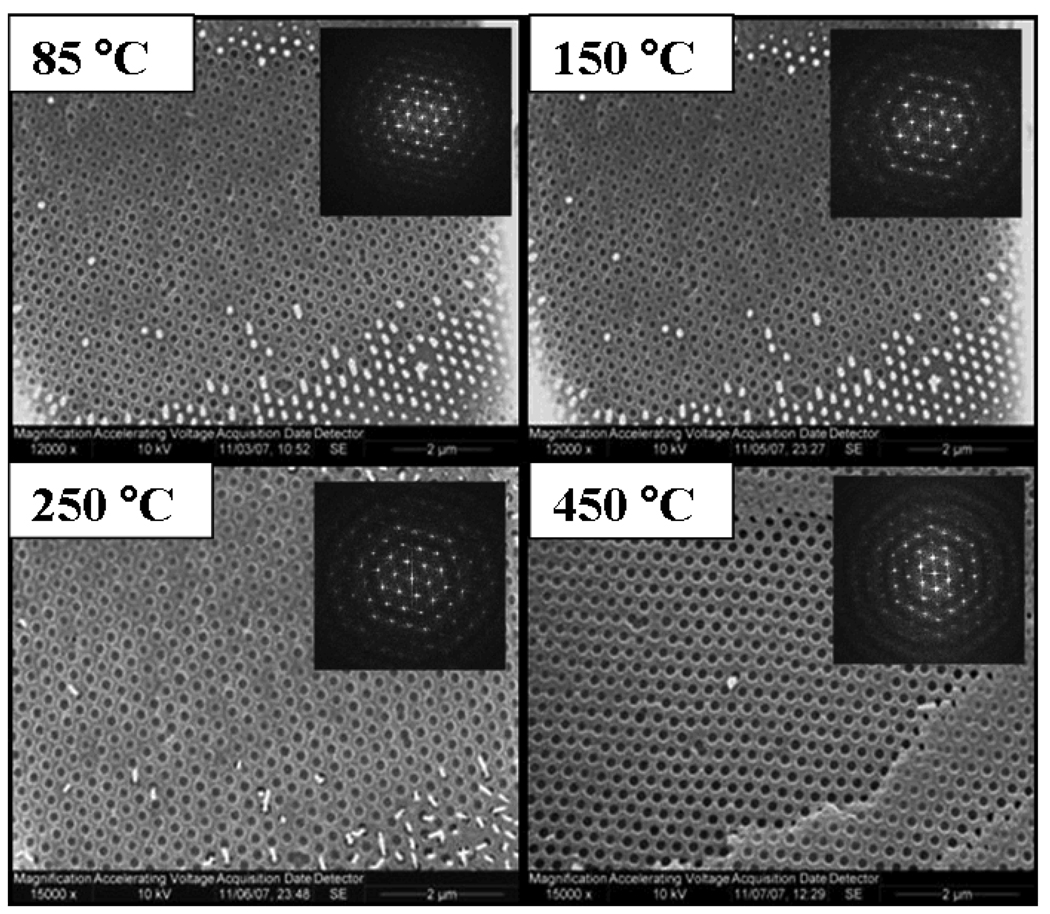
Fig. 3 shows the SEM image of a different siPCCA sample, where a razor blade was used to abrade the (111) surface. We used these SEM images to determine the siPCCA in-plane spacing of the 85 °C, 150 °C, 250 °C and 450 °C heat-treated samples. These in plane spacings were used to calculate the fcc (111) lattice plane spacing, d111:
| (1) |
where D is the nearest neighbor spacing observed in the Fig. 2 SEM, and h, k, and l are the Miller indices of the presumed face-centered-cubic crystal.
Figure 3.
SEM images of the (111) plane obtained by abraiding the surface of the siPCCA. The 450 °C sample needed to be reabraided because the palladium sputter coating had fallen off. Insets: Fourier transforms show the high ordering within the (111) plane.
Abrasion of the siPCCA sample removes the silica coat as well as latex spheres. The SEM derived (111) lattice plane spacing for the 85 °C and 150 °C heated samples were essentially identical at 245±4 nm and 245±4 nm (mean ± SD) which indicates no decrease in lattice constant upon heating. A slight decrease was calculated for the (111) lattice plane spacing for the 250 °C (238±4 nm) and 450 °C (224±5 nm) heat treated samples. The ordering and interparticle spacing which originated from the electrostatic formation of the original CCA lattice, which was rigidified by formation of the PCCA and was set by the silica condensation, is maintained throughout the heat treatment process.
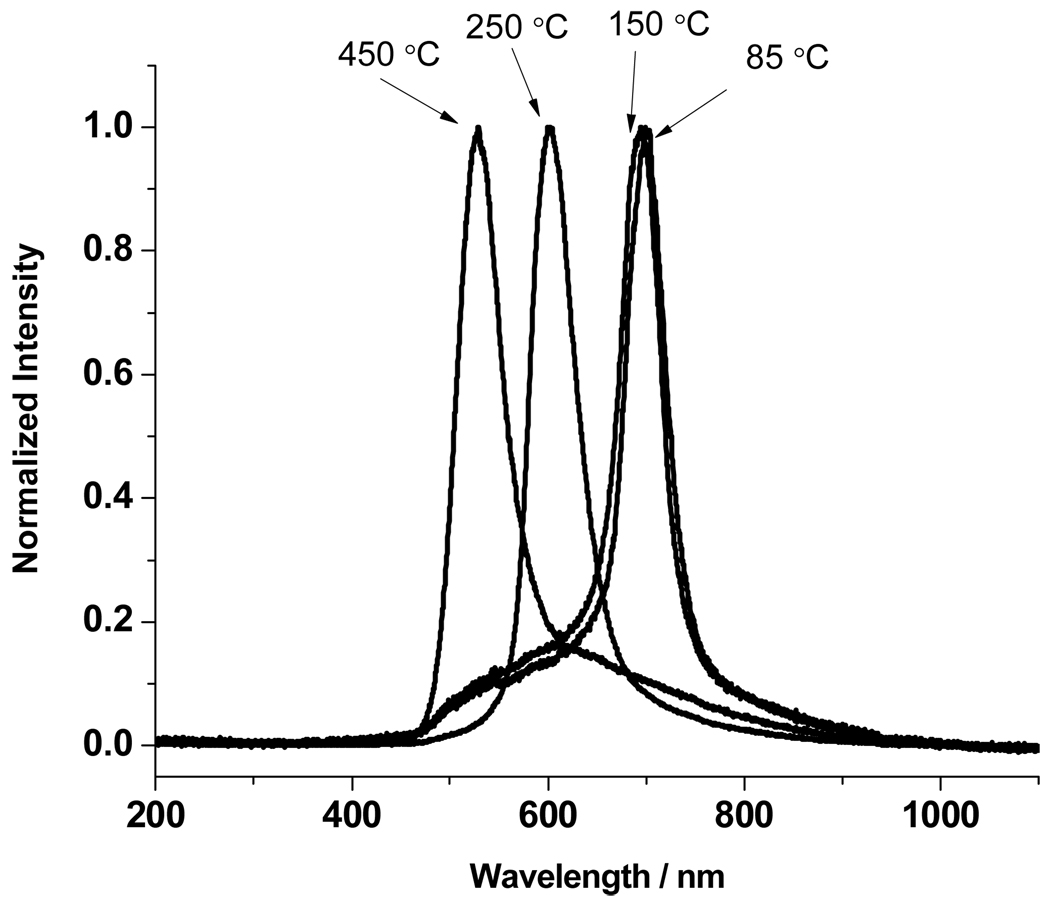
Figure 4 shows the room temperature spectrum of the 180° back diffracted light for light incident normal to the (111) surface of the heat treated siPCCA sample. The diffraction of the siPCCA blue-shifts as the treatment temperature increases above 150 °C. Bragg’s law (Eqn 2) indicates that at a constant incident glancing angle a decrease in diffraction wavelength requires a decrease in the average material refractive index, navg, or the d111 lattice plane spacing, or both.
| (2) |
where m is the order of diffraction, λ is the diffracted wavelength in air and θ is the glancing angle of incidence. The average refractive index, navg, is approximately equal to the refractive indices of the components, ni, weighted by their volume fractions, φi.
| (3) |
Substituting the SEM calculated d111 and the diffracted wavelength in Bragg’s law we can calculate navg for each treated sample (Table 1). Clearly, the average refractive index decreases at heat treatments of greater than 150 °C, indicating removal of the organic material.
Figure 4.
Room temperature diffraction spectra for light incident normal to the (111) planes of the siPCCA measured after heat treatments of 85, 150, 250 °C, and 450 °C. As discussed in the text, the blue-shift in diffraction is due to the refractive index decrease which results from the loss of polymeric material during the heat-treatment
Table 1.
Increasing heat treatment temperatures vaporize the polymer decreasing navg and slightly decreasing the nearest neighbor spacing. Removal of the organic material increases the void space.
| temp | navg | d111 | φsilica | φvoid | φorganic |
|---|---|---|---|---|---|
| 85 °C | 1.42 | 245 | 0.2 | 0.2 | 0.6 |
| 150 °C | 1.42 | 245 | 0.2 | 0.2 | 0.6 |
| 250 °C | 1.27 | 236 | 0.22 | 0.47 | 0.31 |
| 450 °C | 1.12 | 224 | 0.26 | 0.74 | 0 |
At 450 °C the inverted photonic crystal contains only silica and void space so that the relative volume fractions of each, φsilica and φvoid, can be calculated from the values of navg and nsilica
| (4) |
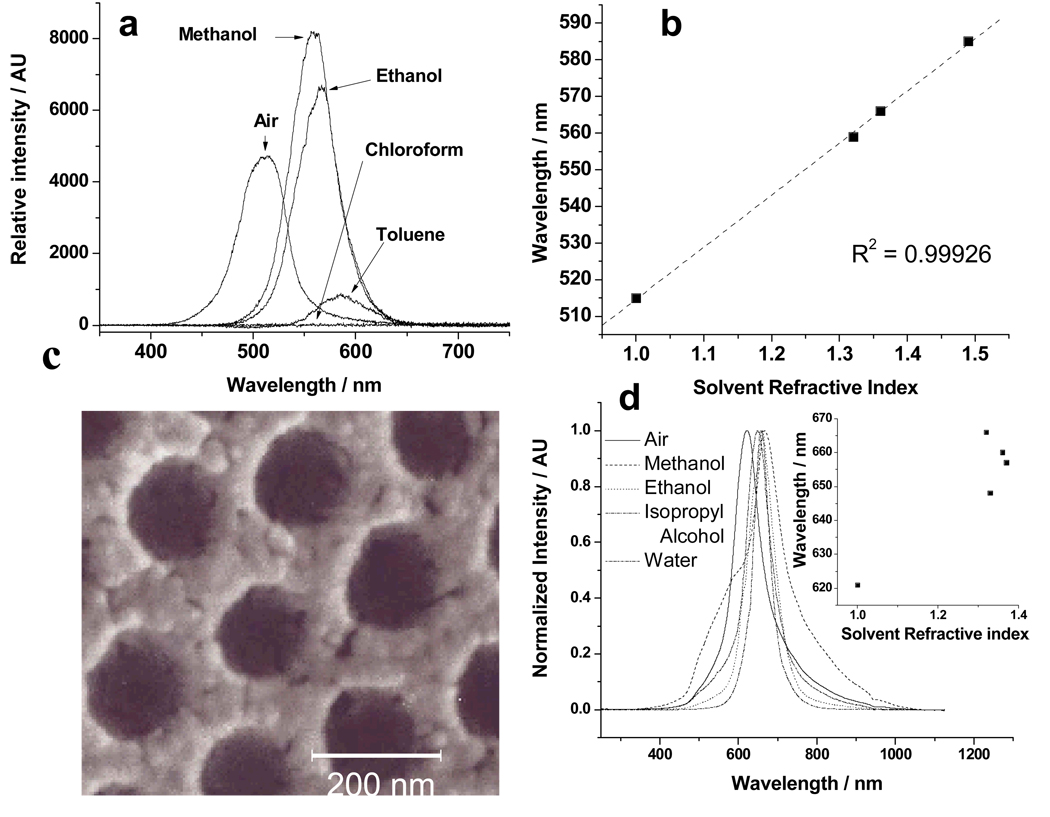
The refractive index of silica in the inverted photonic crystal was determined by infusing solvents71 into the 450 °C pure silica sample in order to refractive index match the silica which causes the diffraction to disappear (Fig. 5a). For this experiment, an inverted siPCCA was heat treated to 450 °C and the diffraction from a single region was monitored. We infused the solvents for 24 hrs to achieve equilibrium. The diffraction disappears upon infiltration of chloroform indicating that nsilica~1.45, the refractive index of CHCl3. Thus, using eqn 4, we calculate φsilica = 26% for the 450 °C heat treated sample, giving a void volume fraction of φvoid = 0.74.
Figure 5.
Study of void volume of siPCCA. a. Diffraction spectra obtained from the 450 °C heat treated siPCCA in air and with solvent infiltrations of methanol, ethanol, chloroform, and toluene. b. Linear best fit of the diffraction maxima of the 450 °C solvent infiltration data of a versus solvent refractive index. c. SEM image showing wall porosity of siPCCA after 450 °C heat treatment. d. Diffraction dependence on solvent refractive index for 250 °C heat treated sample
Table 1 shows that navg decreases for the 250 °C sample, indicating loss of organic polymer. Given a constant φsilica we can calculate the polymer and void volume fraction for all of the samples by using eqn 5.
| (5) |
By assuming that the remaining polymer composition is identical to that of the original PCCA we can estimate a volume average polymer refractive index, npolymer ~ 1.55. Table 1 shows that the 85 °C heat treated siPCCA has a ϕpolymer=0.6, which is ~50% greater than that of the originally prepared PCCA. This occurs because, although the original PCCA swells after exposure to the silica precursor solution, it then dramatically shrinks as the silica condenses within the PCCA.
Table 1 shows that there is no loss of polymer for the 150 °C heat treated sample, but almost half of the polymer is lost for the 250 °C heat treated sample. We calculate that the void volume fraction of 20 % of the 85 and 150 °C heat treated samples almost doubles for the 250 °C heat treated sample. The void volume fraction maximizes at 74% for the 250 °C heat treated sample. It should be noted that we find a 20 % void volume fraction for the 85 °C heat treated sample that results from evaporation of the solvent in the original silica condensed siPCCA. The increased silica volume fraction for the 250 °C heat treated sample results from the volume decrease of the siPCCA evident from the observed SEM decreased in-plane spacing as discussed above. Our calculations of the volume fractions at the lower heat treatment temperatures took cognizance of the calculated decrease in the (111) lattice plane spacing calculated from the SEM data. We account for the change in silica volume fraction through the proportionality , where V is the original siPCCA volume and φ´silica and V´ are the silica volume fraction and unit cell volume after heat treatment.
We can independently determine ϕsilica at 450 °C from a plot of the dependence of the diffraction wavelength for normal incidence upon the refractive index of the infiltrated solvent (Fig. 5b). The slope of eqn 6 can be used to calculate ϕvoid and the intercept to calculate ϕsilica.
| (6) |
Utilizing the derived (111) lattice plane spacing and the slope we determined a silica filling fraction of φsilica = 17%, indicating a lower φsilica than calculated from the excellent assumption that the diffraction wavelength in air can be simply related to the average siPCCA refractive index given the SEM determined lattice spacing.
We conclude that the decreased slope calculated from eqn 6 results from sealed voids which are inaccessible to the solvent. The SEM in Fig 5c shows the complex morphology of the walls of the siPCCA. Obviously, the silica has condensed as particles which are closely packed. It would not be surprising that part of the voids would be sealed off from solvent infiltration.
To calculate the void volume inaccessible to solvent we can rewrite eqn 6 as:
| (7) |
where the total void volume is partitioned into inaccessible and accessible voids. From this expression we calculate a 9% unfillable void space located in the silica wall space giving the silica wall a ~35% porosity.
Figure 5d shows the results of solvent infiltrations into the 250 °C heat treated siPCCA where some, but not all, of the polymer was removed. The diffraction spectrum in air is broad and not symmetric and shows shoulders on both sides indicating a relatively inhomogeneous siPCCA, in contrast to that of the Fig. 5a 450 °C heat treated siPCCA. Infiltration of methanol results in a very complex bandshape indicating a variable accessibility into this siPCCA. In contrast, the bandshapes of the ethanol, isopropanol and water infiltrations are more symmetric which indicates a chemical selectivity for solvent accessibility in the presence of organic polymers. Peculiarly, the largest red-shift in diffraction results from methanol (shoulder), which has the lowest refractive index. Obviously, there is some interesting interfacial chemical selectivity present.
Wall Spacing and Periodicity of siPCCA, Surface Morphology
The use of CCA electrostatic self-assembly enables the fabrication of fcc photonic crystal materials where the nearest neighbor spacing can be defined independently of the interparticle spacing. For inverse opal fcc crystals this allows us to independently control the fcc sphere void spacing and the wall thickness as shown in Fig. 6a and b which show two different siPCCA’s made from identical colloidal particles, but where the lattice constant is varied by changing the CCA particle number density. The decreased particle number density increases the wall thickness and the silica wall volume fraction.
Figure 6.
a. SEM of 450 °C heat treated siPCCA prepared from 186 nm diameter 18 wt% CCA (1.5×10¹⁴ particles/cm3) and b. 12 wt% CCA (9.9×10¹³ particles/cm3) CCA A smaller particle number density increases the nearest-neighbor spacing. c. Linear correlation between CCA diffraction and diffraction of 450 °C heat treated siPCCA.
Figure 6c, which demonstrates proportionality between the CCA diffraction and that of the 450 °C heat treated siPCCA demonstrates that the original template CCA determines the inverted siPCCA structure and spacing. In summary, the results above demonstrate that we have developed a simple scalable, inexpensive process to create highly ordered photonic crystal materials. We use electrostatically stabilized CCA as a template to form highly ordered siPCCA and inverse opal silica photonic crystals, where the spacing and wall thickness can be independently varied.
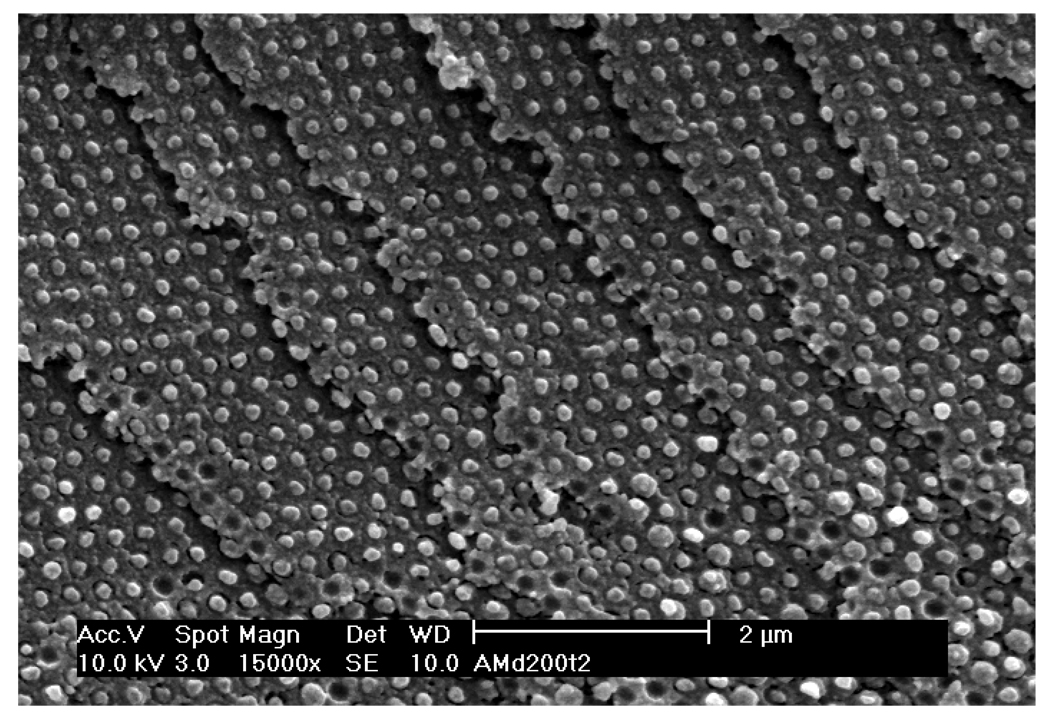
The Fig. 7 SEM of inverted siPCCA inverse opal samples at high and low particle density show clear differences in morphology of the cleaved surfaces. In contrast to the low particle density surface which has plateaus between holes, the high particle number density surface shows ridges between the originally close packed particles giving a hexagonal array of bowl shaped cavities which may prove useful for future applications.
Figure 7.
SEM measured at a 50° angle to a 450 °C heat treated cleaved siPCCA formed with a. 1.5×10¹⁴ particles/cm3 and b. 9.9×10¹³ particles/cm3 particle number densities. The high particle number density siPCCA wall morphology shows clear ridges between nearest neighbors. The siPCCA made with low particle number density show smooth plateau regions between sphere holes.
Ordering
As shown in the SEM photographs above and in Fig. 8 the siPCCA and the inverse opal photonic crystal materials are highly ordered over long ranges. Fig. 8 shows an siPCCA cleaved mainly along the 100 plane surfaces. The ordering of the SEM visually suggests high order, possibly higher than that of the more typically studied close packed photonic crystal materials made from colloidal particles with similar particle size monodispersities.
Figure 8.
SEM of cleaved cross-section of low particle density siPCCA showing exposed 100 planes.
The presumed increased ordering of the siPCCA compared to close packed photonic crystals is expected from the superior ordering of the original CCA template. The ordering of the CCA derives from soft electrostatic repulsions between colloidal particles. Because of the soft repulsive interactions, colloidal particle polydispersity should have less impact on the ordering of electrostatically stabilized CCA than would occur for hard sphere-interacting close packed systems, as shown below.
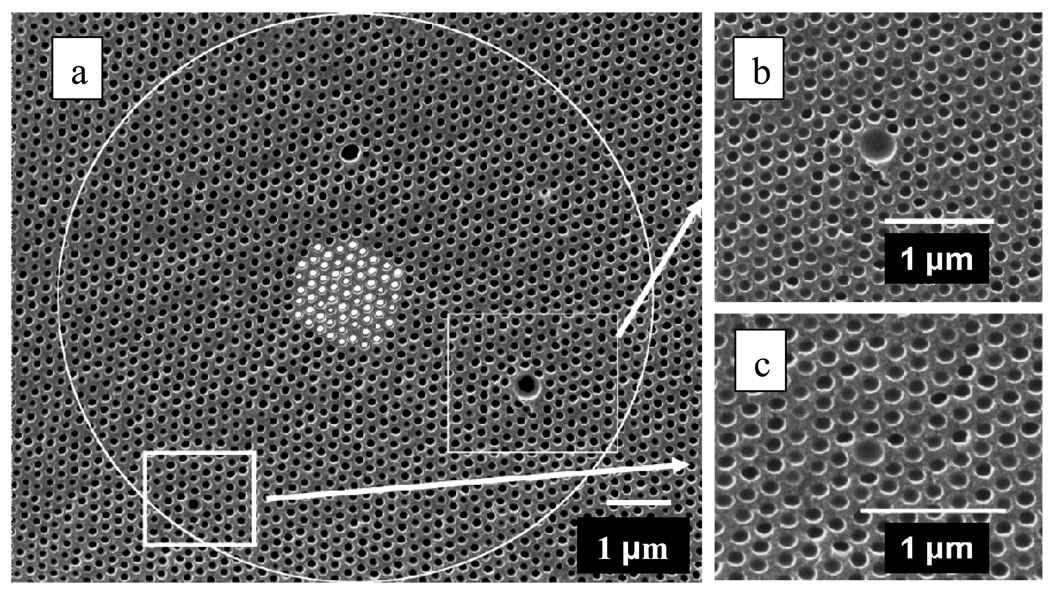
This phenomenon is evident from Fig. 9 which shows the disorder induced by the inclusions of ~4-fold and ~2-fold larger particles in the original CCA template. The deformation in the crystal lattice anneals out within approximately two particle layers, due to the CCA soft electrostatic interparticle potential.
Figure 9.
a. SEM image showing the (111) plane surface of a silica inverse opal photonic crystal which was heat treated to 450 °C. The white circle encloses the area used to calculate the pair correlation function (PCF). The small white circles at the center of the image shows the different origins used for the PCF. b. Expanded images showing impact of a 4-fold and c. 2-fold larger colloidal particles on the ordering. The strains in the periodic order of the lattice anneal over approximately two particles layers.
To quantitatively analyze the Fig. 9a ordering of our inverse opal siPCCA we calculated the two dimensional pair correlation function (PCF), g(r) of the area enclosed by the white circle
We calculated the number of spheres, dn, which lie at a radius of r from the defined origin within a circular ring of width dr. As r increases g(r) probes the long range particle ordering within the (111) plane. We repeated this calculation for multiple origins within the lattice (white colored centers). The average of the g(r) values was normalized by the average particle number density and the area of the circular ring da=2πrdr.
For well ordered crystals g(r) will be large for r values corresponding to multiples of the in-plane (111) lattice constants. In contrast, g(r) will be small for intermediate r values. Colvin et al recently showed highly ordered photonic crystal lattices generate g(r) showing many peaks over large values of r which clearly indicate good long range ordering.34
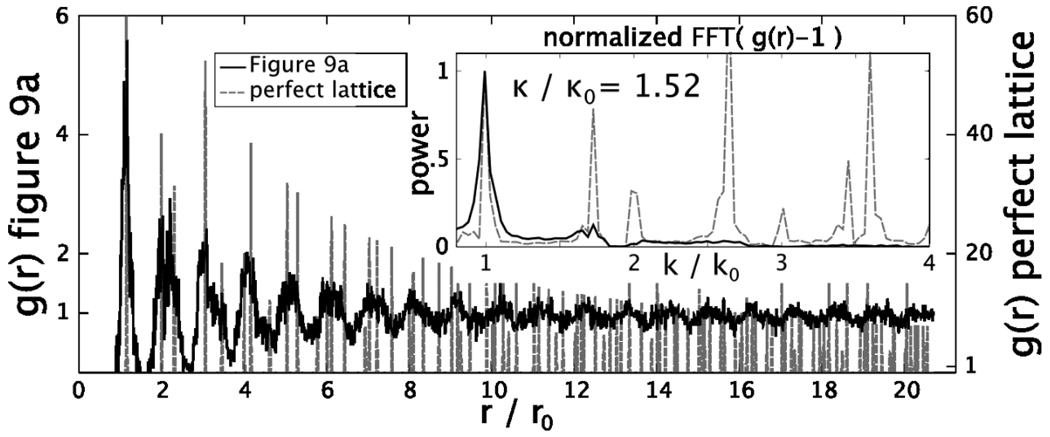
A quantitative measure of ordering is obtained from the ratio of the Full Width at Half Maximum (FWHM) of the first peak in the Fourier Transform (FT) of the function g(r)-1 of the SEM image, κ, to that of a perfect lattice, κo, with the same number of lattice points (see Fig. 10 inset). κ/ κo = 1 will occur for a perfect 2-D crystal, whereas κ/κo ≤ 1.5 suggests very highly ordered photonic crystal surfaces.34
Figure 10.
Calculated pair correlation function (PCF) from sample shown in Fig. 9a and PCF for a perfect lattice (vertical dashed lines) as a function of r/ro, where ro is the mean near neighbor center to center spacing. The inset shows the Fourier Transforms (FT) of both PCF where the dotted lines show the FT of the perfect lattice.
Fig. 10 compares g(r) for the Fig. 9a area within the white circle to g(r) of a perfect (111) plane with the same average in-plane spacing and area. g(r) shows peaks out to r/ro > 20 that coincide with those calculated for a perfect lattice, however, the g(r) siPCCA peak amplitudes are smaller indicating a decreased ordering compared to the perfect lattice. The Fig. 10 inset shows the FT of g(r)-1 for the Fig. 9 image. We calculate that κ/ κo = 1.52 demonstrating that our siPCCA is highly ordered. This high order occurs in spite of the presence of multiple point defects. This ordering which results from simple CCA self assembly favorably compares very favorably to the ordering found for convective self-assembled close-packed photonic crystals34. Rengarajan et als34 samples formed by convective self assembly of 3 to 4 % colloidal size distributions have average κ/ κo ~ 1.5, a value essentially identical to what we obtained through electrostatic self assembly of the template.
We can qualitatively understand the decreased impact of particle polydispersity on CCA ordering compared to that of close-packed particles by examining the interparticle repulsive interactions. At present the electrostatic interaction between charged particles is modeled by using DLVO theory.72 We are aware that this is only a rough approximation since it is well known that DLVO theory fails to describe particle repulsion for particles with high charge.73 Further the effective particle charge must be renormalized to significantly decrease the charge density so that DLVO theory can successfully model electrostatic interactions for real colloidal dispersions.74
The DLVO interaction potential, UDLVO(r) between particles with different sizes and charges is:
| (8) |
where Z*1 and Z*2 are the renormalized charges on two particles of radius a1 and a2. e is the fundamental electronic charge, ε is the static dielectric constant of the medium and r is the interparticle separation distance.75 The Debye length, 1/κ, is given by
| (9) |
where kB is Boltzmann’s constant, np is the particle number density and ni is the ionic impurity concentration. We presume that the system contains no added impurities, so that ni = 0. For the discussion below we assume that a 10% variation in a single particle diameter and/or single particle charge results in a negligible change in the Debye length of the system.
The discussion below assumes a nominal colloidal particle diameter of 130 nm and a renormalized charge of Z=1000. This charge renormalization corrects for extra charge screening not included in DLVO theory. We choose for discussion a CCA nearest neighbor distance of 250 nm between particles, giving a particle number density of 1.613×10¹⁴ particles/cm3. We calculate 1/κ for our system to be 10.4 nm.
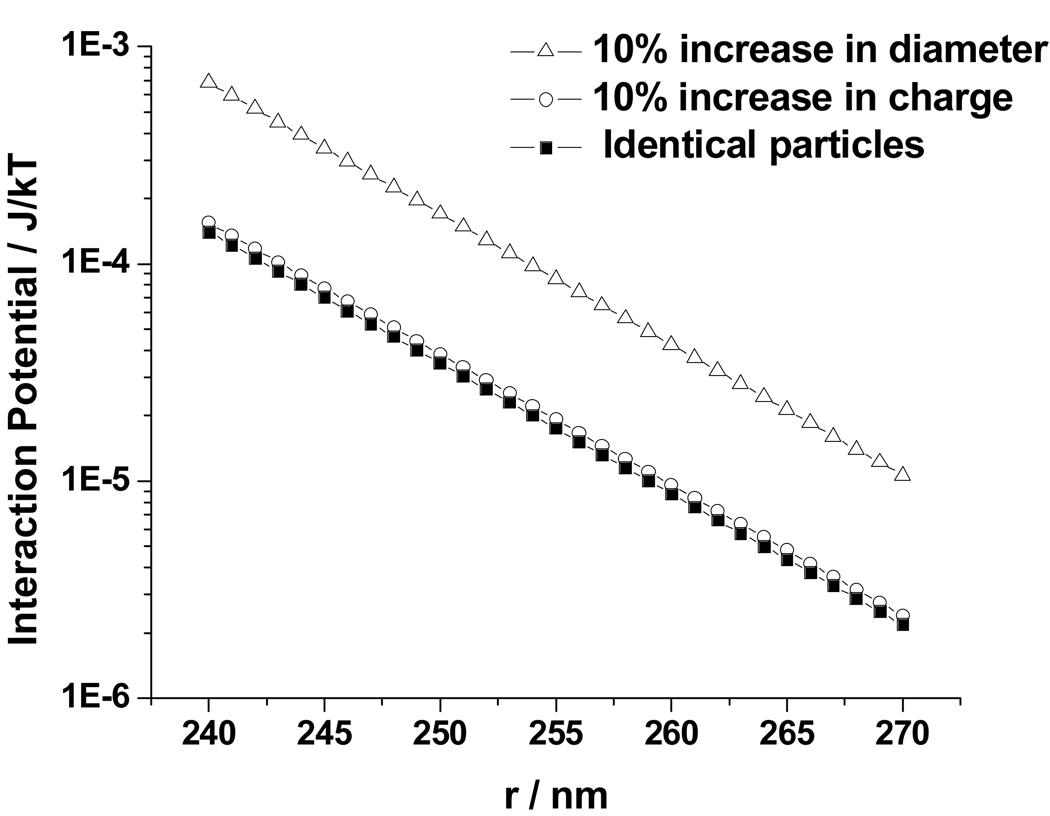
Fig. 11 shows that for this distance separation there is a negligible difference in the DLVO potential in response to a 10 % increase in particle charge. Thus, changes in particle charge must negligibly impact the CCA ordering at these nearest-neighbor distances.
Figure 11.
Dependence of UDLVO(r) upon interparticle distance between (■) two identical particles of 130 nm diameter with a renormalized charge of 1000; (○) between two identical particles of diameter 130 nm, where one particle has a renormalized charge of 1000 and the other 1100; (△) between a particle of diameter 130 nm and one 10% larger, both with a renormalized charge of 1000.
In contrast, Fig. 11 shows that DLVO theory predicts a ~10 % increase in repulsive interactions with a 10 % increase in the particle diameter. However, the potential energy difference at the same interparticle spacing of 250 nm is quite small, ~2 × 10⁻³ kBT per particle.
This soft electrostatic repulsive potential prevents defect particles from significantly impacting CCA ordering. We can roughly model the change which occurs in the interparticle spacing brought on by a single defect particle with a 10 % increased particle diameter by modeling the forces in a one dimensional array of particles that spans the characteristic photonic crystal macroscopic size (Fig. 12). We calculate the forces between particles, neglecting all but nearest neighbor interactions, from the derivative of the DLVO potential with respect to interparticle distance, r.
| (10) |
Figure 12.
Model for response of one dimensional array of N particles to a single defect particle of increased diameter. The N particles are arrayed along a cell of length L. In the top array the particle diameters are identical and the system self assembles such that the spacings between particles are identical at x = L / (N +1). In the bottom array one particle is replaced with a particle of larger diameter. The distance between the larger diameter particle and the adjacent particle is x1 = x + δ, while the distance between the other identical particles is x2 = L-2x1 / (N−1). δ is determined by the equilibrium between forces.
We assume a linear array of N particles. We compare the distance between particles for an array of N identical particles which is x= L/ (N+1). When a single particle is replaced with a defect particle having a 10% increase in diameter the particles expand around the defect particle and contract around the other particles until the forces balance. This would result in a negligible average particle spacing decrease for the other particles since this spacing difference would be distributed over the other particles in the array.
We can look at this issue more quantitatively by equilibrating the forces between particles. Equations 11 and 12 show that F(x1) defines the force between the defect particle and its nearest neighbor while F(x2) defines the force between the remaining identical particles. We assume that the length of the particle array is constant at 250 µm
| (11) |
| (12) |
which represents the smallest dimension common to our CCA films. The nearest neighbor spacing of this system before the addition of a particle defect is x = 250 nm. Therefore N = 999 particles.
Addition of a 10% increased particle diameter to the array changes the spacing between the defect and its nearest neighbor to x1 = x + δ, where δ is the added spacing gained by the equilibration of force between the defect and its nearest neighbor,
By equilibrating the forces in eqn 11 and 12 we calculate δ = 5.7 nm for a 10% increased particle size. The separation between all other particles is very small:
| (13) |
For the typical large values of N there is negligible change in the interparticle spacings x2 except exactly around the defect particle. In contrast for a close-packed system, a 10% change in particle size generates a 10 % change in local spacing which disorders the system locally over the distance that dislocations continue to disorder the system macroscopically.
Conclusions
We developed a simple, straightforward method to form non close-packed ultra-highly ordered fcc direct and inverse opal silica photonic crystals. We utilize a self assembled electrostatically stabilized crystalline colloidal array (CCA) template prepared from monodisperse, highly charged polystyrene colloidal particles. We then polymerize a hydrogel around the CCA (PCCA) and then condense silica within the PCCA to form a highly ordered siPCCA photonic crystal. Heating at 450 °C removes the organic polymer leaving the inverse opal structure.
This approach allows us to independently control the photonic crystal periodicity and size of the basis of the fcc unit cell. We select the fcc lattice constant by defining the particle number density of this electrostatically self assembled structure. Thus, we independently control the spacing between particles. The particle diameter used determines the wall spacing of the inverse opal photonic crystal and determines the shape of the photonic crystal dielectric constant modulation. This allows us to optimize the diffraction of our photonic crystal structures.
These fcc photonic crystals simply and spontaneously self assemble due to their soft electrostatic repulsion potentials. They show ordering as good or possibly better than close-packed photonic crystals formed by convective assembly. We show that colloidal particle size polydispersity has less impact on photonic crystal electrostatic ordering than occurs for ordering of close-packed crystals. Point defect induced crystal strains in electrostatically stabilized CCA anneal within ~two particle layers. We also show that charge polydispersity has only a small impact on crystal ordering and that the strains due to defect particles of different charge also anneal out over ~two particle layers.
Acknowledgements
We wish to thank the Department of Materials Science and Engineering for use of the electron microscopes. This work was supported by the National Institute of Health (Grant number: 2 R01 EB004132)
Footnotes
Publisher's Disclaimer: This is a PDF file of an unedited manuscript that has been accepted for publication. As a service to our customers we are providing this early version of the manuscript. The manuscript will undergo copyediting, typesetting, and review of the resulting proof before it is published in its final citable form. Please note that during the production process errors may be discovered which could affect the content, and all legal disclaimers that apply to the journal pertain.
References
- 1.John S. Physical Review Letters. 1987;58:2486–2489. doi: 10.1103/PhysRevLett.58.2486. [DOI] [PubMed] [Google Scholar]
- 2.Yablonovitch E. Journal de Physique, Colloque. 1987;C5:C5-615–C5-616. [Google Scholar]
- 3.Joannopoulos JD, Meade RD, Winn JN, editors. Photonic Crystals: Molding the Flow of Light. 1995:137. [Google Scholar]
- 4.Joannopoulos JD, Villeneuve PR, Fan S. Nature (London) 1997;386:143–149. [Google Scholar]
- 5.Imada M, Lee LH, Okano M, Kawashima S, Noda S. Applied Physics Letters. 2006;88:171107/1–171107/3. [Google Scholar]
- 6.Norris DJ. Nature Materials. 2007;6:177–178. doi: 10.1038/nmat1844. [DOI] [PubMed] [Google Scholar]
- 7.Takeda H, Chutinan A, John S. Physical Review B: Condensed Matter and Materials Physics. 2006;74:195116/1–195116/26. [Google Scholar]
- 8.Lopez C. Advanced Materials (Weinheim, Germany) 2003;15:1679–1704. [Google Scholar]
- 9.Arsenault A, Fournier-Bidoz S, Hatton B, Miguez H, Tetreault N, Vekris E, Wong S, San MY, Kitaev V, Ozin GA. Journal of Materials Chemistry. 2004;14:781–794. [Google Scholar]
- 10.Noda S, Tomoda K, Yamamoto N, Chutinan A. Science (Washington, D. C.) 2000;289:604–606. doi: 10.1126/science.289.5479.604. [DOI] [PubMed] [Google Scholar]
- 11.Blanco A, Chomski E, Grabtchak S, Ibisate M, John S, Leonardo SW, Lopez C, Meseguer F, Miguez H, Mondia JP, Ozin GA, Toader O, Van Driel HM. Nature (London) 2000;405:437–440. doi: 10.1038/35013024. [DOI] [PubMed] [Google Scholar]
- 12.Noda S, Fujita M, Asano T. Nature Photonics. 2007;1:449–458. [Google Scholar]
- 13.Cheng CC, Scherer A. Journal of Vacuum Science & Technology, B: Microelectronics and Nanometer Structures. 1995;13:2696–2700. [Google Scholar]
- 14.Krauss T, Song YP, Thoms S, Wilkinson CDW, DelaRue RM. Electronics Letters. 1994;30:1444–1446. [Google Scholar]
- 15.Painter O, Lee RK, Scherer A, Yariv A, O'Brien JD, Dapkus PD, Kim I. Science (Washington, D. C.) 1999;284:1819–1821. doi: 10.1126/science.284.5421.1819. [DOI] [PubMed] [Google Scholar]
- 16.Chow E, Liu SY, Johnson SG, Villeneuve PR, Joannopoulos JD, Wendt JR, Vawter GA, Zubrzycki W, Hou H, Alleman A. Nature (London) 2000;407:983–986. doi: 10.1038/35039583. [DOI] [PubMed] [Google Scholar]
- 17.Song B-S, Noda S, Asano T, Akahane Y. Nature Materials. 2005;4:207–210. [Google Scholar]
- 18.Akahane Y, Asano T, Song B-S, Noda S. Nature (London, United Kingdom) 2003;425:944–947. doi: 10.1038/nature02063. [DOI] [PubMed] [Google Scholar]
- 19.Imada M, Chutinan A, Noda S, Mochizuki M. Physical Review B: Condensed Matter and Materials Physics. 2002;65:195306/1–195306/8. [Google Scholar]
- 20.Christodoulides DN, Lederer F, Silberberg Y. Nature (London, United Kingdom) 2003;424:817–823. doi: 10.1038/nature01936. [DOI] [PubMed] [Google Scholar]
- 21.Chutinan A, John S, Toader O. Phys Rev Lett FIELD Full Journal Title:Physical review letters. 2003;90:123901. doi: 10.1103/PhysRevLett.90.123901. [DOI] [PubMed] [Google Scholar]
- 22.Sanders JV. Nature (London) 1964;204:1151–1153. [Google Scholar]
- 23.Davis KE, Russel WB, Glantschnig WJ. Journal of the Chemical Society, Faraday Transactions. 1991;87:411–424. [Google Scholar]
- 24.Miguez H, Lopez C, Meseguer F, Blanco A, Vazquez L, Mayoral R, Ocana M, Fornes V, Mifsud A. Applied Physics Letters. 1997;71:1148–1150. [Google Scholar]
- 25.Van Blaaderen A, Wiltzius P. Advanced Materials (Weinheim, Germany) 1997;9:833–835. [Google Scholar]
- 26.Jiang P, Bertone JF, Hwang KS, Colvin VB. Chemistry of Materials. 1999;11:2132–2140. [Google Scholar]
- 27.Vlasov YA, Bo XZ, Sturm JC, Norris DJ. Nature FIELD Full Journal Title:Nature. 2001;414:289–293. doi: 10.1038/35104529. [DOI] [PubMed] [Google Scholar]
- 28.Kitaev V, Ozin GA. Advanced Materials (Weinheim, Germany) 2003;15:75–78. [Google Scholar]
- 29.Zheng Z, Liu X, Luo Y, Cheng B, Zhang D, Meng Q, Wang Y. Applied Physics Letters. 2007;90:051910/1–051910/3. [Google Scholar]
- 30.Xia Y, Gates B, Yin Y, Lu Y. Advanced Materials (Weinheim, Germany) 2000;12:693–713. [Google Scholar]
- 31.Koh YK, Wong CC. Langmuir. 2006;22:897–900. doi: 10.1021/la052762j. [DOI] [PubMed] [Google Scholar]
- 32.Sirota EB, Ou-Yang HD, Sinha SK, Chaikin PM, Axe JD, Fujii Y. Physical Review Letters. 1989;62:1524–1527. doi: 10.1103/PhysRevLett.62.1524. [DOI] [PubMed] [Google Scholar]
- 33.Hoogenboom JP, Derks D, Vergeer P, van Blaaderen A. Journal of Chemical Physics. 2002;117:11320–11328. [Google Scholar]
- 34.Rengarajan R, Mittleman D, Rich C, Colvin V. Physical Review E: Statistical, Nonlinear, and Soft Matter Physics. 2005;71:016615/1–016615/11. doi: 10.1103/PhysRevE.71.016615. [DOI] [PubMed] [Google Scholar]
- 35.Li Z-Y, Zhang Z-Q. Physical Review B: Condensed Matter and Materials Physics. 2000;62:1516–1519. [Google Scholar]
- 36.Tikhonov A, Coalson RD, Asher Sanford A. Phys Rev B. 2007 Submitted. [Google Scholar]
- 37.Busch K, John S. Physical Review E: Statistical Physics, Plasmas, Fluids, and Related Interdisciplinary Topics. 1998;58:3896–3908. doi: 10.1103/physreve.62.4251. [DOI] [PubMed] [Google Scholar]
- 38.Graugnard E, King JS, Gaillot DP, Summers CJ. Advanced Functional Materials. 2006;16:1187–1196. [Google Scholar]
- 39.Doosje M, Hoenders BJ, Knoester J. Journal of the Optical Society of America B: Optical Physics. 2000;17:600–606. [Google Scholar]
- 40.Meseguer F, Fenollosa R. Journal of Materials Chemistry. 2005;15:4577–4580. [Google Scholar]
- 41.Meseguer F. Colloids and Surfaces, A: Physicochemical and Engineering Aspects. 2005;270–271:1–7. [Google Scholar]
- 42.Fenollosa R, Meseguer F. Advanced Materials (Weinheim, Germany) 2003;15:1282–1285. [Google Scholar]
- 43.Miguez H, Tetreault N, Yang SM, Kitaev V, Ozin GA. Advanced Materials (Weinheim, Germany) 2003;15:597–600. [Google Scholar]
- 44.King JS, Gaillot DP, Graugnard E, Summers CJ. Advanced Materials (Weinheim, Germany) 2006;18:1063–1067. [Google Scholar]
- 45.Flaugh PL, O'Donnell SE, Asher SA. Applied Spectroscopy. 1984;38:847–850. [Google Scholar]
- 46.Carlson RJ, Asher SA. Applied Spectroscopy. 1984;38:297–304. [Google Scholar]
- 47.Asher SA. US Patent # 4,627,689. 1986
- 48.Asher SA, Flaugh PL, Washinger G. Spectroscopy (Duluth, MN, United States) 1986;1:26–31. [Google Scholar]
- 49.Asher SA. US Patent # 4,632,517. 1986
- 50.Asher SA. U.S. Patent # 5,281,370. 1994
- 51.Asher SA, Holtz J, Liu L, Wu Z. Journal of the American Chemical Society. 1994;116:4997–4998. [Google Scholar]
- 52.Holtz JH, Asher SA. Nature (London) 1997;389:829–832. doi: 10.1038/39834. [DOI] [PubMed] [Google Scholar]
- 53.Reese CE, Baltusavich ME, Keim JP, Asher SA. Analytical Chemistry. 2001;73:5038–5042. doi: 10.1021/ac010667j. [DOI] [PubMed] [Google Scholar]
- 54.Sharma Anjal C, Jana T, Kesavamoorthy R, Shi L, Virji Mohamed A, Finegold David N, Asher Sanford A. Journal of the American Chemical Society. 2004;126:2971–2977. doi: 10.1021/ja038187s. [DOI] [PubMed] [Google Scholar]
- 55.Walker JP, Asher SA. Analytical Chemistry. 2005;77:1596–1600. doi: 10.1021/ac048562e. [DOI] [PubMed] [Google Scholar]
- 56.Kimble KW, Walker JP, Finegold DN, Asher SA. Analytical and Bioanalytical Chemistry. 2006;385:678–685. doi: 10.1007/s00216-006-0453-y. [DOI] [PubMed] [Google Scholar]
- 57.Xu X, Goponenko AV, Asher SA. Journal of the American Chemical Society. 2008;130:3113–3119. doi: 10.1021/ja077979+. [DOI] [PubMed] [Google Scholar]
- 58.Weissman JM, Sunkara HB, Tse AS, Asher SA. Science (Washington, D. C.) 1996;274:959–960. doi: 10.1126/science.274.5289.959. [DOI] [PubMed] [Google Scholar]
- 59.Reese CE, Mikhonin AV, Kamenjicki M, Tikhonov A, Asher SA. Journal of the American Chemical Society. 2004;126:1493–1496. doi: 10.1021/ja037118a. [DOI] [PubMed] [Google Scholar]
- 60.Xu X, Majetich SA, Asher SA. Journal of the American Chemical Society. 2002;124:13864–13868. doi: 10.1021/ja026901k. [DOI] [PubMed] [Google Scholar]
- 61.Xu X, Friedman G, Humfeld KD, Majetich SA, Asher SA. Advanced Materials (Weinheim, Germany) 2001;13:1681–1684. [Google Scholar]
- 62.Xu X, Friedman G, Humfeld KD, Majetich SA, Asher SA. Chemistry of Materials. 2002;14:1249–1256. [Google Scholar]
- 63.Maurer MK, Lednev IK, Asher SA. Advanced Functional Materials. 2005;15:1401–1406. [Google Scholar]
- 64.Pan G, Kesavamoorthy R, Asher SA. Journal of the American Chemical Society. 1998;120:6525–6530. [Google Scholar]
- 65.Pan G, Kesavamoorthy R, Asher SA. Physical Review Letters. 1997;78:3860–3863. [Google Scholar]
- 66.Asher SA. U.S. Patent # 5,452,123. 1995
- 67.Kesavamoorthy R, Super MS, Asher SA. Journal of Applied Physics. 1992;71:1116–1123. [Google Scholar]
- 68.Reese CE, Guerrero CD, Weissman JM, Lee K, Asher SA. Journal of Colloid and Interface Science. 2000;232:76–80. doi: 10.1006/jcis.2000.7190. [DOI] [PubMed] [Google Scholar]
- 69.Sen T, Tiddy GJT, Casci JL, Anderson MW. Angew. Chem., Int. Ed. FIELD Full Journal Title:Angewandte Chemie, International Edition. 2003;42:4649–4653. doi: 10.1002/anie.200351479. [DOI] [PubMed] [Google Scholar]
- 70.Dean JA, editor. Lange's Handbook of Chemistry. (11th ed.) 1973:1576. [Google Scholar]
- 71.Blanford CF, Schroden RC, Al-Daous M, Stein A. Advanced Materials (Weinheim, Germany) 2001;13:26–29. [Google Scholar]
- 72.Belloni L. Journal of Physics: Condensed Matter. 2000;12:R549–R587. [Google Scholar]
- 73.Naji A, Jungblut S, Moreira AG, Netz RR. Los Alamos National Laboratory, Preprint Archive, Condensed Matter. 2005:1–26. arXiv:cond-mat/0508767. [Google Scholar]
- 74.Alexander S, Chaikin PM, Grant P, Morales GJ, Pincus P, Hone D. Journal of Chemical Physics. 1984;80:5776–5781. [Google Scholar]
- 75.Crocker JC, Grier DG. Physical Review Letters. 1996;77:1897–1900. doi: 10.1103/PhysRevLett.77.1897. [DOI] [PubMed] [Google Scholar]


