

Abstract
Targeted therapeutic intervention in receptor-ligand interactions of p53 mediated tumor suppression can impact progression of disease, aging, and variation in genetic expression. Here, we conducted a number of molecular simulations, based on structures of p53 in complex with its transcriptional co-activating CBP bromodomain, determined by NMR spectroscopy, to investigate the energetics of the binding complex. Building on the observation that acetylation of K382 in p53 serves as the essential triggering switch for a specific interaction with CBP, we assessed the differential effect of acetylation on binding from simulations of an octapeptide derived from p53 with acetylated and non-acetylated K382 (residues 379-386). Cluster analysis of the simulations shows that acetylation of the free peptide does not significantly change the population of the preferred conformation of the peptide in solution for binding to CBP. Conversion of the acetylated K382 to non-acetylated form with Free Energy Perturbation (FEP) simulations of the p53•CBP complex and the free peptide showed that the relative contribution of the acetyl group to binding is 4.8 kcal/mol. An analysis of residue contributions to the binding energy using an MM-GBSA approach agrees with the FEP results and sheds additional light on the origin of selectivity in p53 binding to the CBP bromodomain.
Keywords: Bromodomains, Epigenetics, p53, Lysine Acetylation, Histone Modification, Binding Energy
Introduction
Characterizing the activation mechanisms of p53 tumor suppressor activity can provide insight into developing targeted intervention strategies against cancer progression. p53, often referred to as ‘the guardian of the genome’ 1, is a protein containing 393 amino acids, with functional domains responsible for cellular activities that include transcriptional activation, DNA repair, G1/S checkpoint growth regulation, initiation of apoptosis and senescence. The importance of p53 in cancer is highlighted by the fact that its altered expression is observed in over 50% of human tumors 2,3. p53 is believed to exert its influence over gene activation and silencing at the chromatin level in an epigenetic modality, using histone-directed lysine acetylation signaling pathways 4. Since p53 is active in both cell cycle regulation and tumor suppressor activity, a molecular understanding of its binding selectivity can facilitate the design of specific small molecule ligands that can bind and regulate its epigenetic activity 5.
A primary regulator of p53 stability is the p53-interacting protein MDM2 6. MDM2, whose expression is controlled through negative feedback by p53 itself, forms a complex with p53, thereby reducing tumor suppression activity in unstressed cells. For example, in murine studies, MDM2 homozygous deletion resulted in apoptosis and embryonic death; simultaneous deletion of MDM2 and p53 yielded apparently normal growth and development, but increasingly prone to tumors from lack of p53 tumor suppression 7-9. MDM2-bound p53 inhibits p53-mediated transcription by preventing p53 from contacting transcriptional coactivators such as p300 and CBP and subsequently allows for p53 export from the nucleus to the cytoplasm via the ubiquitination proteasome system 9.
Upon MDM2 dissociation from p53, the evolutionarily conserved bromodomain, an atypical left-handed four-helix bundle found in transcriptional co-activating proteins such as CBP, p300 and histone acetyltransferases, plays a unique role in its ability to bind to acetyl-lysine motifs in histones and proteins 10. By binding to acetyl-lysines and histones, bromodomains can govern the molecular interactions between proteins in histone-regulated chromatin modeling and gene transcription. Bromodomains may act by tethering nuclear histone acetyltransferases (HATs) to distinct chromosomal sites 11-13. In particular, CBP bromodomain recognition of p53•K382ac, as opposed to other lysine acetylation sites, may function as a chemical switch, which controls target transcriptional activation of cyclin-dependendent kinase inhibitor p21 in cell cycle arrest10,14,15. The ability to decrease p53-mediated p21 activation has been demonstrated experimentally 16. In this way, posttranslational modifications of p53 can mediate its signaling pathways 14.
Woods and Vousden suggested that the conformation of p53 C-terminus is potentially a critical regulator of p53 binding selectivity 9. The implication is that binding selectivity could be in part determined by the conformational properties of the p53 C-terminal peptide, i.e., the acetylated form is more likely to bind bromodomain proteins because it has the correct conformation, whereas the non-acetylated lysine does not achieve favorable binding conformation. A priori, we can argue that the binding energy is the result of two effects: 1) the energy required to adapt the peptide from its conformation(s) in solution to that in the form bound to CBP; 2) the free energy of interaction of the peptide with CBP. So far as we know there are no experimental data about the conformational states of native and acetylated p53 or peptides derived from it. Recent molecular dynamics (MD) simulations on histone peptides lead to a conclusion that post-translational changes do not affect the conformation of the peptides in a significant manner17. To evaluate the contribution of the putative conformational rearrangement of the peptide we describe our investigation of the difference in conformational properties of the acetylated and non-acetylated peptides. To assess the contribution of the acetylated form of K382 we evaluate the relative energy by a Free Energy Perturbation method in which the acetylated K382 was mutated to the non-acetylated form in solution and in complex with the CBP bromodomain. Based on similar results from Molecular Mechanics-Poisson Boltzman (Generalized Born) Surface Area (MM-PB(GB)SA) 18,19 we analyze the contributions of other residues of the p53 peptide to binding.
Methods
Molecular Systems
To study the conformational properties of the peptide proximal to the acetylated ligand site, we isolated a p53 octapeptide residue sequence (residues 379-386; Arg-His-Lys-AcLys-Leu-Met-Phe-Lys) surrounding K382 from the NMR structure (PDB id 1JSP). The terminal residues were blocked by an acetyl group on the amino terminus and by NHCH3 on the carboxy terminus. The simulations of the complex p53 with CBP bromodomain were conducted on native structure obtained from NMR in which the peptide was also truncated to the same 8 residues.
Molecular Dynamics Simulations
All simulations were performed with NAMD v2.6 20 using the CHARMM22 force field 21. The force field for the acetyl lysine residue (Kac) was made using the CHARMM22 force field. The ACE patch was used for the acetyl group in the Kac residue. The amide linkage between NZ of lysine and carbonyl carbon CY of ACE was created in the same way as acetylation at the N-terminus of amino acids. The NZ and HNZ charges used were −0.47e and 0.31e, respectively. The charge on CE was assigned to 0.06e (similar to that of CA bound to an acetyl group at the N-terminus) and the charges of HE atoms were 0.05e. The remaining charges were the same as for a standard lysine. No new bonding or van der Waals (vdW) parameters were needed.
The systems were set up at neutral pH and an ionic strength of 0.15M using Na+ and Cl- ions in the autoionize module of Visual Molecular Dynamics (VMD) program 22. The systems were solvated in a periodic box, energy minimized for 500 steps without restraints using a dielectric constant of 1.0, with a vdW cutoff of 12 Å, a switching distance of 10.0 Å and a pairlist distance cutoff of 14.0 Å. Electrostatic interactions were evaluated with the Particle Mesh Ewald method with a tolerance of 10-6. The SHAKE algorithm 23 was utilized for all bonds to hydrogens with a tolerance of 10-6. Simulations were initiated at zero temperature and heated to 300K in a single linear ramp at 10K/ps. Molecular Dynamics (MD) production runs were done at constant pressure and temperature (NPT ensemble) with Berendsen’s coupling method. The p53 complex with the CBP Bromodomain was set up with 10 Na+ and 9 Cl- ions and solvated in a periodic box 80Å*54Å*54Å containing 6440 water molecules. The octapeptide simulation included about 1800 water molecules in a rectangular simulation cell approximately 37Å*40Å*43Å. During NPT simulations the average density was 1.0117 g/cm3.
MD simulations of the octapeptide were run for 40 nanoseconds on an AppleG5 cluster at Mount Sinai School of Medicine. The simulation of the complex was run at the Texas Advanced Computing Center (TACC) for a duration of 20ns.
Conformational Analysis
The conformational analysis of the peptide trajectories was conducted with the program Simulaid 24. The evolution of the backbone torsion angles φ and ψ were displayed in dial plots 24,25 that are well suited for the characterization of the extent of sampling of these angles, as well as for the propensity of each residue toward specific conformation(s), if any (see Fig. 2). However, torsional space is ill suited for clustering of populations in linear peptides. Thus, a different approach for the characterization of the conformational ensembles was based on the two dimensional root-mean-square deviation (2D RMSD) plot – the matrix of the RMSD values calculated between each pair of conformations extracted from the trajectory after minimizing the difference by overlaying the pair of structures 26. These 2D RMSD values were used to cluster the structures of each trajectory (see Fig. 3) using a variant of the K-means clustering method. This method produces K clusters by iteratively optimizing the cluster centroids (one member of the cluster) starting from an initial set of K structures as centroids. Each structure is assigned to the cluster whose putative centroid is the nearest to it. In subsequent iterations new centroids are calculated until convergence. Since our distance measure is the RMSD obtained after optimal overlay of structure pairs, it is not amenable to deriving a meaningful average to be used as the putative centroid in the next iteration. Instead, we chose the structure, whose largest RMSD with the rest of the cluster member is the smallest, as the new centroid.
Figure 2.
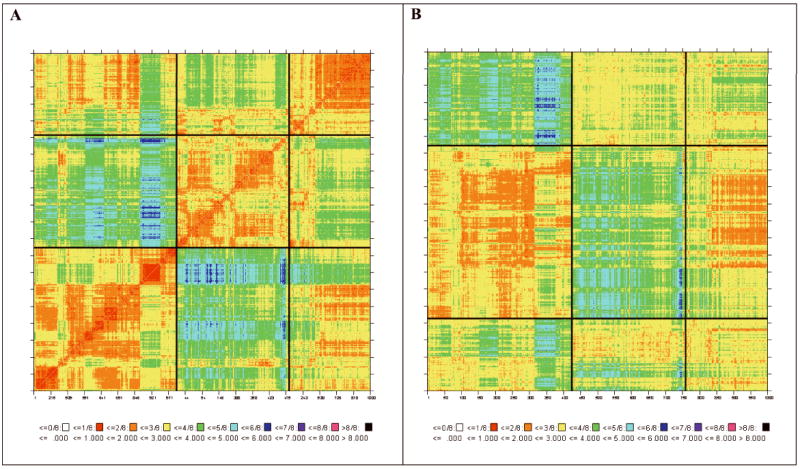
A. 2D-RMSD map of the aceytlated p53 octapeptide simulation sorted by clusters demarcated by black lines (see text for clustering methodology and populations). B. Cross-RMSD map between the simulations of octapeptides with acetylated (vertical axis) and non-acetylated lysine (horizontal axis) sorted by clusters demarcated by black lines.
Figure 3.
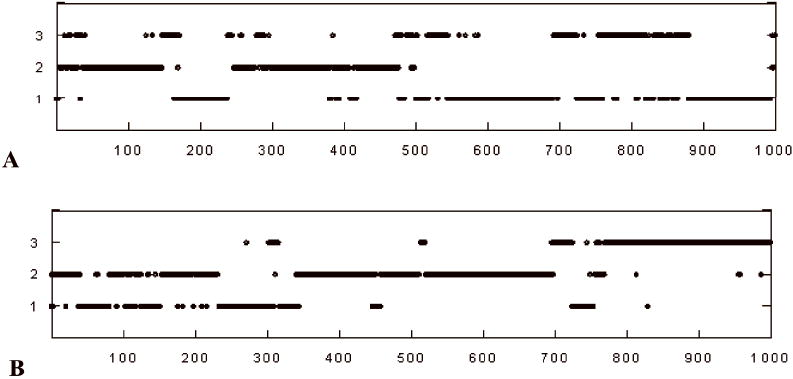
Cluster memberships and transitions as a function of time during the 40ns peptide simulation. (a) Acetyleted Lysine; (b) Non-acetylated Lysine.
The clusters obtained from the two octapeptide simulations were compared by mapping each cluster obtained from one simulation onto the clusters of the second simulation. For example, mapping cluster i2 of simulation 1 to cluster j3 of simulation 2 is equivalent to counting the number of configurations in cluster i2 whose RMSD from the center of cluster j3 is within a specified threshold value.
Free Energy Perturbation
The FEP simulations were conducted using the alchemical Free Energy Perturbation implemented in NAMD v 2.6 27. A hybrid residue A2K was constructed in a dual topology such that the acetylated nitrogen NZ of K382 (K382ac residue) was converted to a native lysine. It is noteworthy that such an alchemical change, in addition to eliminating the entire acetyl group, also creates a positive charge on the terminal NZ. Since NAMD does not allow to conduct PME simulations with a change in the total charge of the system, the simulations were conducted with a cutoff on electrostatic interactions of 12 Å. We have shown previously that the potential contributions from the unbalanced electrostatics are negligible 28. We used the recommended FEP protocol described by Henin and Chipot 27 with the following parameters. All simulations were conducted with a time step of 1 fs. The initial segments where appearance/disappearance of new atoms was taking place were run with the following λ values: {0.0000001, 0.000001, 0.00001, 0.0001, 0.001, 0.01, 0.05, 0.1}. Between 0.1 and 0.9 the change in λ was linear with dλ of 0.1. At the final segments the progression of λ was {0.9, 0.95, 0.99, 0.999, 0.9999, 0.99999, 0.999999, 0.9999999}. Each segment was equilibrated for 40 ps and MD data were accumulated for 200 ps. The total time for each FEP was 5.28 ns. The simulations were run forward, i.e., mutating Kac→K, as well as backward to estimate the error in the procedure.
Interaction Energy Decomposition
We used the method of Gohlke et al. 29,30 to decompose the interaction energy into residue-based components. In this approach the interaction energy between the p53-peptide and the CBP bromodomain was decomposed in an additive fashion according to the MM-PB(GB)SA scheme. The MM term is composed of the vdW and electrostatic interactions between each residue in the peptide and all the residues in the CBP bromodomain. Similarly, the change in solvation energy was estimated as a sum of the GB and the surface area components associated with each residue. The total MM-GBSA energy is the sum of the MM and the GBSA components. Furthermore, the residue-associated energies were decomposed into contributions from the side chain and the backbone. The entropic contributions from changes in vibrational, translational and rotational entropies cannot be decomposed into residue-based components and thus were not included in the analysis. All constituent contributions represent averages from evenly spaced 100 configurations extracted from the MD trajectories.
Inter-Residue Contact Analysis
The time course of three different types of contacts were extracted from the simulation trajectories: (a) salt bridges, defined as oppositely charged heavy atoms within 5.0 Ǻ, (b) hydrophobic interactions, defined as two aliphatic carbons within 4.0 Ǻ, and (c) hydrogen bonds, defined as a donor with a non-aliphatic hydrogen and acceptor pair satisfying the following conditions: (1) the Donor – Acceptor distance square is less than 1.4*R2vdW where RvdW is 1.68 for nitrogen and oxygen and 1.8 for sulphur; (2) the Acceptor…H-Donor angle is greater than 90°. The time course of each type of contact was condensed into residue:residue interaction map where for each residue pair the fraction of time they were in contact was determined. The analysis was performed with the program Simulaid.
Results and Discussion
Conformational Properties of Acetylated and Non-Acetylated p53 Octapeptide
In order to determine whether differences in conformational propensity of the unbound peptide contribute to the preferential binding of the acetylated peptide the conformations sampled during the simulations of the two peptides were compared at two levels. At the level of the backbone conformations we computed dial plots 31 for each ϕ and ψ angle spanning the octapeptide, using Simulaid. These radial plots depict the values of the ϕ or ψ angle as a function of time in the simulation along the radial direction outward from the center and each concentric circle of increasing radius represents 4ns of simulation time. The azimuthal coordinate represents the value of the angle. Figures 1a and 1b show the dial plots for the acetylated and non-acetylated octapeptide simulations (S1 and S2), respectively. The radial plots show that the distributions of the ϕ angles were mostly unimodal with the averages positioned around -90°. The ψ angles show usually two populations near 60° and 150° with varying occupancies. The fluctuations in the angles suggest that sampling was extensive. A closer examination of the distributions shows that upon removing the acetyl group on K382 the main changes in populations occur at ψ2, ψ4 and ψ5. However, because changes in some of the angles appear to be correlated with others we decided to characterize the ensembles by clustering the populations according to the RMSD between the structures in the simulation.
Figure 1.
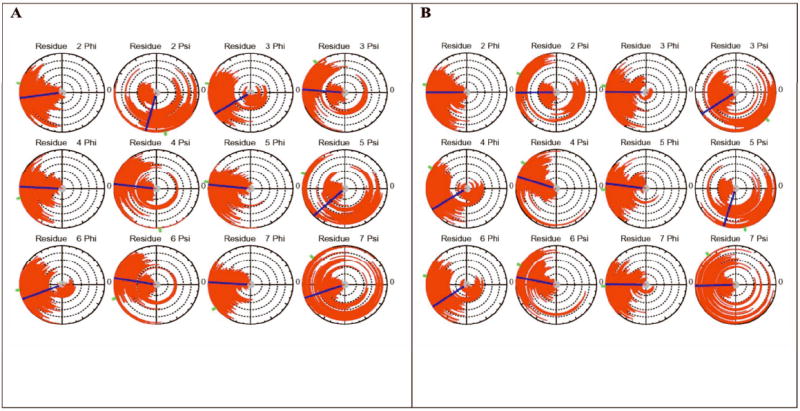
Radial dial plots for each {ϕ, ψ} angle spanning the p53 octapeptide. Each concentric circle extending outward from the center represents 4.0 ns and the angle is tracked by the red line extending outward from the center. The line in the small central gray disc shows the initial value of the angle, the blue line indicates the average angle calculated over the course of the trajectory and the green tick mark outside the dial shows the final value of the angle. (A) Acetylated Lysine; (B) Non-acetylated Lysine.
Examination of the 2D-RMSD plots for simulations S1 and S2 suggested that both simulations sampled three clusters at RMSD of 2.5Å. The 2D-RMSD plot for simulation S1 is shown in Figure 2, in which the structures are sorted by cluster membership and the different clusters are delineated by a black line. The cluster membership as a function of simulation time is shown in Figures 3a and 3b for simulations S1 and S2, respectively. Both simulations show extensive crossings among the clusters, suggesting reasonably adequate sampling. To corroborate this conclusion we divided the trajectory of the acetylated p53 into two segments of 20 ns each and compared their cluster membership using a cross-RMSD analysis. Each trajectory was clustered into three clusters, which contained 96, 177 and 227 members from the first half of the trajectory and 183, 200 and 117 in the second half. A comparison of cross membership shows that all the members of cluster 2 from the second half belong to cluster two of the first half. Thus, the change in population is from 177 in the first segment to 200 in the second. Similar results apply to the non-acetylated peptide (207 members out of 214 of the second half coincide with a cluster counting 144 members in the first half). These data indicate that sampling is reasonable and relatively stable during the simulations, although demonstrating convergence would require a much more extensive analysis.
To relate the conformations of the K382ac-octapeptide sampled during the simulation to the structures predicted by NMR, the 20 structures NMR of the NMR ensemble were combined into a pseudo trajectory, and the cross-RMSD’s were calculated between simulation S1 and the NMR ensemble. The three clusters of simulation S1 were mapped (using a 3 Å RMSD threshold) on the NMR ensemble that was considered to form a single cluster. While 76% of cluster 1 mapped on the NMR ensemble, only 33% and 37% of clusters 2 and 3, respectively, mapped on the NMR ensemble, suggesting that cluster 1 is the most NMR-like. Overall, using the 3 Å RMSD threshold, 52% of the structures in simulation S1 were mapped on the NMR ensemble.
The calculated cross-RMSD map, using the cluster-sorted order of snapshots, is depicted in Figure 2, which shows that the two largest clusters (cluster 1 of S1 and cluster 2 of S2) have the largest overlap. The centroid structures of the three ensembles, i.e., structure 728 from S1, structure 606 from S2 and structure 10 from the NMR ensemble were superimposed and are shown in Figure 4. The similarity among the clusters of the two simulations is shown in Table I, confirming the close correspondence between cluster 2 of S1 and cluster 1 of S2. For example, 438 structures of the 509 members of cluster 3 of simulation S2 are classified as belonging to cluster 1 of simulation S1, which contains 424 structures. These numbers can be related to the free-energy difference between the ensembles represented by the clusters via the equation ΔG = -RT ln(Pi/Pj) where the ratio Pi/Pj represents the relative probability of finding the peptide in conformations corresponding to cluster i and j. Since both trajectories consisted of the same number of structures, Pi/Pj can be approximated by Ni/Nj, where Ni and Nj are the number of structures in clusters i and j, respectively, leading to the approximation ΔG = -RT ln(Ni/Nj) = -0.02 kcal/mol. Even if all the members of simulation S2 that can be classified to cluster 1 of S1 are counted (i.e., 516) the free energy difference remains only -0.1 kcal/mol in favor of the K382-p53 structure. It is of interest to note that the largest cluster in each simulation is the one most similar both to each other and to the NMR ensemble. This result clearly indicates that the conformational differences between the acetylated and non-acetylated p53 do not contribute to the binding to CBP bromodomain. We conclude that the preferential binding depends on the interaction of the K382ac with its binding site.
Figure 4.
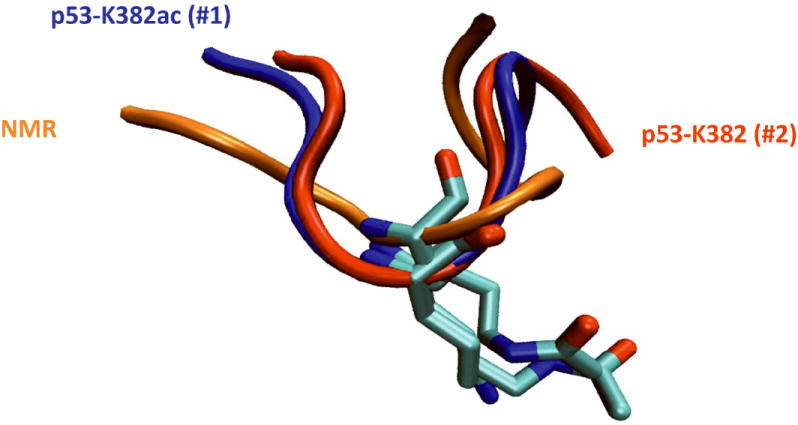
Superposition of structures from the centroids of the clusters on the NMR structures (orange backbone), K382ac-octapeptide (blue backbone) and the K382-octapeptide (red backbone).
Table I.
Characterization of similarity between clusters of the configurational ensembles of acetylated and non-acetylated p53.
| Cluster members in K382-p53a | Cluster 1 | Cluster 2 | Cluster 3 | |
|---|---|---|---|---|
| Cluster members in K382ac-p53b |  |
424 | 334 | 242 |
| Cluster 1 | 214 | 78c | 47 | 89 |
| Cluster 2 | 509 | 438 | 0 | 71 |
| Cluster 3 | 277 | 0 | 155 | 122 |
Number of members in the clusters of the p53•K382 in column;
Number of members in the clusters of the p53•K382ac in row;
Italicized numbers represent the number of members in clusters of p53•K382 that are classified to belong in clusters of p53•K382ac.
Contribution of the Acetyl Group to p53 Binding from FEP Simulations
To test the importance of the acetyl group on K382 for p53 binding to the CBP bromodomain we conducted FEP simulations in which the acetyl-lysine was converted to lysine in two separate simulations. In one the conversion took place in the p53 octapeptide in solution and in the other in a complex with the CBP bromodomain. The FEP simulations were conducted in both directions, i.e., from K382ac to K382 (forward) and from K382 to K382ac (reverse). The results in Figure 5 show that the forward and reverse simulations produce consistent results with relatively small hysteresis. Clearly, the conversion in the peptide is less costly than in the complex with CBP, indicating that the acetyl group makes a substantial contribution to binding. Binding of the acetylated p53 peptide is preferred by 4.8 ± 0.5 kcal/mol over the non-acetylated peptide. The electrostatic and van der Waals interaction make nearly equal contributions to the free energy difference. It is more costly to convert a neutral acetyl group to a charged lysine in the complex than in solution, which may originate from the largely hydrophobic nature of the binding pocket. In addition, the elimination of the acetyl group contributes to a loss of vdW interactions. While the exact values of the relative contribution of these interactions may depend on the specific details of the perturbation path, their values clearly are consistent with the nature of the interactions between the acetyl group and its binding pocket 10. To illustrate the nature of the interactions between the acetylated and non-acetylated lysine, snapshots from the simulations with λ near 1 or 0 are shown in Figure 6.
Figure 5.
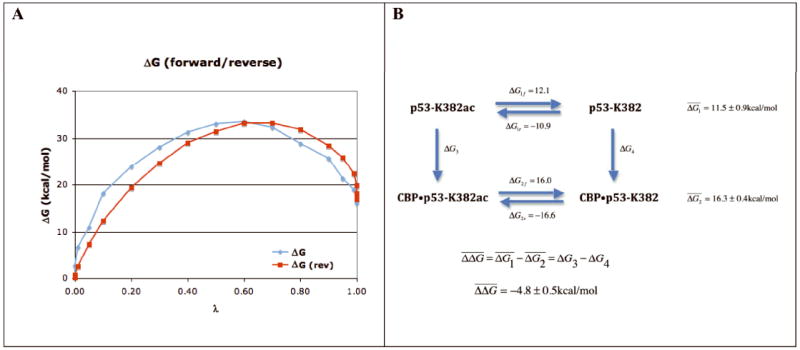
A. Free energy change as a function of λ in the forward and reverse directions. The curve in the reverse direction was shifted to align the values at λ=0. B. Thermodynamic cycle representing the conversion of K382ac to K382 in the peptide and in complex with CBP. and the errors are estimated from forward and reverse simulations.
Figure 6.
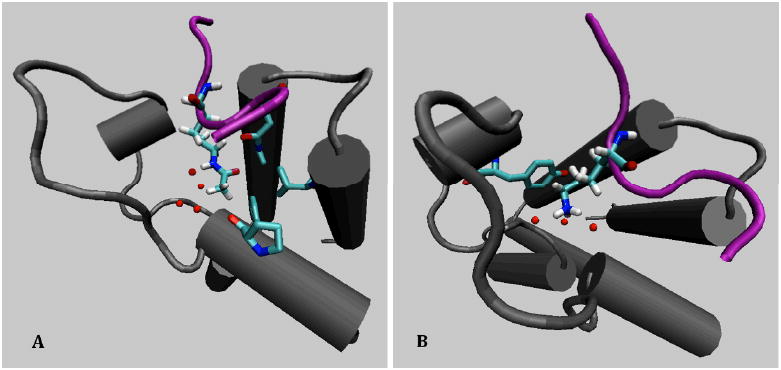
Snapshots from the FEP simulation showing the neighborhoods of K382ac and K382. A. Snapshot at λ near 1 showing the residues proximal to K382ac as well as the water molecules near the CH3 and N-H groups. B. Snapshot at λ near 0 showing the residues proximal to K382 as well as three water molecules H-bonded to the terminal ammonium group.
Experimental confirmation for the predicted change in affinity may be difficult to obtain from direct experiments. Estimated affinity of the K382ac p53 octapeptide is 187 ± 23 μM 11, which would result with an affinity of the non-acetylated peptide around 600 mM. The polybromo-1-bromodomains bind acetylated histone H3 with considerably higher affinity 32. For example, the dissociation constants of K4ac, K9ac and K14ac of H3 from various bromodomains of the polybromo are 0.39, 0.36 and 0.79 μM 32. The authors estimated that the non-acetylated peptides bind with a mM dissociation constant, which is difficult to measure. The difference in binding free energy between the acetylated and non-acetylated peptides translates into a range of 4.3 – 4.9 kcal/mol, which is in excellent agreement with our FEP results.
Interactions and H-bonding between K382ac p53 and CBP bromodomain
We have examined the behavior of the various interactions within and between the molecules of the complex of p53 with CBP as a function of simulation time. The time course of the salt bridges between p53 and CBP shows a strong interaction between the first arginine residue in the peptide (R379) and D1124 in CBP, which persists for over 90% of the time. The C-terminal lysine in the octapeptide (K386) has a persistent interaction with E1105 in CBP (~80%) and an intermittent interaction with D1107 (~10%). No salt bridges were found between atoms from p53 and K381, the position directly preceding K382. No salt bridge is observed since there is a frequent hydrogen bonding interaction with H380. Additional hydrogen bonds between p53 and CBP are maintained throughout the simulations. Two are between K382ac in the peptide and key residues Y1167 and N1168 in the CBP bromodomain. An interesting hydrogen bond is formed for about 60% between the side chain OH of S1172 and the backbone carbonyl of L383 in the peptide.
Figure 7 shows the track of hydrogen bonds formed by p53 in the last 10 ns of the simulation of the complex as a function of time. The hydrogen bonds are numbered sequentially as they are formed in the course of the simulation. For example, Y1167 and N1168 in CBP form H-bonds with K382ac from the beginning and they persist throughout the simulation. On the other hand K381, which was not engaged in a salt bridge despite its charge, is shown to form two hydrogen bonds with the H380 of p53, which are intermittently broken and reformed. The hydrogen bonds corresponding to each track and their percent populations are described in Table I of the Supplementary Materials. As the order of hydrogen bonds in this plot (Figure 6) is the order they first formed during the simulation, the envelope of the marks for the hydrogen bond should level off for a well-converged simulation. This is indeed the case.
Figure 7.
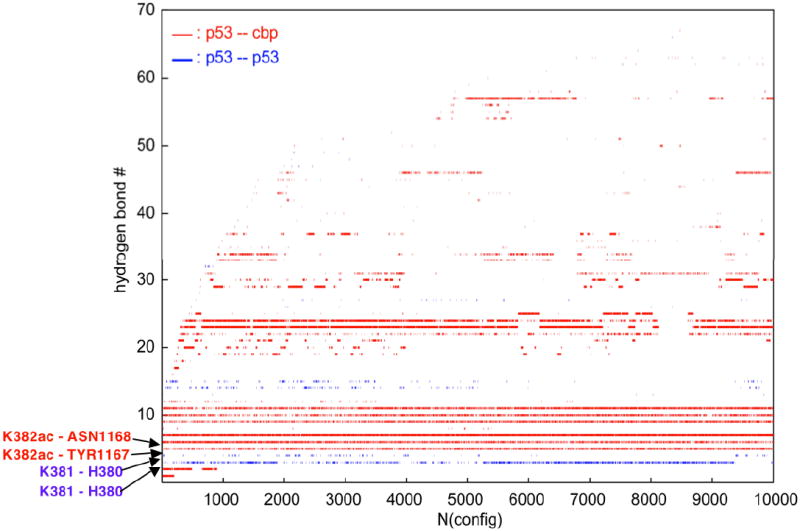
Plot of the time evolution of hydrogen bonds in the p53•CBP complex. Each line represents a particular hydrogen bond – see Table I of the Supplementary Materials for the specification of each hydrogen bond. Breaks in a line represent a breakage of the hydrogen bond in that interval. Blue lines represent hydrogen bonds between atoms in p53 and red lines represent bonds between p53 and CBP.
The extent of hydrophobic contacts between residues shows mainly two interactions of interest between the side chain of K382ac and Y1167 and V1174 in CBP. Their interactions persist for about 60 – 80%, while about half of the contacts appear less that 20% of the time, showing the extent of flexibility in the p53•CBP interaction.
Energetics of p53-K382ac CBP Bromodomain interactions
To gain a better understanding of the origin of the energy of interaction between the K382ac and the binding pocket in CBP bromodomain we conducted a MM-GBSA decomposition of the interaction energies. In addition to the energetic components of K382ac we also present the contributions from the other residues of p53 in Table II and those from selected residues of CBP bromodomain in Table 3.
Table II.
Decomposition of energetic contributions (in kcal/mol) by residues of the p53•K382ac peptide
| Side Chain | Backbone | Total | vdW | ELE | GBSOL | |
|---|---|---|---|---|---|---|
| R379 | -5.7±1.6 | -0.5±0.8 | -5.2±1.8 | -0.2 | -53.6 | 48.7 |
| H380 | -1.2±0.8 | 0.2±0.7 | -1.0±1.2 | -3.7 | -2.0 | 4.8 |
| K381 | -0.5±0.7 | -1.7±0.5 | -2.2±0.8 | -5.0 | 0.4 | 2.4 |
| K382ac | -5.3±1.1 | -2.6±0.6 | -7.9±1.2 | -10.8 | -11.9 | 14.8 |
| L383 | -3.2±0.7 | -2.3±0.6 | -5.5±1.0 | -4.5 | -6.2 | 5.2 |
| M384 | -1.8±0.4 | -1.1±0.5 | -2.9±0.6 | -3.6 | -7.4 | 8.1 |
| F385 | -0.7±0.3 | 0.4±0.6 | -0.3±0.7 | -2.5 | -3.8 | 5.9 |
| K386 | -2.1±1.4 | -0.7±0.5 | -2.8±1.5 | -2.7 | -41.7 | 41.6 |
Table III.
Decomposition of energetic contributions (in kcal/mol) from selected residues of the CBP bromodomain
| Side Chain | Backbone | Total | |
|---|---|---|---|
| L1109 | -0.9±0.5 | -0.5±0.5 | -1.4±0.9 |
| P1110 | -0.9±0.3 | -0.4±0.1 | -1.3±0.3 |
| V1115 | -1.3±0.5 | -0.2±0.1 | -1.5±0.5 |
| L1120 | -1.2±0.5 | 0.0±0.3 | -1.2±0.7 |
| G1121 | 0.0±0.0 | -1.1±0.7 | -1.1±0.7 |
| I1122 | -1.9±0.6 | -0.4±0.3 | -2.3±0.7 |
| P1123 | -0.9±0.4 | -0.7±0.2 | -1.6±0.5 |
| D1124 | -2.3±1.1 | -0.2±0.1 | -2.5±1.2 |
| Y1167 | -1.1±0.4 | -1.3±0.5 | -2.4±0.6 |
| N1168 | -2.4±0.7 | -0.5±0.5 | -2.9±0.8 |
| S1172 | 0.2±0.7 | -1.8±0.4 | -1.6±0.8 |
| R1173 | -0.6±0.5 | -1.9±0.3 | -2.5±0.6 |
| V1174 | -2.0±0.7 | -0.8±0.3 | -2.8±0.8 |
The results in Table II show that K382ac makes the largest contribution to the interaction energy. The contribution originates from a balance between nearly equal parts from favorable vdW and electrostatic interactions and an unfavorable desolvation of the residue. The total interaction energy of -7.9 kcal/mol comes from a major contribution from the side chain of -5.3 kcal/mol and a smaller portion from the backbone of -2.6 kcal/mol. Interestingly, the contribution from the side chain is very similar to the results obtained from the FEP calculations in which the acetylated lysine was converted to lysine, suggesting that most of the interaction between the side chain and the acetyl-lysine binding pocket originated from the acetyl group. Among the other residues of the p53, Leu-383 makes a large contribution followed by M384 and K381. These contributions are generally in good agreement with the mutational studies of Mujtaba et al. 10. For example, the authors showed that the acetylated p53 at K382 competes against a biotinylated peptide immobilized on streptavidine-agarose beads whereas the non-acetylated peptide failed to do so. Furthermore, mutating F or M in the p53 AcK382 peptide weakened its binding to the bromodomain, whereas change of H, K or L caused a nearly complete loss of bromodomain binding. However, it is important to note that since most of the energy of interaction in K381 and L383 comes from the backbone, it appears that the mutated peptides may be binding to CBP bromodomain in a different mode. R379 also makes a large contribution, but the effect of its mutation has not been reported 10.
Table III summarizes the contributions from selected residues in the CBP bromodomain. The results in the table are consistent with mutational experiments 10, e.g., see Y1167, N1168 and V1115. Most of the residues make larger contributions through their side chains, except Y1167, S1172 and R1173, whose interaction energy comes from the backbone. Although the side chain and backbone of Y1167 contribute nearly equally to the total interaction energy, the major effect of mutating this residue might suggest that in addition to the loss of interaction with the aromatic ring, substantial conformational changes occur in the backbone as well.
Neither the previous analysis nor the mutational experiments provide a specific explanation for the importance of some of the residues whose mutation causes major changes in binding and biological activity. The MM-GBSA analysis can provide a pairwise decomposition of the interaction energy including the changes in solvation of the specific residues upon complex formation. We conducted such an analysis and present the results in Figure 8 for interactions that exceed ~1 kcal/mol (for specific details see Table II in Supplementary Material). The results in Figure 7 clearly show that the K382ac has many interactions with almost all the residues that are proximal to the peptide. The major interactions are with Y1167 and N1168 and while both residues contribute about the same amount in vdW interactions (-1.2 kcal/mol and -1.5 kcal/mol, respectively), the electrostatic interaction with N1168 is -3.7 kcal/mol mostly from the side chain vs. -1.4 kcal/mol with Y1167 mostly coming from the backbone. Other important interactions are with hydrophobic residues – P1110, V1115, I1122, P1132, M1133 and A1164 and they make major contributions through vdW interactions. Q1118 makes a major contribution through electrostatic interactions, which come mostly from the backbone.
Figure 8.
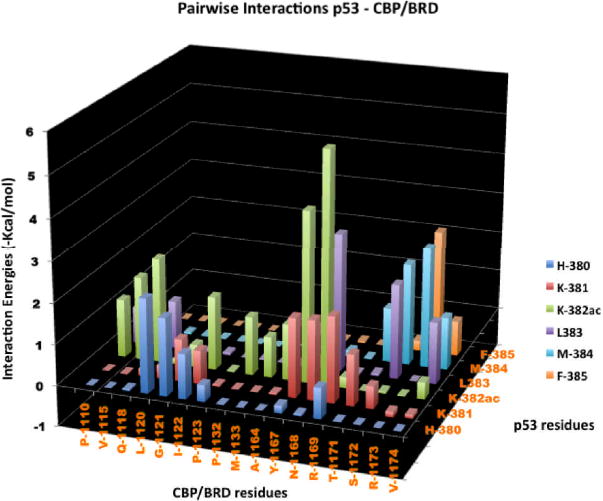
Pairwise interactions between p53 and CBP bromodomain. K382ac is observed to interact with almost all residues proximal to the peptide. Notably, we observed interactions with Y1167 (at the backbone), and N1168 (at the side chain). Hydrophobic residues (P1110, V1115, I1122, P1132, M1133 and A1164) have significant contributions through van der Waals interactions, while Q1118 has contribution through backbone electrostatic interactions. Calculating specific pairwise interactions can guide the design of specific small molecules with improved affinity and selectivity.
The arrangement of the p53 peptide in the binding groove determines the interaction pattern with the flanking residues around K382ac. H380 interacts with residues in the ZA loop mostly through van der Waals interactions whereas L383, M384 and F385 interact with the BC loop. These are mostly interactions between the p53 peptide backbone and the side chains of N1168 and R1173. Since the inclusion of entropic effects due to the binding cannot be easily partitioned among the residues of the peptide and the complex, we want to emphasize that such an analysis provides a qualitative description of the relative contributions of various residues to the interaction between the K382ac p53 peptide and the CBP bromodomain. Nevertheless, it is clear that the K382ac plays a major role in this interaction.
Conclusion
The combination of molecular dynamics simulations with structural and biochemical analysis is a powerful approach to the characterization of specific molecular processes that play an important role in cell-signal modulations. We have demonstrated in this work that the conformational flexibility in the acetylated and non-acetylated p53 peptide does not contribute to the preferential binding of the acetylated form. Adopting the simple approach of conformational selection of the preferred conformation we showed that the two peptides demonstrate a negligible conformational free energy difference. Since the population of the preferred conformation is of the order of 40 – 50%, and the sampling of the peptide conformational space in the 40 ns simulations appears to be rather extensive, it is reasonable to assume that inducing a conformational change to increase the bound population will not contribute substantially to the differential energy of binding. These studies clearly focus on the importance of the acetylated lysine as a group with a major contribution to binding.
Our Free Energy Perturbation simulations confirm this conclusion: the contribution of the acetyl group amounts to 4.8 kcal/mol, which is a major portion of the binding energy of the peptide. As noted previously the contributions come from a preferred set of favorable van der Waals interactions. The unfavorable electrostatics originates both from a set of repulsions and a larger cost of desolvation of the non-acetylated group.
The decomposition of the interaction energies into residue-based contributions shows very good agreement with mutational experiments. Interestingly, the contributions from the side chain of the K382ac are similar to those obtained in FEP calculations. Furthermore, this analysis points to the relative role of the flanking residues in the peptide as well as of those in the CBP bromodomain. These conclusions are in line with the observations from mutational experiments and they corroborate the conclusions drawn from the structural studies. The pairwise decomposition, however, offers additional information, which may be difficult to obtain from simple mutational experiments. Such an analysis explicitly pairs the interactions between residues in the peptide with those in the CBP bromodomain presenting an opportunity to observe the affinity modulation of other peptides with a different sequence and interpret the observed changes. Lastly, the understanding of the physical forces behind the specific pairwise interactions can guide the design of specific small molecules with improved affinity and selectivity. The ability of such small molecules to potentially alter the binding and biological activity of bromodomains may ultimately bring us closer to the concept of designing efficient synthetic chemical switches for use in dedicated therapeutic intervention.
Supplementary Material
Acknowledgments
This work was supported by an allocation through the TeraGrid Advanced Support Program and through the Mount Sinai Computational Biology facility; and in part by an Alpha Omega Alpha Carolyn L. Kuckein Student Research Fellowship to K.D.E.; and in part by the National Institutes of Health grant numbers CA80058 and HG04508 to Ming-Ming.Zhou.
References
- 1.Strachan T, Read AP, editors. Anonymous. Human molecular genetics. New York; Oxford: Wiley-Liss; BIOS Scientific Publishers; 1999. p. 576. [Google Scholar]
- 2.Levine AJ. p53, the cellular gatekeeper for growth and division. Cell. 1997;88(3):323–331. doi: 10.1016/s0092-8674(00)81871-1. [DOI] [PubMed] [Google Scholar]
- 3.Kern SE, Kinzler KW, Bruskin A, Jarosz D, Friedman P, Prives C, Vogelstein B. Identification of p53 as a sequence-specific DNA-binding protein. Science. 1991;252(5013):1708–1711. doi: 10.1126/science.2047879. [DOI] [PubMed] [Google Scholar]
- 4.Jackson-Grusby L, Beard C, Possemato R, Tudor M, Fambrough D, Csankovszki G, Dausman J, Lee P, Wilson C, Lander E, Jaenisch R. Loss of genomic methylation causes p53-dependent apoptosis and epigenetic deregulation. Nat Genet. 2001;27(1):31–39. doi: 10.1038/83730. [DOI] [PubMed] [Google Scholar]
- 5.Arkin MR, Wells JA. Small-Molecule Inhibitors of Protein-Protein Interactions: Progressing Towards the Dream. Nature Reviews Drug Discovery. 2004;3(4):301–317. doi: 10.1038/nrd1343. [DOI] [PubMed] [Google Scholar]
- 6.Lohrum MA, Vousden KH. Regulation and activation of p53 and its family members. Cell Death Differ. 1999;6(12):1162–1168. doi: 10.1038/sj.cdd.4400625. [DOI] [PubMed] [Google Scholar]
- 7.Rodriguez MS, Desterro JM, Lain S, Lane DP, Hay RT. Multiple C-terminal lysine residues target p53 for ubiquitin-proteasome-mediated degradation. Mol Cell Biol. 2000;20(22):8458–8467. doi: 10.1128/mcb.20.22.8458-8467.2000. [DOI] [PMC free article] [PubMed] [Google Scholar]
- 8.Geyer RK, Yu ZK, Maki CG. The MDM2 RING-finger domain is required to promote p53 nuclear export. Nat Cell Biol. 2000;2(9):569–573. doi: 10.1038/35023507. [DOI] [PubMed] [Google Scholar]
- 9.Woods DB, Vousden KH. Regulation of p53 function. Exp Cell Res. 2001;264(1):56–66. doi: 10.1006/excr.2000.5141. [DOI] [PubMed] [Google Scholar]
- 10.Mujtaba S, Zeng L, Zhou MM. Structure and acetyl-lysine recognition of the bromodomain. Oncogene. 2007;26(37):5521–5527. doi: 10.1038/sj.onc.1210618. [DOI] [PubMed] [Google Scholar]
- 11.Zeng L, Zhang Q, Gerona-Navarro G, Moshkina N, Zhou MM. Structural basis of site-specific histone recognition by the bromodomains of human coactivators PCAF and CBP/p300. Structure. 2008;16(4):643–652. doi: 10.1016/j.str.2008.01.010. [DOI] [PMC free article] [PubMed] [Google Scholar]
- 12.Manning ET, Ikehara T, Ito T, Kadonaga JT, Kraus WL. p300 forms a stable, template-committed complex with chromatin: role for the bromodomain. Mol Cell Biol. 2001;21(12):3876–3887. doi: 10.1128/MCB.21.12.3876-3887.2001. [DOI] [PMC free article] [PubMed] [Google Scholar]
- 13.Travers A. Chromatin modification: how to put a HAT on the histones. Curr Biol. 1999;9(1):23–25. doi: 10.1016/s0960-9822(99)80037-2. [DOI] [PubMed] [Google Scholar]
- 14.Barlev NA, Liu L, Chehab NH, Mansfield K, Harris KG, Halazonetis TD, Berger SL. Acetylation of p53 activates transcription through recruitment of coactivators/histone acetyltransferases. Mol Cell. 2001;8(6):1243–1254. doi: 10.1016/s1097-2765(01)00414-2. [DOI] [PubMed] [Google Scholar]
- 15.Mujtaba S, He Y, Zeng L, Yan S, Plotnikova O, Sachchidanand, Sanchez R, Zeleznik-Le NJ, Ronai Z, Zhou MM. Structural mechanism of the bromodomain of the coactivator CBP in p53 transcriptional activation. Molecular cell. 2004;13(2):251–263. doi: 10.1016/s1097-2765(03)00528-8. [DOI] [PubMed] [Google Scholar]
- 16.Sachchidanand, Resnick-Silverman L, Yan S, Mutjaba S, Liu WJ, Zeng L, Manfredi JJ, Zhou MM. Target structure-based discovery of small molecules that block human p53 and CREB binding protein association. Chemistry & biology. 2006;13(1):81–90. doi: 10.1016/j.chembiol.2005.10.014. [DOI] [PubMed] [Google Scholar]
- 17.Liu H, Duan Y. Effects of posttranslational modifications on the structure and dynamics of histone H3 N-terminal Peptide. Biophys J. 2008;94(12):4579–4585. doi: 10.1529/biophysj.107.115824. [DOI] [PMC free article] [PubMed] [Google Scholar]
- 18.Kollman PA, Massova I, Reyes C, Kuhn B, Huo S, Chong L, Lee M, Lee T, Duan Y, Wang W, Donini O, Cieplak P, Srinivasan J, Case DA, Cheatham TE., 3rd Calculating structures and free energies of complex molecules: combining molecular mechanics and continuum models. Accounts of Chemical Research. 2000;33(12):889–897. doi: 10.1021/ar000033j. [DOI] [PubMed] [Google Scholar]
- 19.Cheatham TE, 3rd, Srinivasan J, Case DA, Kollman PA. Molecular dynamics and continuum solvent studies of the stability of polyG-polyC and polyA-polyT DNA duplexes in solution. J Biomol Struct Dyn. 1998;16(2):265–280. doi: 10.1080/07391102.1998.10508245. [DOI] [PubMed] [Google Scholar]
- 20.Phillips JC, Braun R, Wang W, Gumbart J, Tajkhorshid E, Villa E, Chipot C, Skeel RD, Kale L, Schulten K. Scalable molecular dynamics with NAMD. Journal of computational chemistry. 2005;26(16):1781–1802. doi: 10.1002/jcc.20289. [DOI] [PMC free article] [PubMed] [Google Scholar]
- 21.MacKerell AD, Jr, Banavali N, Foloppe N. Development and current status of the CHARMM force field for nucleic acids. Biopolymers. 2000;56(4):257–265. doi: 10.1002/1097-0282(2000)56:4<257::AID-BIP10029>3.0.CO;2-W. [DOI] [PubMed] [Google Scholar]
- 22.Humphrey W, Dalke A, Schulten K. VMD: visual molecular dynamics. Journal of Molecular Graphics. 1996;14(1):33–38. 27–38. doi: 10.1016/0263-7855(96)00018-5. [DOI] [PubMed] [Google Scholar]
- 23.Ryckaert JP, Ciccotti G, Berendsen HJC. Numerical integration of the cartesian equations of motion of a system with constraints: Molecular dynamics of n-alkanes. J Comput Phys. 1977;23:327–341. [Google Scholar]
- 24.Mezei M, Mezei M. Simulaid, simulation setup utilities. 2007;2006 http://atlas.physbio.mssm.edu/~mezei/simulaid/simulaid.html.
- 25.Ramachandran GN, Sasiskharan V. Conformation of polypeptides and proteins. Adv Protein Chem. 1968;23:283–437. doi: 10.1016/s0065-3233(08)60402-7. [DOI] [PubMed] [Google Scholar]
- 26.Kabsch W. A solution of the best rotation to relate two sets of vectors. Acta Crystallographica. 1976;32:922. [Google Scholar]
- 27.Hénin J, Chipot C. A tutorial for alchemical FEP in NAMD. Theoretical and Computational Biophysics Group. 2008;2008 http://www.ks.uiuc.edu/Research/namd/tutorial/fep/
- 28.Rodriguez Y, Mezei M, Osman R. The PT1-Ca(2+) Gla Domain Binds to a Membrane through Two Dipalmitoylphosphatidylserines. A Computational Study (dagger) Biochemistry. 2008 doi: 10.1021/bi801199v. [DOI] [PubMed] [Google Scholar]
- 29.Gohlke H, Case DA. Converging free energy estimates: MM-PB(GB)SA studies on the protein-protein complex Ras-Raf. J Comput Chem. 2004;25(2):238–250. doi: 10.1002/jcc.10379. [DOI] [PubMed] [Google Scholar]
- 30.Gohlke H, Kiel C, Case DA. Insights into protein-protein binding by binding free energy calculation and free energy decomposition for the Ras-Raf and Ras-RalGDS complexes. J Mol Biol. 2003;330(4):891–913. doi: 10.1016/s0022-2836(03)00610-7. [DOI] [PubMed] [Google Scholar]
- 31.Ravishanker G, Swaminathan S, Beveridge DL, Lavery R, Sklenar H. Conformational and helicoidal analysis of 30 PS of molecular dynamics on the d(CGCGAATTCGCG) double helix: “curves”, dials and windows. J Biomol Struct Dyn. 1989;6(4):669–699. doi: 10.1080/07391102.1989.10507729. [DOI] [PubMed] [Google Scholar]
- 32.Chandrasekaran R, Thompson M. Polybromo-1-bromodomains bind histone H3 at specific acetyl-lysine positions. Biochem Biophys Res Commun. 2007;355(3):661–666. doi: 10.1016/j.bbrc.2007.01.193. [DOI] [PubMed] [Google Scholar]
Associated Data
This section collects any data citations, data availability statements, or supplementary materials included in this article.