Abstract
Coherent X-ray scattering is related to the electron density distribution by a Fourier transform, and therefore a window into the microscopic structures of biological samples. Current techniques of scattering rely on small-angle measurements from highly collimated X-ray beams produced from synchrotron light sources. Imaging of the distribution of scattering provides a new contrast mechanism which is different from absorption radiography, but is a lengthy process of raster or flue scans of the beam over the object. Here, we describe an imaging technique in the spatial frequency domain capable of acquiring both the scattering and absorption distributions in a single exposure. We present first results obtained with conventional X-ray equipment. This method interposes a grid between the X-ray source and the imaged object, so that the grid-modulated image contains a primary image and a grid harmonic image. The ratio between the harmonic and primary images is shown to be a pure scattering image. It is the auto-correlation of the electron density distribution at a specific distance. We tested a number of samples at 60–200 nm autocorrelation distance, and found the scattering images to be distinct from the absorption images and reveal new features. This technique is simple to implement, and should help broaden the imaging applications of X-ray scattering.
Index Terms: Diffraction, imaging, scatter, X-ray
I. INTRODUCTION
When X-ray photons pass through an object they are primarily scattered by electrons through coherent scattering and inelastic Compton Scattering. Coherent scattering accounts for most of the small angle forward scattering [1]. Because the differential cross section of coherent scattering is related to the electron density distribution by a Fourier transform [2], scattering measurements contain microscopic structural information. An example is the observation of actin-myosin configuration in the flight muscle of a live drosophila fly using synchrotron small angle X-ray diffraction [3]. In a heterogeneous object, imaging the spatial distribution of scattering provide location-specific structural information. Scattering imaging in nonperiodic biological and material samples show features that are not visible in absorption images, and therefore provide a new contrast mechanism to X-ray imaging [4]–[7]. However, current techniques employ highly collimated X-ray beams from synchrotron light sources to measure the angular distribution of scattered light. The process also involves lengthy raster or line scans of the beam over the sample [4]–[7].
Here, we describe a different method which uses conventional X-ray equipment and obtains the scattering and absorption images in a single exposure. The idea is related to a resolution enhancement technique in optical microscopy [8], in which gratings are placed in the light path to modulate the illuminating light, which is then demodulated before image detection.
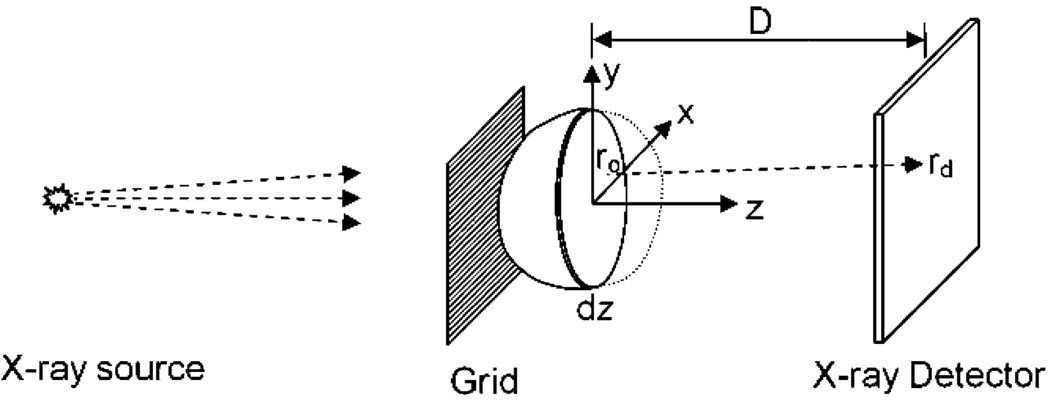
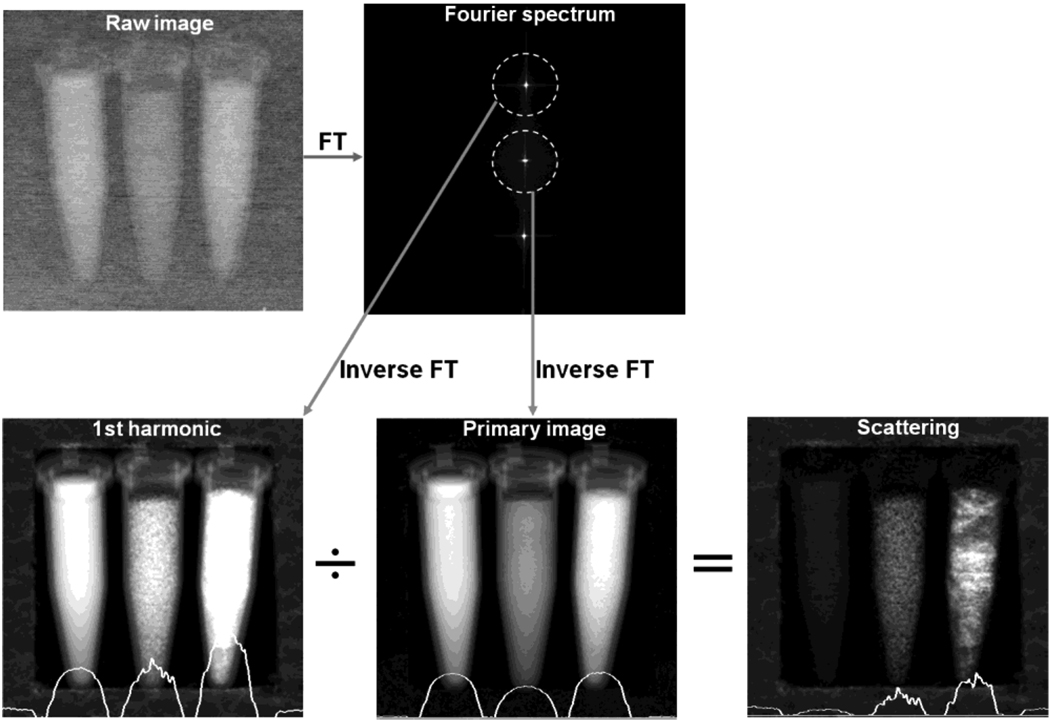
The experimental layout is shown in Fig. 1. The cone beam from an X-ray tube is masked by a grid of alternate opaque (lead) and transparent (aluminum) stripes before striking the target object. The projection image of the object is modulated by the periodic grid pattern. The Fourier spectrum of the projection image becomes the convolution of the spectrum of the grid and that of the object. As a result it contains a strong primary peak around zero spatial frequency, and at least two strong harmonic peaks centered at the periodicity of the grid (Fig. 2). Inverse Fourier transform of band-pass filtered areas around these peaks give a primary image and two complex conjugate harmonic images. Because scattering attenuates more strongly high spatial frequency components than low spatial frequency components, the ratio between the harmonic and primary images is a scattering image.
Fig. 1.
Diagram of the experimental setup for imaging X-ray scattering.
Fig. 2.
Illustration of spatial harmonic imaging of the scattering distribution. Experimental setup is given in Section III. Grid line spacing in the raw image is finer than the resolution of this graph causing the faded appearance. Fourier transform of the raw image contains a primary peak at the center and harmonic peaks corresponding to the periodicity of the grid. Areas surrounding the peaks are band-pass filtered and inverse transformed into a harmonic image and a primary image. Ratio between the two is a scattering image. Profiles across the horizontal midline of the harmonic, primary, and scattering images are superimposed on the corresponding images. In this example, the vials were held in a frame of styrofoam, which was found to be an effective X-ray scattering medium. Foam frame is conspicuous in the scattering image and not so in the absorption image.
The primary image is centered about zero spatial frequency and unaffected by coherent scattering. When normalized with a reference primary image of the grid, it is a conventional absorption image. The detailed explanation of this method is presented below.
II. EXPLANATION OF THE PRINCIPLES OP SPATIAL HARMONIC IMAGING
A. Harmonic Image Formation
The projection of the grid onto the detector surface is a periodic pattern of dark and bright stripes. Its Fourier transform, or spectrum, contains a number of discrete peaks corresponding to the harmonics of the basic grid frequency. In the following discussion we denote the projection of the grid as G, its spectrum as g, the projection image of the object only as F, its spectrum as f, the image of the grid-masked object as Fg, and its spectrum fg. Fg is the raw data obtained in the experiment.
If the grid stripes are aligned in the X direction (Fig. 1), then in the approximation of an infinitely large grid, the grid spectrum consists of discrete harmonic peaks
| (1) |
where P is the period of the grid as projected onto the detector surface and gn is the amplitude of the nth harmonic peak. The n = 0 harmonic is the primary peak. Practically, only the primary and low order harmonics have appreciable amplitudes.
When the grid is placed in front of the object and in the absence of scattering
| (2) |
The spectrum of the object is convolved with the spectrum of the grid to yield
| (3) |
Assuming that the object function is band-limited
(3) becomes
The inverse Fourier transform on the interval [(2πn)/(P)−π/P, (2πn)/(P)+π/P], the nth order spatial harmonic image, is expressed as
Therefore, Hn (x, y) = gnF(x, y).
In the absence of the scattering all harmonic images are identical to the band limited object after demodulation. For an object with little high-frequency components, this conclusion holds approximately.
B. Scattering Effect on Harmonic Images
Since the large angle inelastic Compton scattering reduces the flux that reaches the detector, it is treated as effectively absorption in the following discussion. We consider scattering to be small angle forward scattering by the elastic (coherent) photon-electron collisions.
To further describe the effect of coherent scattering the object is hypothetically viewed as constructed by adding thin layers that are perpendicular to the cone-beam axis Z, incrementing from the grid side to the detector side (Fig. 1). The layer thickness dz is sufficiently small so that only single scattering events occur in a layer. Prior to the addition of a layer, the image intensity at position rd on the detector surface is
| (4) |
where r denotes the (x, y) coordinates on the layer surface, and I(r, rd) is the X-ray that exists at r and strikes rd. The addition of the thin layer dz causes a minute change of the image intensity.
We make two assumptions. 1) Coherent scattering is confined to small forward angles; 2) the experimental setup is such that the object subtends a small solid angle relative to the X-ray source. Then the addition of layer dz results in
| (5) |
where r and r′ are points on the layer surface, rd an are points on the detector surface, D is the distance between the origin of the coordinate system in the object and the detector surface, q0 is the wave vector of the X-ray, σ(q, r) is the differential scattering cross section per unit volume for scattering wave vector q and at point r, μa is the attenuation coefficient due to absorption and Compton scattering, and μs (r) is the total coherent scattering cross section at point r, which is the integral of the differential cross section
| (6) |
Again under the assumption that scattering is limited to small angles, the X-rays that strike rd on the detector surface all exited the layer dz in a small area about a point ro, within which the absorption and scattering coefficients vary slowly. These are substituted with the area means, and (5) is simplified to
| (7) |
Substituting (6) for μs in (7)
| (8) |
It can be seen that X-ray absorption by the layer is expressed in the first term of (8), and the effect of scattering is expressed by a convolution with the differential cross section in the second term.
We consider the attenuation of the nth harmonic image Hn(x, y)e−iy2πn/P with the addition of the layers. Substituting it in place of the raw image in (8)
| (9) |
Under the approximation that the harmonic modulation of e−iy2πn/P varies much more rapidly than the demodulated image Hn(x, y) (9) is simplified to
| (10) |
so that
| (11) |
The differential cross section of coherent scattering under Born approximation is
| (12) |
where re is the classical electron radius, and R(u) is the auto-correlation of the electron density distribution
| (13) |
Substituting into (11)
| (14) |
where R2(x, y; ro) is defined in the vicinity of ro as
| (15) |
Equation (15) relates the scattering effect to electron density variation. For the primary image of n = 0
| (16) |
The primary image is therefore a conventional absorption image.
Integrating (14) over the thickness of the object leads to
| (17) |
where Gn(rd) is the nth harmonic image of the grid only without the object, and the X-ray path is a straight line connecting the source with the point rd on the detector. We can separate the effect of scattering from absorption by the ratio between two harmonic images of different orders
| (18) |
In the special case of m = 0 and n = 1, this leads to
| (19) |
Equations (16) and (19) are the basis for obtaining absorption and scattering images from the harmonic images in a single exposure. The calibration images Gn are acquired for a given experimental geometry beforehand.
From (19) the observed electron density auto-correlation distance is λ(D−z)/P which varies linearly along the X-ray path. If the thickness of the object is small when compared to the object-detector distance D, it can be approximated to λD/P. Then the same auto-correlation distance is interrogated throughout the object, which we call the scattering length. It is effectively the length scale of the structures being studied by this method.
III. MATERIALS AND METHODS
We used a mammography X-ray tube of 0.1 mm spot size, in which an electron beam is accelerated by a 30 kV voltage before striking a molybdenum target to produce X-rays. A linear grid of 0.127 mm period was placed at 80 cm distance from the X-ray tube. The samples were placed immediately behind the grid. The detector is a charged-coupled device (CCD) based X-ray camera of 2048 × 2048 matrix and 30-µm pixel resolution. It was placed at 20–60 cm distance from the grid. Since the X-ray tube emits a continuous energy spectrum centered about 18 keV, the interrogated scattering length at any grid-detector distance is a distribution around a central value. In our experiments, the central value varied between 60 and 200 am depending on the grid-detector distance.
The pixel resolution of all harmonic images was 0.20 mm after the band-pass filter in the spatial frequency domain.
The electric current setting for the X-ray tube varied between 100 and 400 mAs from the shortest to the longest sample-detector distances. These relatively high current-time products were used since the distance between the detector and the source was longer than the normal mammography exams. The radiation doses of the samples were between 0.4 and 1.4 mGray when measured with an ionization chamber.
IV. RESULTS
In the example used to illustrate the method (Fig. 2), the sample was placed at 60 cm from the detector. The corresponding scattering length was 200 nm. The sample consisted of three vials held in a light styrofoam frame. The styrofoam was found to be an effective X-ray scattering medium. The foam frame is conspicuous in the scattering image and not so in the absorption image.
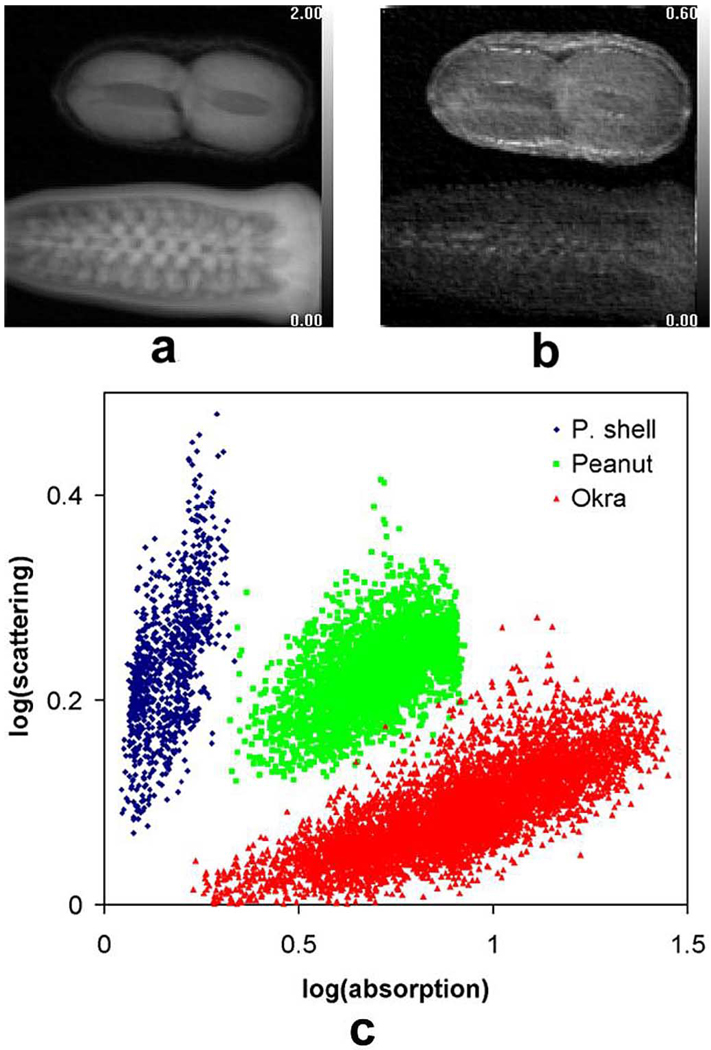
In another test, the scan of an okra and a peanut at the scattering length of 200 nm show that the two objects have similar levels of absorption, but the peanut and particularly the shell have higher levels of scattering (Fig. 3). Pixels in these three parts form distinct clusters in the scattering versus absorption graph [Fig. 3(c)].
Fig. 3.
Scattering and absorption images of an okra and a peanut at the scattering length of 200 nm. (a) Absorption image. (b) Scattering image. (c) Pixel-wise scattering versus absorption plot of three different areas of the image.
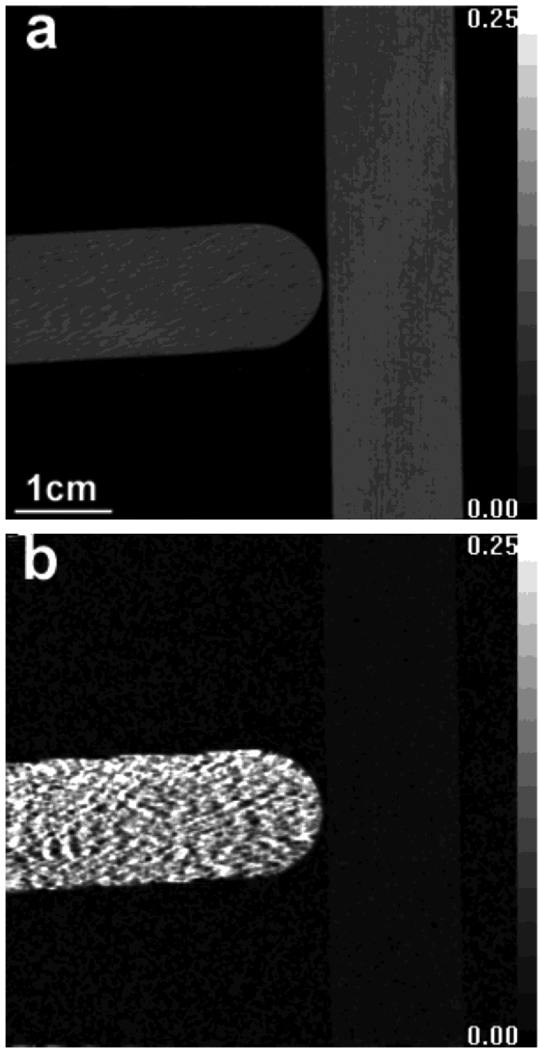
In objects containing oriented structures, the level of scattering depends on the orientation of the structure relative to that of the linear grid. This is seen in a scan of two wood blocks placed perpendicular to each other (Fig. 4). The wood fiber of the horizontal block is aligned with the linear grid. The scattering length is 200 nm. In the absorption image [Fig. 3(a)], a diffraction pattern is visible in the horizontal block and it has slightly lower absorption than the vertical one (mean ± stdev of 0.087±0.006 versus 0.095±0.004, t-test for the significance of the difference between them gives P < 10−7). The horizontal block causes substantial scattering while the perpendicular one has minimal scattering [Fig. 3(b)] (0.168±0.062 versus 0.009±0.005, t-test for the significance of the difference between them gives P < 10−7).
Fig. 4.
Scattering and absorption images of two wood blocks arranged perpendicular to each other at the scattering length of 200 nm. Grid used in this experiment is aligned horizontally. (a) Absorption image. (b) Scattering image.
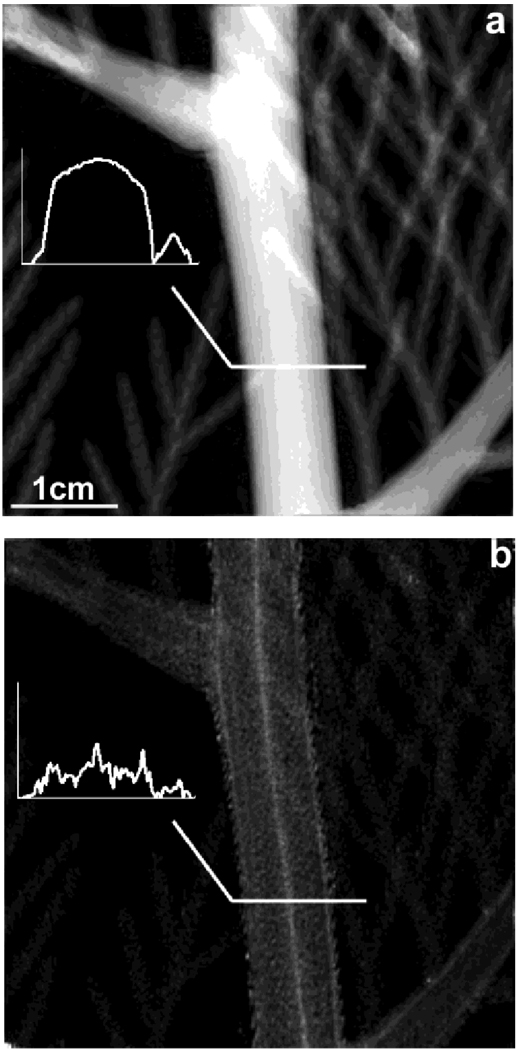
The scattering image may show structures that are not visible in the absorption image. In the images of a western cedar branch taken at 200 nm scattering length (Fig. 5), a bright central core running the length of the stem is visible in the scattering image but absent in the absorption image. This bright band corresponds to the pith of the stem [9]. The pith is consisted of parenchyma cells with intercellular air spaces. The air spaces likely account for the higher level of X-ray scattering in the pith.
Fig. 5.
Absorption and scattering images of a western red cedar branch at the scattering length of 200 nm. Profiles across the stem are plotted in the insets. (a) Absorption image. (b) Scattering image.
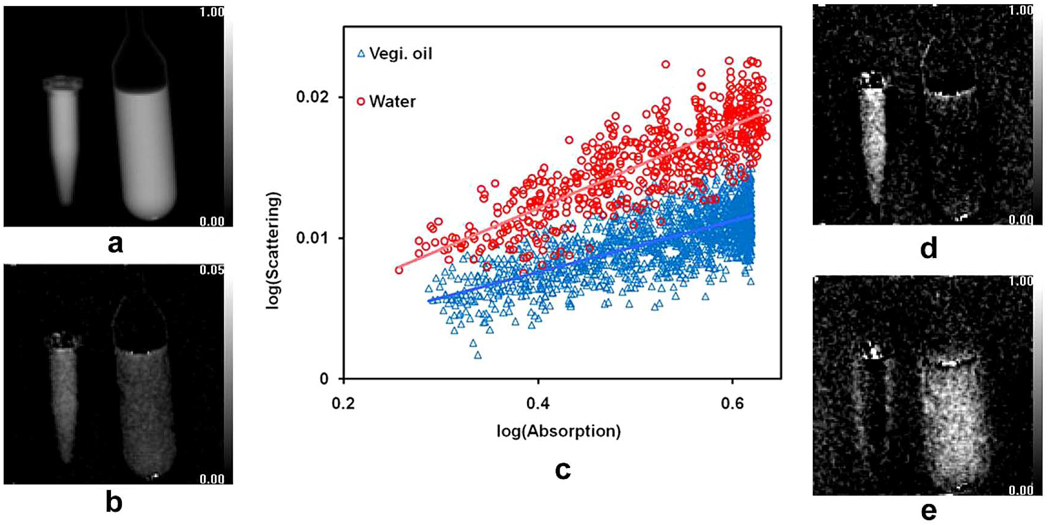
The combination of absorption and scattering data can help distinguish different materials that appear similar in absorption images. In a scan of water and vegetable oil samples at 60 nm scattering length (Fig. 6), both have similar absorption and low levels of scattering. The two samples are separated in the scattering vs. absorption graph [Fig. 6(c)]. In linear regression between the two measurements, the slope for water and oil are (fit ± standard error) 0.029 ± 0.001 and 0.018 ± 0.0005, respectively. These slopes are used to determine the fractional content of water and oil in each pixel. The absorption image can then be sectioned into a water image and an oil image [Fig. 6(d) and (e)].
Fig. 6.
Absorption and scattering measurements of a vial of water (left) and vegetable oil (right) at the scattering length of 60 nm. (a) Absorption image. (b) Scattering image. (c) Pixel-wise scattering versus absorption plot of water and oil. (d) Water content image. (e) Oil content image.
V. DISCUSSION
Previous imaging studies of X-ray scattering measured the angular distribution of scattered light directly using collimated beams. We show that in the spatial frequency domain the effect of scattering can be quantified with conventional X-ray sources and for all locations of the sample simultaneously. This method measures the Fourier transform of the scattering angular distribution instead the angular distribution itself. By the connection between coherent scattering and electron density fluctuation, thus method in effective measures an auto-correlation of the electron density distribution. Due to its simplicity, it is readily adaptable to many X-ray imaging settings.
Given the dependence of the scattering length on the instrumentation parameters, commercially available X-ray equipment limit the length scale to tens to hundreds of nanometer. To study larger structures will require denser grids and X-ray tubes with smaller spot sizes, or arranging the equipment over longer linear distances. This is a basic limitation imposed by currently available X-ray tubes and grids.
The preliminary results in test samples show that spatial harmonic imaging of X-ray scattering is simple to implement, and the scattering images provide a different set of information from the absorption images. Specific medical and biological applications still need to be developed. One possible extension of this method is to employ more sophisticated grids that have multiple spatial frequencies in different orientations, such as checker board patterns, to simultaneously characterize scattering at several length scales.
ACKNOWLEDGMENT
The authors would like to thank Dr. C. Lo of the National Heart, Lung, and Blood Institute (NHLBI) for her help with darkroom processing in earlier tests using X-ray films. The authors would also like to thank Dr. C. Combs of NHLBI for his helpful discussion.
This work was supported by National Heart, Lung and Blood Institute, National Institutes of Health.
REFERENCES
- 1.Johns PC, Yaffe MJ. Coherent scatter in diagnostic-radiology. Med. Phys. 1983;vol. 10(no. 1):40–50. doi: 10.1118/1.595443. [DOI] [PubMed] [Google Scholar]
- 2.Davis TJ. A unified treatment of small-angle X-ray-scattering, X-ray refraction and absorption using the Rytov approximation. Acta Crystallographica Section A. 1994;vol. 50:686–690. [Google Scholar]
- 3.Dickinson M, Farman G, Frye M, Bekyarova T, Gore D, Maughan D, Irving T. Molecular dynamics of cyclically contracting insect flight muscle in vivo. Nature. 2005;vol. 433(no. 7023):330–333. doi: 10.1038/nature03230. [DOI] [PubMed] [Google Scholar]
- 4.Chapman D, Thomlinson W, Johnston RE, Washburn D, Pisano E, Gmur N, Zhong Z, Menk R, Arfelli F, Sayers D. Diffraction enhanced X-ray imaging. Phys. Med. Biol. 1997;vol. 42(no. 11):2015–2025. doi: 10.1088/0031-9155/42/11/001. [DOI] [PubMed] [Google Scholar]
- 5.Wernick MN, Wirjadi O, Chapman D, Zhong Z, Galatsanos NP, Yang YY, Brankov JG, Oltulu O, Anastasio MA, Muehleman C. Multiple-image radiography. Phys. Med. Biol. 2003;vol. 48(no. 23):3875–3895. doi: 10.1088/0031-9155/48/23/006. [DOI] [PubMed] [Google Scholar]
- 6.Levine LE, Long GG. X-ray imaging with ultra-small-angle X-ray scattering as a contrast mechanism. J. Appl. Crystallogr. 2004;vol. 37:757–765. [Google Scholar]
- 7.Muehleman C, Li J, Zhong Z, Brankov JG, Wernick MN. Multiple-image radiography for human soft tissue. J. Anatomy. 2006;vol. 208(no. 1):115–124. doi: 10.1111/j.1469-7580.2006.00502.x. [DOI] [PMC free article] [PubMed] [Google Scholar]
- 8.Lukosz W. Optical systems with resolving powers exceeding classical limit. J. Opt. Soc Amer. 1966;vol. 56(no. 11):1463–1472. [Google Scholar]
- 9.Purves WK, Orians GH, Heller HG. Life: The Science of Biology. 3rd ed. Sunderland, MA: Sinauer; 1992. pp. 646–665. [Google Scholar]


