

Abstract
Introduction
Lesion placement and transmurality are critical factors in the success of cardiac transcatheter radiofrequency ablation (RFA) treatments for supraventricular arrhythmias. This study investigated the capabilities of catheter transducer based acoustic radiation force impulse (ARFI) ultrasound imaging for quantifying ablation lesion dimensions.
Methods and Results
RFA lesions were created in vitro in porcine ventricular myocardium and imaged with an intracardiac ultrasound catheter transducer capable of acquiring spatially registered B-mode and ARFI images. The myocardium was sliced along the imaging plane and photographed. The maximum ARFI-induced displacement images of the lesion were normalized and spatially registered with the photograph by matching the surfaces of the tissue in the B-mode and photographic images. The lesion dimensions determined by a manual segmentation of the photographed lesion based on the visible discoloration of the tissue were compared to automatic segmentations of the ARFI image using two different calculated thresholds. ARFI imaging accurately localized and sized the lesions within the myocardium. Differences in the maximum lateral and axial dimensions were statistically below 2 mm and 1 mm respectively for the two thresholding methods, with mean percent overlap of 68.7±5.21% and 66.3±8.4% for the two thresholds used.
Conclusion
ARFI imaging is capable of visualizing myocardial RFA lesion dimensions to within 2 mm in vitro. Visualizing lesions during transcatheter cardiac ablation procedures could improve the success of the treatment by imaging lesion line discontinuity and potentially reducing the required number of ablation lesions and procedure time.
Keywords: acoustic radiation force impulse imaging, radiofrequency catheter ablation, atrial fibrillation, atrial arrhythmias, intracardiac echocardiography
Introduction
Transcatheter guided cardiac ablation is the standard treatment for supraventricular arrhythmias in the United States, with radiofrequency ablation (RFA) as the most popular energy source for ablation lesion formation. Cardiac RFA is controlled destruction of myocardium that resistively heats tissue under an electrode tip, creating a permanent, hemispherical lesion [19]. Single point or lines of multiple RFA lesions are used to isolate or destroy offensive circuit pathways of common supraventricular tachyarrhythmias [14, 15, 17]. These procedures are effective, minimally invasive, and have low morbidity and mortality rates [20].
Ideally, lesion lines are continuous and eliminate or isolate arrhythmogenic tissue while minimizing damage and maintaining the mechanical integrity of surrounding tissues and proximal vessels. Gaps in lesion lines facilitate residual arrhythmogenic conduction; therefore, lesion placement and size are the primary determinants of the efficacy of the treatment [25]. A number of factors affect lesion formation in vivo. Factors including convective cooling from blood flow, catheter tip size, orientation, and tissue contact [28, 27] all cause substantial variability in lesion size. Due to this variability, line continuity is unpredictable based on delivery parameters alone. Ideally, a visual inspection of the lesions would facilitate a rapid evaluation of line continuity. However, while many imaging methods are used to guide catheter placement, currently no real-time imaging modality exists with the capability to visualize lesion size within the myocardium during clinical procedures.
Intracardiac echoradiography (ICE) is commonly used in ablation procedures to guide catheter placement and confirm proper catheter-tissue contact in real-time. However, B-mode ultrasound images provide no quantification of lesion size or line continuity [18]. Cardiac electroanatomical navigation and conduction mapping systems effectively indicate precise lesion location and map conduction but provide no direct visual feedback about actual lesion size and lesion line continuity [10]. Discontinuities often result in electrical leakage through lesion gaps. Identification and complete elimination of these gaps often requires multiple conduction mappings, which significantly lengthens procedure time. Additional procedures may be necessary if remaining lesion gaps allow conduction and the arrhythmia reoccurs [21, 29].
Major complications can be precipitated by excessive RF delivery and are reported in approximately 5% of RFA treated patients [31]. The most serious morbidities include atrial esophageal fistulas, pulmonary vein stenosis, complete AV nodal block, and excessive damage to collateral tissue or coronary vessels [30, 6, 32, 31]. Providing the capability to image lesions in real time would likely: 1) reduce procedure time, 2) reduce the number of complications caused by excessive RF delivery, and 3) increase the overall success rate of the procedure [3, 21].
Acoustic radiation force impulse (ARFI) imaging is performed by applying short-duration acoustic radiation forces to tissue. These pulses generate local submillimeter displacements that are monitored both spatially and temporally using delay estimator methods [24]. The displacements can be displayed in a color image format to produce a 2D representation of tissue stiffness. Both the generation of radiation force and tracking of the resultant displacements can be performed with a standard clinical ultrasound scanner and a commercial ICE catheter transducer, providing co-registered B-mode and ARFI images of the myocardium[13]. Additional background for ARFI imaging can be found in Nightingale et al. [22, 23].
As the myocardium is ablated, resistive heating of the tissue causes protein denaturation resulting in a lesion with a higher elastic modulus relative to the surrounding untreated myocardium [34, 1]. The variation in elasticity between the stiffer treated and more compliant untreated myocardium creates a marked contrast in the ARFI image. We have shown previously that it is possible to visualize ablation lesions in vivo with an ICE catheter using ARFI imaging [8]. In this study, we investigate the ability of ARFI imaging to accurately quantify cardiac RFA lesion size.
Methods
Experimental Setup and Protocol
A Plexiglas™ water tank filled with a deionized water saline solution (impedance measured between 80 and 150 Ω) was designed to create a repeatable in vitro model of in vivo cardiac ablation procedures. The experimental setup is shown in Figure 1. A custom made 4 × 4 × 2 cm Plexiglas™ box with 1 mm wide 30° parallel slits on the top and bottom (Figure 2) containing a porcine ventricular myocardial sample was secured to the bottom of the tank, positioning the myocardial sample parallel to the front face of the tank. A 2 cm thick piece of sound absorbing rubber was attached behind the myocardial sample to eliminate reverberations.
Fig. 1.

The in vitro experimental chamber. A myocardial (M) sample rests in front of a sound absorbing backing (B) on a vertical mount box. A lesion (L) was made using a radiofrequency ablation device (AD) connected to a foil ground electrode (GE) and an ablation catheter (AC) brought into contact with the myocardium though a guide sheath (GS). An ultrasound scanner (US) imaged the lesion with an AcuNav™ transducer (AT). The imaging catheter was adjusted to the desired imaging plane (IP) using a translation stage (TS) and rotation dial (RD).
Fig. 2.
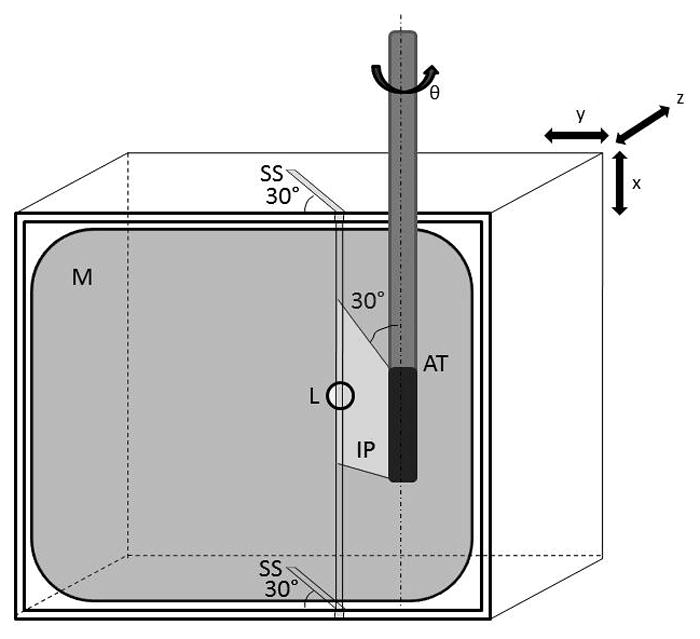
Myocardial sample (M) was placed in a mount box with 30° slicing slits (SS) on the top and bottom edges. The RFA lesion (L) was created between these two slits and imaged by the AcuNav™ transducer (AT), with the imaging plane (IP) positioned along the 30° plane. The myocardial sample was then cut in the imaging plane using the slits as guides.
An ablation catheter (8 French SteeroCath, Boston Scientific; Natick, MA) was manually brought into contact with the surface of the myocardial sample through a guide sheath located on the front face of the water tank and positioned between the two 30° slits (Figure 2). Ablation lesions were delivered with a Cardiac Pathways (Model 8002; Sunnyvale, CA) RFA device with powers between 25 and 40 W and treatment durations between 40 and 120 s. A pump was used to maintain a continuous stream of fluid across the ablation site through inlet and outlet valves on opposite sides of the tank to simulate blood perfusion and prevent excess heating.
Following ablation, the RFA catheter was removed from the myocardial surface, and a custom AcuNav™ intracardiac ultrasound imaging probe (see below) was inserted into a 10 French metallic sheath and fed into a translational/rotational stage mount where the transducer position (x,y,z) and angle in elevation (θ) could be controlled. The catheter transducer’s imaging plane was aligned to penetrate along the 30° slits of the mount box. Alignment was accomplished by inserting a needle through the slits and adjusting the imaging plane with the translational/rotational stage such that the brightness of the needle was maximized within the B-mode image. Once the transducer was properly aligned to the slice plane (depicted in Figure 2), the needle was removed and spatially registered B-mode and ARFI images were taken. When imaging was complete, the mounting box was removed from the tank with the myocardial sample in place and the tissue was sliced using the 30° slits as guides to obtain a cross-section of the lesion along the imaging plane. The cut myocardium was positioned onto a complementary 60° angle block to display the lesion cross-section as a flat surface and photographed using a Nikon™ (Tokyo, Japan) D50 digital camera.
Imaging Protocol
Myocardial samples were imaged using a Siemens (Siemens Healthcare, Ultrasound Business Unit, Mountain View, CA) custom-made, 128-element AcuNav™ intracardiac echocardiography catheter. One sample was imaged with a commercially available 64-element AcuNav™. Custom transducer/system interfaces and beam sequences were developed so that B-mode and ARFI images could be acquired on a commercially available Siemens SONOLINE Antares™ ultrasound scanner. A linear motion filter was applied to remove bulk motion within the ARFI images caused by external vibrations and catheter rebound. The images were formed by quantifying the tissue displacement away from the transducer caused by the ARFI excitation at each pixel. See Hsu et. al. for specific details on the imaging protocol [13].
Image Processing and Data Analysis
Experimental lesions were created with the above protocol; however, some lesions were not analyzed because physiological variations of the tissue affected the image quality or the pathological comparison analysis. These complications included severe over-ablation, substantial tissue inhomogeneity such as fat pockets within the lesion tissue, or an inability to spatially register the B-mode and digital image caused by distortions created when slicing or removing the myocardial sample.
Pathological comparison analysis for this experiment required normalization of the image through depth. Nineteen lesions underwent a preliminary examination to determine if the maximum ARFI-induced displacement image could be normalized. Eleven lesions were conclusively normalized during the preliminary examination and underwent the complete comparison analysis. Each lesion was first analyzed with a semi-automatic algorithm developed in MATLAB (Mathworks, Inc., Natick, MA) to spatially register the scan converted B-mode (Fig. 3a) and digital photographic (Fig. 3b) images of the ablation lesion. The photographs were resampled to the scan converted line density and spatially registered with the B-mode image by manually selecting and matching the visible indentation left in the myocardium by the ablation catheter. The myocardial surfaces were automatically detected in both the B-mode and photographic image based on simple intensity thresholding, and the photograph was rotated about the manually selected point until the co-linearity of the two surface traces was maximized.
Fig. 3.

(a) B-mode image and (b) digital image of a RFA lesion sliced along the 30° imaging plane. Image of maximum ARFI-induced displacement overlaid onto: (c) the B-mode image and (d) the digital photograph of the lesion cross-section. Depth normalized maximum ARFI-induced displacement data overlaid onto: (e) the B-mode image and (f) the digital image of the lesion cross-section. The color bar units in (c) and (d) are μm displacement away from the transducer; in plates (e) and (f) the colors represent the fraction of the maximum displacement at a given depth.
Figure 3c is an image of maximum ARFI-induced displacements, showing a distinct gradient of displacement through depth as the focal gain and tissue attenuation caused non-uniform radiation force generation [9]. A time gain control (TGC) based normalization algorithm was applied to the raw data to compensate for radiation energy attenuation through depth and time, a normalized image is depicted in Figure 3e. Figures 3d and 3f show a maximum ARFI-induced displacement image and a normalized ARFI image overlaid onto the digital photograph using the alignment parameters found by the spatial registration of the photograph and B-mode image.
A manual segmentation of the lesion based on the visible discoloration of the burn in the digital photograph was compared to automatic thresholding segmentations of the lesion from the normalized ARFI image. A threshold value sweep was applied to the normalized ARFI images and the threshold resulting in the highest percent overlap between the manual and thresholded segmentation was defined as the Optimal Overlap Threshold (OOT). All automatic segmentations were performed in MATLAB, and a software algorithm closed gaps within the lesion larger than 0.4 mm and enforced the constraint of a single contiguous lesion to eliminate spurious normalized displacements measured below the threshold. The data was then filtered using a closing function.
Mean values were calculated for manually selected 30×30 pixel regions inside and outside (MVI, MVO) of the lesion. These values along with the OOT for the 11 lesions were then used in a multiple linear regression. Individual Standardized Thresholds (ST) were then calculated for each lesion based on the regression coefficients, MVIs, and MVOs. For each lesion, the manual segmentation was compared to the automatic segmentation applying either the OOT or ST values.
Pathological Comparison Statistical Analysis
Differences between the manual and automatic lesion segmentation were summarized with sample means and standard deviations for lateral and axial maximum dimensions and percent overlap. Confidence intervals were calculated based on the absolute difference between lateral and axial dimensions and areas (n = 11, α = 0.05). One-sided paired-t alternative hypothesis tests were performed comparing the manual and automatic segmentations (n = 11, α = 0.05, zα = 1.650) using the two alternative hypotheses that the mean difference of the lateral or axial dimension between the traces was less than 2 mm and less than 1 mm.
Results
Figure 4, column (a) shows maximum ARFI-induced displacement images for three lesions overlaid onto their gray-scale digital image. All lesions were visible at the surface of the myocardium, where the ablated tissue was stiff and produced a displacement of around 1 μm (blue on the color scale). The nonablated, more compliant myocardium was displaced more than 3 μm (orange-red on the color scale). Column (b) shows the maximum ARFI-induced displacement data normalized for changes in power with depth. This normalization increases the contrast between the ablated and nonablated myocardium at the distal lesion boundary producing a clearer visualization of the entire lesion. The normalized data were segmented using the OOT and ST values, producing the ARFI imaging-determined lesion boundaries traced by the blue and green lines, respectively, in Figure 4, column (c). The user segmented lesion boundaries based on the digital image are shown by the black line for comparison. Both OOT and ST values were between 0.5 and 1.0. The statistical values comparing the manual to the automatic segmentations are shown in Table I.
Fig. 4.

Examples of raw and normalized ARFI images and of the human and machine determined lesion boundaries. Each row contains images for a separate lesion. Column (a) is the maximum ARFI-induced displacement image overlaid onto the photograph of the lesion cross-section. Column (b) is the depth normalized ARFI image overlaid onto the cross-section photograph. Column (c) shows the lesion boundary traces as determined by a manual segmentation based on the digital image (black) and the automatic ARFI imaging segmentations based on the optimal (blue) and standardized (green) thresholds. Lesions 1 and 2 were imaged with the custom 128-element AcuNav™, while lesion 3 was imaged with a commercially available 64-element AcuNav™. The automatic threshold traces for lesion 3 are identical and overlap. The color bar units in column (a) are μm displacement away from transducer; in column (b) the colors represent the fraction of the maximum displacement at a given depth.
TABLE 1.
Lesion Dimension Statistics
| Optimal-Overlap | Standardized | |||||
|---|---|---|---|---|---|---|
| Lateral (mm) | Axial (mm) | Area (mm2) | Lateral (mm) | Axial (mm) | Area (mm2) | |
| % Overlap | - | - | 68.7±5.2 | - | - | 66.3±8.4 |
| Manual | 8.5±1.1 | 5.0±0.9 | 50.7±15.9 | 8.5±1.1 | 5.0±0.9 | 50.7±15.9 |
| ARFI | 9.1±1.7 | 5.2±0.7 | 51.8±17.8 | 10.0±1.8 | 5.5±1.1 | 54.2±15.1 |
| Mean Diff | −0.6±1.0 | −0.1±0.9 | −1.1±5.8 | −1.6±2.0 | −0.4±1.4 | −3.4±14.8 |
| 95% CI | (−1.2, 0.01) | (−0.7, 0.4) | (−4.6, 2.3) | (−2.8, −0.4) | (−1.3, 0.4) | (−12.2, 5.4) |
| Absolute Diff | 0.9±0.6 | 0.7±0.5 | 4.8±3.2 | 1.7±1.9 | 0.9±1.1 | 11.2±9.7 |
| z0, μ0 = 1 mm | −0.58 | −2.20 | - | −0.56 | −3.18 | - |
| z0, μ0 = 2 mm | −6.40 | −8.44 | - | −2.27 | −6.14 | - |
Averaged dimension data and statistical analysis comparing the manual and automatic (Optimal-Overlap and Standardized thresholds) segmentations of eleven RFA lesions. Statistical analysis includes 95% confidence intervals and one-tailed paired-t test statistics where z0 < -zα infers significance (zα = 1.650 for n = 11 and α = 0.05).
The mean maximum percent overlap between the manual and automatic segmentations of the lesions was 68.7%±5.21 when applying the OOT, and 66.3%±8.4 when applying the ST. The application of the OOT yielded a mean difference between the manual and automatic determined boundaries of −0.6±1.0 mm laterally and −0.1±0.9 mm axially, with absolute differences of 0.9±0.6 mm laterally and 0.7±0.5 mm axially. Processing with the ST resulted in a mean difference of −1.6±2.0 mm laterally and −0.4±1.4 mm axially, and absolute differences of 1.7±1.9 mm laterally and 0.9±1.1 mm axially.
The 95% confidence intervals for the dimension and area differences were consistently larger for the STs, found to be (−2.8, −0.4) mm laterally, (−1.3, 0.4) mm axially, and (−12.2, 5.4) mm2 for area. The confidence intervals for the differences using the OOT were calculated as (−1.34, 0.26) mm laterally, (−0.69, −0.4) mm axially, and (−3.5, 4.13) mm2 for area. For the OOTs, a one-tailed paired t-test statistic indicated that the absolute differences in the maximum lateral dimensions were significantly less than 2 mm, but not significantly less than 1 mm. The axial absolute difference was statistically significant for the less than 2 mm and less than 1 mm hypothesis. The same pattern of significance was observed for the ST segmentation, with the lateral absolute difference significant for the less than 2 mm hypothesis and the axial difference for the less than 1 mm hypothesis.
Discussion
This study investigated the accuracy of sizing RFA lesions in myocardium with ARFI imaging in vitro. In this experiment, maximum ARFI-induced displacement images clearly revealed ablation lesions at the myocardial surface, and normalizing the ARFI image exposed the distal lesion border. The statistical results indicated that ARFI imaging was capable of sizing ablation lesions to within 2 mm laterally and 1 mm axially when automatically thresholding the normalized ARFI data with both Optimal-Overlap (OOT) and Standardized (ST) thresholds.
Ablation lesions are characterized by two regions of treatment: (1) a darker core of coagulated necrosis immediately surrounding the site of the ablation catheter, and (2) a partially treated pale circular zone of hemorrhage surrounding the core. No singular boundary in either the digital (visible color gradient) or ARFI image (displacement/elasticity gradient) can precisely differentiate lesion from untreated myocardium. However, this study compared rigid boundaries in order to approximate lesion dimensions and make a quantifiable comparison between the pathology and ARFI images.
Imaging lesions from a distance or at depth is the greatest challenge for intracardiac transcatheter ARFI imaging. The ultrasound energy available to displace the tissue is attenuated as the tissue depth increases and as the distance from the focal plane increases. ARFI images taken from a vantage point beyond 3 cm from the endocardial surface are likely to see reduced resolution and increased noise. Lesions in this investigation were imaged with the transducer positioned approximately 1 cm from the surface of the myocardium. Imaging at the optimal focal depths for this probe produced ARFI images with high resolution and contrast. In vivo ultrasound catheter transducers typically image the heart from the right atrium (RA), and it may be difficult to acquire high resolution ARFI images of ablation lesions created in the distal portions of the left atrium (LA). Imaging from a more proximal location, such as the coronary sinus [26], or from the LA via a trans-septal catheterization procedure may yield higher resolution ARFI images of LA lesions [26, 33, 7].
It is also challenging for intracardiac probes to produce enough radiation force energy to penetrate beyond a few centimeters. The normalization algorithm used was an attempt to correct for the loss of energy with depth. The algorithm required specific conditions that were not known until after the experiment. Inadequate normalization led to the elimination of eight of the 19 lesions. A more sophisticated normalization algorithm will need to be developed for clinical application where the lesion depth is more than a centimeter. However, normalization may not be necessary during atrial ablation procedures where the myocardial walls are thinner [11].
The results of this experiment are critically dependent on the process used to match the ultrasound imaging plane to the cut through the tissue sample. This matching was accomplished in three ways: 1) the ultrasound plane was established by imaging needles inserted through the slots in the tissue sample box, 2) the tissue was cut using the slots as guides, and 3) an image processing scheme was developed to rotate and scale the images. This process is not trivial and likely induced errors. These errors would likely worsen the dimensional differences and the percent overlap errors. Any improvement in this matching process would likely reduce the errors.
The elastic contrast between the ablated and nonablated myocardium is likely to be similar for in vivo and in vitro myocardium. ARFI imaging was implemented successfully in vivo to image ablation lesions and comparable elastic contrast was observed [13, 8]. However, a confounding factor to in vivo imaging is the introduction of motion artifacts due to the dynamic environment of a beating heart. Recent advances in the development of ARFI imaging have resolved this challenge by shortening ARFI imaging acquisition time and ECG-gating the sequences to points of the cardiac cycle with reduced physiological motion [2, 5, 12]. In addition, motion filters have been developed to remove the remaining artifact. The in vitro contrast shown in this paper reflects the expected performance of ARFI imaging of myocardial ablation lesions in vivo.
Ablation procedures currently rely on conduction mapping to identify residual propagation through lesion line gaps. Conducting cells are often ‘stunned’ immediately after lesion creation and mapping should be delayed 30–60 minutes following lesion creation [4, 16]. Conduction gaps are discovered in a significant portion of patients and additional ablations and waiting cycles repeated. ARFI imaging may be able to identify conduction gaps in lesion lines during the initial ablation, potentially reducing the necessity of multiple conduction mapping delays and shortening total procedure time. ARFI imaging could be used in conjunction with existing cardiac electroanatomical navigation and conduction mapping systems to interrogate lesion or line continuity gap locations. Also, integrating ARFI imaging into existing RFA procedures may require minimal additional equipment or preparation time. ARFI imaging can be implemented from an ICE transducer with a software-modified conventional ultrasound scanner commonly used in clinical RFA procedures, supplemented by a power supply for ARFI generation.
Conclusion
Acoustic radiation force impulse (ARFI) imaging was used to successfully measure cardiac RFA lesion boundaries within myocardium in vitro. The dimensions of all of the experimental lesions were clearly visible at the surface of the myocardium in the maximum ARFI-induced displacement images. In addition, the contrast between the ablated and nonablated tissue was improved using a normalization algorithm for visualization of lesion distal borders. The data indicated ARFI imaging is able to generate images that delineate lesion size within 2 mm. These images could be displayed for physicians during RFA procedures to visualize lesion line continuity when isolating an arrhythmogenic region. Lesion continuity feedback could reduce procedure times and decrease the number of repeat procedures. Lesion size feedback could reduce the number of unnecessary lesions and over-ablation. The availability of a real time modality for imaging ablation lesions has the potential to substantially impact the clinical practice of interventional electrophysiology.
Acknowledgments
This research was funded by NIH Grant #: R21-EB-007741 and R01-HL096023
Hardware and system support from Siemens Medical Solutions USA, Inc. P. Wolf reports research support in the form of loaned equipment from Biosense Webster; G. Trahey reports relevant patent application or ownership. No other disclosures were made.
We would like to thank Siemens Medical Solutions USA, Inc. for their hardware and system support. We would also like to thank Richard Bouchard, Douglas Dumont, Joe Owen, Corbin Page, and Mark Palmeri for their technical assistance.
Contributor Information
Stephanie A. Eyerly, Department of Biomedical Engineering, Duke University, Durham, NC, USA
Stephen J. Hsu, Department of Biomedical Engineering, Duke University, Durham, NC, USA
Shruti H. Agashe, Department of Biomedical Engineering, Duke University, Durham, NC, USA
Gregg E. Trahey, Department of Biomedical Engineering, Duke University, Durham, NC, USA. Duke Medical Center Department of Radiology
Yang Li, Department of Biomedical Engineering, Duke University, Durham, NC, USA
Patrick D. Wolf, Department of Biomedical Engineering, Duke University, Durham, NC, USA
References
- 1.Bharat S, Techavipoo U, Kiss MZ, Liu W, Varghese T. Monitoring stiffness changes in lesions after radiofrequency ablation at different temperatures and durations of ablation. Ultrasound Med Biol. 2005 Mar;31(3):415–422. doi: 10.1016/j.ultrasmedbio.2004.12.020. [DOI] [PubMed] [Google Scholar]
- 2.Bouchard RR, Dahl JJ, Hsu SJ, Palmeri ML, Trahey GE. Image quality, tissue heating, and frame rate trade-offs in acoustic radiation force impulse imaging. IEEE Trans Ultrason Ferroelectr Freq Control. 2009 Jan;56(1):63–76. doi: 10.1109/TUFFC.2009.1006. [DOI] [PMC free article] [PubMed] [Google Scholar]
- 3.Calkins H, Yong P, Miller JM, Olshansky B, Carlson M, Saul JP, Huang SK, Liem LB, Klein LS, Moser SA, Bloch DA, Gillette P, Prystowsky E. Catheter ablation of accessory pathways, atrioventricular nodal reentrant tachycardia, and the atrioventricular junction: final results of a prospective, multicenter clinical trial. the atakr multicenter investigators group. Circulation. 1999 Jan;99(2):262–270. doi: 10.1161/01.cir.99.2.262. [DOI] [PubMed] [Google Scholar]
- 4.Cheema A, Dong J, Dalal D, Marine JE, Henrikson CA, Spragg D, Cheng A, Nazarian S, Bilchick K, Sinha S, Scherr D, Almasry I, Halperin H, Berger R, Calkins H. Incidence and time course of early recovery of pulmonary vein conduction after catheter ablation of atrial fibrillation. J Cardiovasc Electrophysiol. 2007;18:387–391. doi: 10.1111/j.1540-8167.2007.00760.x. [DOI] [PubMed] [Google Scholar]
- 5.Dahl JJ, Pinton GF, Palmeri ML, Agrawal V, Nightingale KR, Trahey GE. A parallel tracking method for acoustic radiation force impulse imaging. IEEE Trans Ultrason Ferroelectr Freq Control. 2007 Feb;54(2):301–312. doi: 10.1109/tuffc.2007.244. [DOI] [PMC free article] [PubMed] [Google Scholar]
- 6.Dong J, Vasamreddy CR, Jayam V, Dalal D, Dickfeld T, Eldadah Z, Meininger G, Halperin HR, Berger R, Bluemke DA, Calkins H. Incidence and predictors of pulmonary vein stenosis following catheter ablation of atrial fibrillation using the anatomic pulmonary vein ablation approach: results from paired magnetic resonance imaging. J Cardiovasc Electrophysiol. 2005;16:845–852. doi: 10.1111/j.1540-8167.2005.40680.x. [DOI] [PubMed] [Google Scholar]
- 7.Fagundes RL, Mantica M, De Luca L, Forleo G, Pappalardo A, Avella A, Fraticelli A, Dello Russo A, Casella M, Pelargonio G, Tondo C. Safety of single transseptal puncture for ablation of atrial fibrillation: retrospective study from a large cohort of patients. J Cardiovasc Electrophysiol. 2007;18:1277–1281. doi: 10.1111/j.1540-8167.2007.00958.x. [DOI] [PubMed] [Google Scholar]
- 8.Fahey BJ, Nightingale KR, Wolf PD, Trahey GE. Acoustic radiation force impulse imaging of myocardial radiofrequency ablation: Initial in vivo results. IEEE Transactions on Ultrasonics, Ferroelectronics and Frequency Control. 2005;52(4):631–641. doi: 10.1109/tuffc.2005.1428046. [DOI] [PubMed] [Google Scholar]
- 9.Fahey BJ, Nightingale KR, Wolf PD, Trahey GE. Acoustic radiation force impulse imaging of myocardial radiofrequency ablation: Initial in vivo results. IEEE Transactions of Ultrasonics, Ferroelectronics and Frequency Control. 2005;52(4):631–641. doi: 10.1109/tuffc.2005.1428046. [DOI] [PubMed] [Google Scholar]
- 10.Gepstein L, Evans SJ. Electroanatomical mapping of the heart: basic concepts and implications for the treatment of cardiac arrhythmias. Pacing Clin Electrophysiol. 1998 Jun;21(6):1268–1278. doi: 10.1111/j.1540-8159.1998.tb00187.x. [DOI] [PubMed] [Google Scholar]
- 11.Hall B, Jeevanantham V, Simon R, Filippone J, Vorobiof G, Daubert J. Variation in left atrial transmural wall thickness at sites commonly targeted for ablation of atrial fibrillation. J Interv Card Electrophysiol. 2006 Nov;17(2):127–132. doi: 10.1007/s10840-006-9052-2. [DOI] [PubMed] [Google Scholar]
- 12.Hsu SJ, Bouchard RR, Dumont DM, Wolf PD, Trahey GE. In vivo assessment of myocardial stiffness with acoustic radiation force impulse imaging. Ultrasound Med Biol. 2007 Nov;33(11):1706–1719. doi: 10.1016/j.ultrasmedbio.2007.05.009. [DOI] [PMC free article] [PubMed] [Google Scholar]
- 13.Hsu SJ, Fahey BJ, Dumont DM, Wolf PD, Trahey GE. Challenges and implementation of radiation force imaging with an intra-cardiac ultrasound transducer. IEEE Transactions on Ultrasonics, Ferroelectronics and Frequency Control. 2007 May;54(5):996–1009. doi: 10.1109/tuffc.2007.345. [DOI] [PMC free article] [PubMed] [Google Scholar]
- 14.Jackman WM, Beckman KJ, McClelland JH, Wang X, Friday KJ, Roman CA, Moulton KP, Twidale N, Hazlitt HA, Prior MI. Treatment of supraventricular tachycardia due to atrioventricular nodal reentry, by radiofrequency catheter ablation of slow-pathway conduction. N Engl J Med. 1992 Jul;327(5):313–318. doi: 10.1056/NEJM199207303270504. [DOI] [PubMed] [Google Scholar]
- 15.Jackman WM, Wang XZ, Friday KJ, Roman CA, Moulton KP, Beckman KJ, McClelland JH, Twidale N, Hazlitt HA, Prior MI. Catheter ablation of accessory atrioventricular pathways (wolff-parkinson-white syndrome) by radiofrequency current. N Engl J Med. 1991 Jun;324(23):1605–1611. doi: 10.1056/NEJM199106063242301. [DOI] [PubMed] [Google Scholar]
- 16.Jiang CY, Jiang RH, Matsuo S, Liu Q, Fan YQ, Zhang ZW, Fu GS. Early detection of pulmonary vein reconnection after isolation in patients with paroxysmal atrial fibrillation: A comparison of atp-induction and reassessment at 30 minutes postisolation. J Cardiovasc Electrophysiol. doi: 10.1111/j.1540-8167.2009.01564.x. [DOI] [PubMed] [Google Scholar]
- 17.Kay GN, Epstein AE, Dailey SM, Plumb VJ. Role of radiofrequency ablation in the management of supraventricular arrhythmias: experience in 760 consecutive patients. J Cardiovasc Electrophysiol. 1993;4:371–389. doi: 10.1111/j.1540-8167.1993.tb01277.x. [DOI] [PubMed] [Google Scholar]
- 18.Martin RE, Ellenbogen KA, Lau YR, Hall JA, Kay GN, Shepard RK, Nixon JV, Wood MA. Phased-array intracardiac echocardiography during pulmonary vein isolation and linear ablation for atrial fibrillation. J Cardiovasc Electrophysiol. 2002;13:873–879. doi: 10.1046/j.1540-8167.2002.00873.x. [DOI] [PubMed] [Google Scholar]
- 19.McRury ID, Haines DE. Ablation for the treatment of arrhythmias. Proceedings of the IEEE. 1996;84(3):404–416. [Google Scholar]
- 20.Mickelsen S, Dudley B, Treat E, Barela J, Omdahl J, Kusumoto F. Survey of physician experience, trends and outcomes with atrial fibrillation ablation. J Interv Card Electrophysiol. 2005 Apr;12(3):213–220. doi: 10.1007/s10840-005-0621-6. [DOI] [PubMed] [Google Scholar]
- 21.Nanthakumar K, Plumb VJ, Epstein AE, Veenhuyzen GD, Link D, Kay GN. Resumption of electrical conduction in previously isolated pulmonary veins: rationale for a different strategy? Circulation. 2004 Mar;109(10):1226–1229. doi: 10.1161/01.CIR.0000121423.78120.49. [DOI] [PubMed] [Google Scholar]
- 22.Nightingale K, Bentley R, Trahey GE. Observations of tissue response to acoustic radiation force: Opportunities for imaging. Ultrasonic Imaging. 2002;24:100–108. doi: 10.1177/016173460202400301. [DOI] [PubMed] [Google Scholar]
- 23.Nightingale K, Soo M, Nightingale R, Trahey G. Acoustic radiation force impulse imaging: In vivo demonstration of clinical feasibility. Ultrasound in Medicine and Biology. 2002;28(2):227–235. doi: 10.1016/s0301-5629(01)00499-9. [DOI] [PubMed] [Google Scholar]
- 24.Nightingale KR, Palmeri ML, Nightingale RW, Trahey GE. On the feasibility of remote palpation using acoustic radiation force. J Acoust Soc Am. 2001 Jul;110(1):625–634. doi: 10.1121/1.1378344. [DOI] [PubMed] [Google Scholar]
- 25.Pérez FJ, Wood MA, Schubert CM. Effects of gap geometry on conduction through discontinuous radiofrequency lesions. Circulation. 2006 Apr;113(14):1723–1729. doi: 10.1161/CIRCULATIONAHA.105.596593. [DOI] [PubMed] [Google Scholar]
- 26.Peters RJ, Kok WE, Rijsterborgh H, van Dijk M, Koch KT, Piek JJ, David GK, Visser CA. Reproducibility of quantitative measurements from intracoronary ultrasound images. beat-to-beat variability and influence of the cardiac cycle. Eur Heart J. 1996 Oct;17(10):1593–1599. doi: 10.1093/oxfordjournals.eurheartj.a014726. [DOI] [PubMed] [Google Scholar]
- 27.Petersen HH, Chen X, Pietersen A, Svendsen JH, Haunso S. Temperature-controlled radiofrequency ablation of cardiac tissue: an in vitro study of the impact of electrode orientation, electrode tissue contact pressure and external convective cooling. J Interv Card Electrophysiol. 1999 Oct;3(3):257–262. doi: 10.1023/a:1009864111507. [DOI] [PubMed] [Google Scholar]
- 28.Pilcher TA, Saul JP, Hlavacek AM, Haemmerich D. Contrasting effects of convective flow on catheter ablation lesion size: cryo versus radiofrequency energy. Pacing Clin Electrophysiol. 2008 Mar;31(3):300–307. doi: 10.1111/j.1540-8159.2008.00989.x. [DOI] [PubMed] [Google Scholar]
- 29.Shah D, Hässaguerre M, Jäıs P, Takahashi A, Hocini M, Clémenty J. High-density mapping of activation through an incomplete isthmus ablation line. Circulation. 1999 Jan;99(2):211–215. doi: 10.1161/01.cir.99.2.211. [DOI] [PubMed] [Google Scholar]
- 30.Sonmez B, Demirsoy E, Yagan N, Unal M, Arbatli H, Sener D, Baran T, Ilkova F. A fatal complication due to radiofrequency ablation for atrial fibrillation: atrio-esophageal fistula. Ann Thorac Surg. 2003 Jul;76(1):281–283. doi: 10.1016/s0003-4975(03)00006-7. [DOI] [PubMed] [Google Scholar]
- 31.Spragg DD, Dalal D, Cheema A, Scherr D, Chilukuri K, Cheng A, Henrikson CA, Marine JE, Berger RD, Dong J, Calkins H. Complications of catheter ablation for atrial fibrillation: incidence and predictors. J Cardiovasc Electrophysiol. 2008;19:627–631. doi: 10.1111/j.1540-8167.2008.01181.x. [DOI] [PubMed] [Google Scholar]
- 32.Wellens HJ. Catheter ablation of cardiac arrhythmias: usually cure, but complications may occur. Circulation. 1999 Jan;99(2):195–197. doi: 10.1161/01.cir.99.2.195. [DOI] [PubMed] [Google Scholar]
- 33.Yamada T, McElderry HT, Epstein AE, Plumb VJ, Kay GN. One-puncture, double-transseptal catheterization manoeuvre in the catheter ablation of atrial fibrillation. Europace. 2007 Jul;9(7):487–489. doi: 10.1093/europace/eum070. [DOI] [PubMed] [Google Scholar]
- 34.Zervas NT, Kuwayama A. Pathological characteristics of experimental thermal lesions. comparison of induction heating and radiofrequency electrocoagulation. J Neurosurg. 1972 Oct;37(4):418–422. doi: 10.3171/jns.1972.37.4.0418. [DOI] [PubMed] [Google Scholar]