Abstract
In rats bearing an intracranial T9 glioma, immunization with tumor antigens induces myeloid suppressor cells, which express neutrophil (His48) and monocyte (CD11bc) markers, to infiltrate the tumors. The His48+/CD11bc+ cells were not derived from CNS microglia but were hematogenous; suppressed multiple T cell effector functions; and are myeloid-derived suppressor cells (MDSC). The glioma-infiltrating MDSC expressed arginase I, iNOS, indoleamine 2,3-dioxygenase and TGF-β; however, inhibitor/blocking studies demonstrated that NO production was the primary mechanism of suppression which induced T cell apoptosis. These findings suggest that neuro-immunomodulation by MDSC in rat gliomas maybe mediated by a pathway requiring NO production.
Keywords: brain tumor-associated immunosuppression, malignant glioma, myeloid-derived suppressor cells, nitric oxide
1. Introduction
Glioblastomas are grade IV astrocytic neoplasms derived from the glial lineage; represent ~50% of primary central nervous system tumors; and are essentially incurable with a median survival of approximately 18 months after primary diagnosis (Surawicz et al., 1998). Current standard treatment is surgical debulking followed by concomitant temozolomide chemotherapy and radiotherapy which has shown to extend median survival and additional 2.5 months (Stupp et al, 2009).
Many brain tumor researchers believe that the development of a glioma vaccine, which can activate glioma-specific T cells, would be an effective compliment to current treatment and could be used to destroy residual tumor cells and prevent recurrence. Immunization strategies to include tumor cells that have been genetically altered to secrete immune enhancing cytokines; dendritic cells that have been manipulated to present tumor antigens; and active immunization with recombinant cancer peptides (reviewed by (Luptrawan et al., 2008; Okada and Pollack, 2004; Selznick et al., 2008)). However, because of the immunosuppressive environment of the brain tumor, these approaches have met with little success. Malignant gliomas produce soluble factors such as transforming growth factor (TGF)-β, prostaglandins and Interleukin (IL)-10 which are part of the immunosuppressive tumor environment (reviewed in (Gomez and Kruse, 2006)). Immuno-modulating cells which also suppress T cells function are found to infiltrate gliomas, such as T regulatory cells, macrophages and microglial (reviewed in (Sonabend et al., 2008; Watters et al., 2005)). More recently, we and others have identified immuno-regulatory myeloid cells that infiltrate experimental rodent brain tumors (Prins et al., 2002; Thomas et al., 2008). These tumor infiltrating myeloid cells are phenotypically double positive for granulocyte and monocyte markers, His48/CD11bc (rat) or Gr1/CD11b (mouse). It has yet to be determined if these tumor-associated, regulatory cells represent a population of: myeloid-derived suppressor cells (MDSC); immature-regulatory dendritic cells; or microglial cells (Cools et al., 2007; Nagaraj and Gabrilovich, 2007; Watters et al., 2005).
The generation of MDSC has been generally reported in non-glial, murine tumor models. However, there are also studies of MDSC in other pathological settings such as experimental autoimmune encephalomyelitis, graft-vs-host disease, bacterial infections and severe trauma models in which down-modulation of T cell activity is a common feature (al Ramadi et al., 1991; Bobe et al., 1999; Makarenkova et al., 2006; Zhu et al., 2007). Human MDSC have been recently described in cancers such as melanoma and in renal cell carcinoma (Filipazzi et al., 2007; Ko et al., 2009; Zea et al., 2005).
There are multiple mechanisms by which MDSC exert their regulatory effects on activated T cells some of which include the catabolism of essential amino acids such as tryptophan or arginine by indoleamine 2,3-dioxygenase (IDO) or arginase 1, respectively; production of nitric oxide (NO); or by the production of immuno-suppressive cytokines such as TGF-β (Mazzoni et al., 2002; Mellor and Munn, 2004; Rodriguez and Ochoa, 2008; Xiang et al., 2008). Immature dendritic cells and regulatory microglia have been reported to down-modulate T cell activity by the production of TGF-β (Gandhi et al., 2007; Watters et al., 2005).
In the T9+vac paradigm, s.c. vaccination of animals with an established, intracranial (i.c.) T9 glioma results in the trafficking of T cells to the tumor site. Immunization also induces His48+/CD11bc+ immature myeloid cells to infiltrate the intracerebral tumors (Prins et al., 2002). In this report, we identify the His48+/CD11bc+ cells as rat MDSC in the T9+vac model based upon phenotype, origin and ability to suppress multiple T cell effector functions. Moreover, we demonstrate that NO production by the MDSC mediate T cell inhibition and induces T cell apoptosis. We believe that neuro-immunoregulatory MDSC represent another method in which gliomas can evade tumor reactive T cells and MDSC may play a role in brain tumor-related immunosuppression.
2. Materials and methods
2.1. Animals, cell lines and tumor cell culture
Inbred female Fischer 344 rats weighing 100 – 120 g were obtained from the National Cancer Institute (Fredrick, MD). Animals were housed in a climate controlled, AAALAC approved, vivarium and were provided free access to rat chow and water. All experimental animal procedures were approved by members of the Institutional Animal Care and Use Committee. The T9 glioma and MadB106 mammary adencarcinoma were chemically induced in female Fischer rats (Barlozzari et al., 1985; Benda et al., 1971). T9 and MadB106 cells were cultured in Dulbecco’s Modified Eagle’s Medium (Invitrogen, Carlsbad, CA) supplemented with 10% fetal bovine serum (Gemini Bio-Products, West Sacramento, CA) and non-essential amino acids (Invitrogen) as adherent monolayers at 37°C, passed biweekly with trypsin in the absence of antibiotics. Tumor cells were routinely screened for mycoplasma contamination (MycoTect, Invitrogen).
2.2. Tumor implantation and vaccination
Intracranial implantation of T9 glioma cells and vaccination with irradiated T9 cells were performed as previously described (Prins et al., 2002). Briefly, 5×10⁵ T9 cells in 5 μl of PBS were slowly injected intracranially at a depth of 3.5 mm, 4 mm to the right of the sagital suture and 1 mm posterior to the coronal suture and 5 days later rats were vaccinated s.c. with 5×10⁶ irradiated (50 Gy) T9 cells in 100 μl of PBS. In this model, vaccinated rats become moribund in ~14 days and non-vaccinated animals become moribund in ~25 days.
2.3. Depletion His48+ or CD11bc+ cells and purification of MDSC from the glioma infiltrate
Tumors from moribund T9+vac rats were mechanically forced through a 70 μM mesh to generate a single cell suspension. Cells were washed; layered onto Histopaque 1.119 (Sigma, St. Loius, MO); and centrifuged for 30 min at 700 × g. The interface containing mononuclear cells and granulocytes was collected and residual erythrocytes were removed by hypotonic lysis. Viable tumor infiltrating leukocytes (TIL) were enumerated on a hemacytometer. His48+ or CD11bc+ cells were depleted from the TIL by positive selection using immuno-magnetic columns and microbeads (Miltenyi Biotec, Auburn, CA) according to supplied protocol. In brief, TIL were incubated with biotinylated anti-His48 or CD11bc mAbs (1×10⁶ cells/0.25 μg) for 20 min; washed with PBS; incubated with anti-biotin microbeads; and positively selected on a LS MACS separation column. Glioma infiltrate depleted of His48+ or CD11bc+ cells were used in subsequent proliferation assays. The positively selected CD11bc+ cells from the tumor infiltrate that were retained in the magnetic column were purged with PBS and used in add-back, T cell/MDSC co-culture experiments.
2.4. Antibodies and flow cytometry
Antibodies were obtained from BD Biosciences (San Diego, CA) unless otherwise noted. For the depletion or purification of MSC, biotinylated His48 or CD11bc mAbs (Cedarlane Laboratories, Burlington, NC) were used. Anti-CD3 conjugated to fluorescein isothiocyanate (FITC); CD4 conjugated to Cy-Chrome; anti-CD8 conjugated to phycoerythrin; and an anti-bromodeoxyuridine (BrdU) conjugated to allophycocyanin mAbs were used in T cell proliferation studies. For phenotypic analysis of the immature myeloid cells, anti-CD11b conjugated to phycoerythrin and a biotinylated anti-His48 mAbs were used in conjunction with streptavidin-peridinin chlorophyll protein. FITC was used as a third color and Abs were conjugated to FITC and include anti-: CD2, CD3, CD4, CD8, CD11b, CD45, CD45RA, CD54, CD86, CD90, CD161, RP-3 (granulocytes), MHC class I (RT1A) and MHC class II (RT1B). Cell surface staining and FACS analysis of TIL from T9+vac animals have been previously described (Prins et al., 2002). Briefly, 1×10⁶ cells were stained in a volume of 50 μl of 5% fetal bovine serum/PBS containing a cocktail of 3 different mAbs for 30 min on ice. Cells that were double positive His48high and CD11bc+ were identified as MSC and were gated upon for subsequent phenotypic analysis.
2.5. T cell proliferation assays
Tumor infiltrating leukocytes depleted of His48+ or CD11bc+ cells or total TIL were seeded at a concentration of 1×10⁶ cells/ml in triplicate and cultured in RPMI-1640 supplemented with 10% fetal bovine serum, 0.05 mM 2-mercaptoethanol, HEPES (10 mM) and antibiotics/antimycotic (RPMI medium). Lymphocytes were stimulated with 5 μg/ml immobilized anti-CD3 and 0.5 μg/ml soluble anti-CD28 (clones G4.18 and JJ319, respectively, BD Biosciences) for 3 days and pulsed with BrdU (10 μM, BD Biosciences) for the last 24 h. Cells were collected and stained with anti-CD3, CD4 and CD8 mAbs cocktail. Cells were then fixed, permeablized and stained with an anti-BrdU mAb using a BrdU flow detection kit (BD Biosciences). Lymphocytes were then analyzed by flow cytometry on a FACSCanto cytometer (BD Biosciences) with initial gating on the CD3+/CD4+ or CD3+/CD8+ populations.
In add-back assays, splenic lymphocytes from naïve animals were purified on a Histopaque 1.077 (Sigma) gradient and enriched for T cells by passing through a nylon wool column. T cells were cultured alone or in the presence of an equal number of purified MDSC and pulsed with BrdU for the last 24 h. Each culture condition was performed in triplicate. Cells were collected; sequentially stained with anti-CD3 and anti-BrdU mAbs; and analyzed by flow cytometry with initial gating on the CD3+ population. Contact between T cells and MDSC was prevented by the use of 0.4 μM transwell inserts (Corning Inc., Lowell, MA). The culture medium from the add-back experiments was collected and used in subsequent assays for the determination of interferon (IFN)-γ and NO levels.
The incorporation of 3H-thymidine was also used as a measure of proliferation in stimulated TIL cultures. TIL (1×10⁶/ml RPMI medium) were seeded in 96-well plates in the presence of titrated doses of protein inhibitors (10 – 100 μM); neutralizing anti-TGF-β mAbs (0.5 – 5.0 μg/ml, R&D Systems, Inc., Minneapolis, MN); vehicle or non-specific murine IgG. Inhibitors used were: N-hydroxy-noroL-arginine (nor-NOHA, Calbiochem/EMD Chemicals, Inc., Gibbstown, NJ); methylthiohydantoin-DL-tryptophan (MTH-trp, Research Organics, Cleveland, OH); N-monomethyl-L-arginine (L-NMMA, Calbiochem) and indomethacin (Sigma). TIL were cultured for 3 days; pulsed with 1 μCi of 3H-thymidine for the last 15 h. 3H-thymidine incorporation was analyzed using a 96-well plate harvester and a beta-plate reader (Packard, Meridien, CT). Data are expressed as mean cpm of triplicate experimental cultures, ±SEM.
2.6. IFN-γ and NO assays
The level of IFN-γ in the T cell/MDSC co-cultures was determined by a rat specific IFN-γ ELISA (BD Biosciences). Conditioned medium from the triplicate co-cultures was clarified by centrifugation and stored at −20°C. Samples were diluted 1:50 with serum-free RPMI 1640 and assayed in duplicate according the supplied instructions. The mean levels of IFN-γ ±SEM in the conditioned medium of the triplicate cultures are shown.
For the determination of the level of NO in the medium of T cell/MDSC co-cultures, condition media from triplicate co-cultures were collected and stored as described above. NO concentrations were measured using the Griess Reagent System (Promega, Madison, WI). Samples were used neat and assayed in triplicate. The mean levels of NO ±SEM are shown.
2.7. Chromium-51 release cytotoxicity assay
Naïve animals were immunized subcutaneously with 5×10⁶ irradiated T9 cells and then boosted 3 weeks later with 2 weekly, subcutaneous injections of 5×10⁶ viable T9 cells. Splenic lymphocytes were purified on a Histopaque 1.077 gradient. Lymphocytes were cultured in 6-well plates in RPMI medium supplemented with human IL-2 (50 U/ml; Chiron Corporation, Emoryville, CA) at a density of 1×10⁶/ml and were stimulated with irradiated T9 cells (50 Gy) at a ratio of 50:1 (lymphocytes:T9 cell) for 5 days. T9 stimulated lymphocytes were then used in a standard cytotoxic T cell killing assay with chromium-51 labeled T9 glioma or MadB106 mammary adenocarcinoma (tumor specificity control) target cells as previously described (Graf et al., 2003). Briefly, 1×10⁴ target cells were added to each well of a 96 well V-bottom microplate. One million lymphocytes, MDSC or both were added to the wells in triplicate to achieve a MDSC:T cell:target cell ratio of 100:100:1. Irradiated splenocytes (2 Gy, 1×10⁶) from a naïve rat were added T cell:target and MDSC:target wells in order to keep the cell concentration the same across the experimental conditions. At the end of 5 h, microplates were centrifuged and 100 μl of the supernatant was analyzed using a beta counter. The percentage of cell lysis was calculated as described (Graf et al., 2003). The mean % cytotoxicity values ± SEM are shown.
2.7. Annexin-V staining
Splenic T cells from naïve rats and MDSC co-cultures were prepared and stimulated as described in the add-back experiments. L-NMMA (100 μM) was added to co-cultures as indicated. After 24 h, cells were harvested and stained with anti-CD3- phycoerythrin mAbs, followed by Annexin-V-FITC staining (Annexin V Apoptosis Detection Kit, BD Biosciences) using the supplied protocol. Flow cytometry was used to determine the percentage of CD3 T cells that were Annexin-V+. The mean % of CD3+/Annexin-V+ cells ±SEM of triplicate cultures are shown. Conditioned medium from the cultures was saved for NO analysis.
2.8. Generation of bone marrow chimeric rats and fluorescent in situ hybridization
Female rats were exposed to 6 Gy of whole body irradiation and received an intraperitoneal injection of bone marrow cells harvested from the femurs and humeri of age-matched, syngeneic male rats. Two months later, DNA was purified from a sample of the blood from each chimeric rat (DNeasy, Qiagen, Valencia, CA). Ten ng of genomic DNA was analyzed by PCR (Omniscript RT kit, Qiagen) for the detection of the male sex-determining region Y (SRY) gene. Specific primers used were for the SRY gene located on the rat Y chromosome forward 5′ – CAG AGA TCA GCA AGC ATC TGG – 3′ and reverse 5′ – TCT GGT TCT TGG AGG ACT GG - 3′ to generate a 283 bp fragment. PCR reactions were resolved on a 2% agarose gel and bands were visualized with ethidium bromide. Chimeric rats were then utilized in the T9+vacc model and His48+/CD11bc+ 3 MDSC were purified from the tumor infiltrate by FACS. MDSC were then fixed in methanol/acetic acid (3:1); cytospun onto glass slides; and air dried. Fluorescent in situ hybridization (FISH) was performed using a rat IDetect Chromosome Y FISH Paint Probe conjugated to FITC (ID Labs, Ontario, Canada) according to the manufacture’s protocol. Chromatin were counterstained using Vectashiel/4′-6-Diamidino-2-phenylindole (ID Labs). A total of 500 nuclei were scored for the presence or absence of the Y chromosome signal using a Zeiss Axioskop equipped with 4′-6-Diamidino-2-phenylindole, FITC and dual color filter sets. Spleen cells from a male Fischer rat were used as a positive control.
2.9. RT-PCR
Total RNA was extracted from FACS purified, glioma-infiltrating His48+/CD11bc+ MDSC using an RNAeasy kit (Qiagen) and quantitated spectrophotometrically. RT-PCR was performed using Omniscript RT kit and 1 ng of RNA. Specific primers used were for: IDO forward 5′-CAT GGC GTA TGT GTG GAA CC-3′ and reverse 5′-AGG AGA AGC TGC GAT TTC CA-3′ to generate a 248 bp fragment; arginase I forward 5′-AAA GCC CAT AGA GAT TAT CGG AGC G-3′ and reverse 5′-AGA CAA GGT CAA CGG CAC TGC C-3′ to generate a 892 bp fragment; inducible nitric oxide synthase (iNOS) forward 5′-GCA TGG AAC AGT ATA AGG CAA ACA -3′ and reverse 5′-GTT TCT GGT CGA TGT CAT GAG CAA -3′ to generate a 222 bp fragment; TGF-β forward 5′-CTT CAG CTC CAC AGA GAA GAA CTG C -3′ and reverse 5′-CAC GAT CAT GTT GGA CAA CTG CTC C -3′ to generate a 298 bp fragment; and CD34 forward 5′-GCC CAG TCT GAG GTT AGG CC -3′ and reverse 5′-ATT GGC CTT TCC CTG AGT CT -3′ to generate a 363 bp fragment (Howson et al., 2005; Klasen et al., 2001; Liu et al., 2007; Plain et al., 1997). PCR reactions were resolved on a 2% agarose gel and bands were visualized with ethidium bromide staining.
2.10. Immunoblotting
Splenic T cells from naïve rats and MDSC co-cultures were prepared and stimulated as described above. L-NMMA (50 μM) was added to co-cultures as indicated. After 18 h, cells were harvested: lysed with radio immunoprecipitation assay buffer; and immunoblotting was performed (Prins et al., 2002). Briefly, 20 μg of total protein was resolved on 10% SDS/PAGE gels and transferred to nitrocellulose membranes. The membranes were incubated overnight with primary Abs followed by incubation with a horseradish peroxidase conjugated secondary Ab (Rockland Immunochemicals, Gilbertsville, PA). Immuno-reactive bands were visualized using chemiluminescence (SuperSignal, Pierce Chemicals). The same membranes were re-blotted with a mouse anti-β-actin mAb (Sigma-Aldrich, St. Louis, MO), as described above, and used as a loading control. Primary Abs used to detect the following proteins and their cleavage products: caspase -3, -8, -9 and poly (ADP-ribose) polymerase (PARP) were from Santa Cruz Biotechnology, Santa Cruz, CA.
2.11. Statistics
Statistical analyses were performed using the Student’s t-test. Differences with a p-value <0.05 were considered significant. Results are expressed as means ± SEM. Error bars in figures indicate SEM.
3. Results
3.1. Enhanced proliferative T cell response in the absence of CD11bc+ or His48+ glioma infiltrating cells
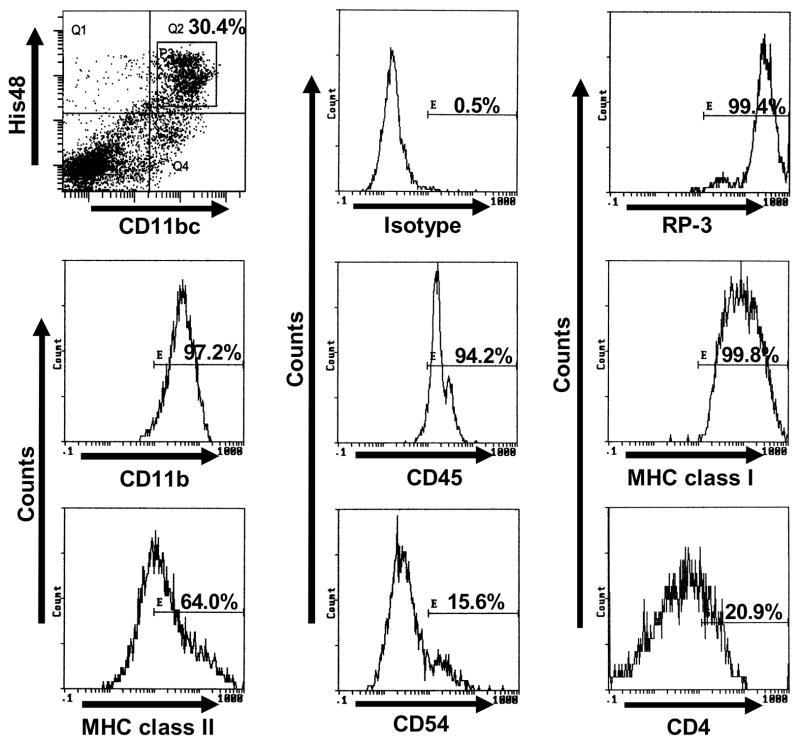
In the T9+vac paradigm, the density of CD4+ and CD8+ T cells in the glioma of vaccinated animals is ~10 times more than in the tumors of non-vaccinated animals; however, the T cells appeared to be tolerant and the gliomas rapidly progress (Prins et al., 2002). In the gliomas of T9+vac animals, we identified a population of His48/CD11bc double positive cells which make up ~30% of the non-lymphocytic, cellular infiltrate (Fig. 2) as compared to ~2% in the T9 tumors of non-immunized animals (Graf et al., 2005).
Figure 2.
Phenotypic analysis of His48+/CD11bc+ myeloid cells in the tumor infiltrate of T9+vac animals. Initial gating was performed on forward scatter and side scatter dot plots to exclude lymphocytes, followed by gating on the His48+/CD11bc+ double positive population (square gate, P3). The linear gate E in the single parameter histograms was set using an isotype control and the percentage of His48+/CD11bc+ positive cells for the indicated surface antigens is shown.
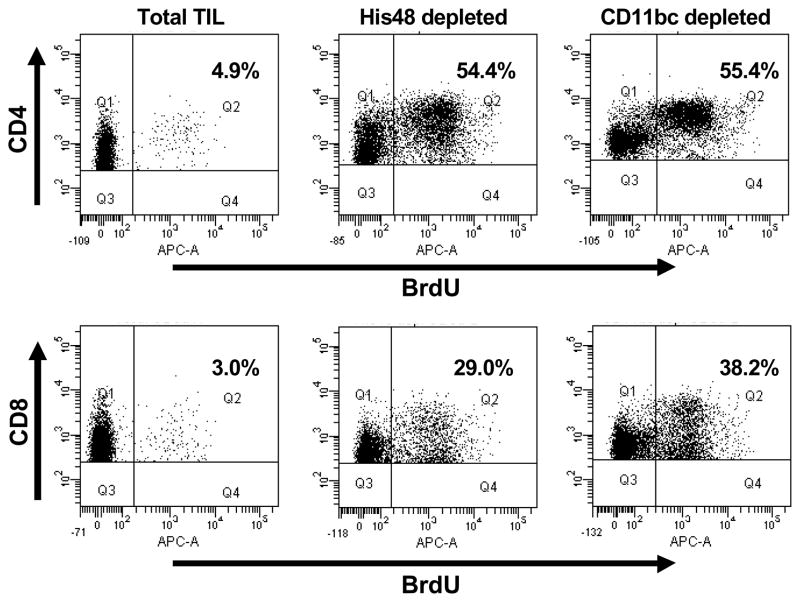
We analyzed the proliferative response of the T cells from the tumor infiltrate of T9+vac animals when stimulated with CD3 and CD28 antibodies by BrdU incorporation. When the total TIL population was used both CD4 and CD8 T cells responded poorly to T cell receptor (TCR) stimulation (Fig. 1). In contrast, depletion of either His48+ or CD11bc+ cells from the TIL population resulted in robust CD4 and CD8 T cell proliferation (Fig. 1). The combined results from three experiments are shown in Table 1. There was no statistical significance in the degree of proliferation of CD4 or CD8 T cells when either His48+ or CD11bc+ cells were depleted. These results suggested that His48+/CD11bc+ myeloid cells found in the glioma infiltrate of the vaccinated animals can specifically inhibit both CD4 and CD8 T cell proliferation in response to non-specific, TCR activation.
Figure 1.
Depletion of CD11bc+ or His48+ cells from the TIL of T9+vac rats enhances the proliferative response of CD4+ and CD8+ T cells. Total TIL was purified from moribund T9+vac rats and depleted of CD11bc+ or His48+ myeloid cells; placed into culture (1×10⁶ cells/ml) and stimulated with CD3 and CD28 mAbs for 3 days. Cultures were pulsed with BrdU for the last 24 h, harvested and stained with anti-CD3, CD4, CD8 and BrdU mAbs; and analyzed by flow cytometry. The incorporation of BrdU was used as a measure of proliferation. Initial gates were set on CD3+/CD4+ or CD3+/CD8+ T cells. Annotated values indicate the percentage of T cells that are positive for BrdU.
Table 1.
Depletion of His48 or CD11bc cells from TIL cultures results in enhanced T cell proliferation.1
| Total | His48 depleted | CD11bc depleted | |
|---|---|---|---|
| CD4 T cells (% ±SE) | 6.67 (0.92) | 55.0 (2.25) | 63.0 (4.02) |
| CD8 T cells (% ±SE) | 3.70 (0.56) | 28.3 (3.31) | 38.9 (2.70) |
Proliferation measured by BrdU incorporation for CD4+ and CD8+ T cells. The mean percentage of BrdU+ CD4 and CD8 cells is shown (±SE, n=3).
3.2. Characterization of the glioma- infiltrating CD11bc+/His48+ myeloid cells
In the T9+vac model, we initially identified cells that were double positive for CD11bc and His48 in the glioma infiltrate as suppressive myeloid cells. To further identify the phenotype of these glioma-associated myeloid cells, we used three color FACS analyses with initial gating on the His48+/CD11bc+ population. Histograms of positive staining are shown in Figure 2 and indicate that the cells strongly express CD11b, CD45, MHC class I and class II, and RP-3. A low level of CD4 and CD54 expression was also detected. His48+/CD11bc+ cells did not express the co-stimulatory molecule CD86 nor did they express CD2, CD3, CD8, CD45RA, CD90 or CD161. RT-PCR analysis of mRNA isolated from His48+/CD11bc+ cells revealed the expression of the CD34 gene (Fig. 3A). The expression of CD34 and a high level of CD45 by the His48+/CD11bc+ cells suggest that they are hematogenous myeloid cells and are not resident CNS microglial cells which are phenotypically CD11bc+ and CD45low (Ford et al., 1995).
Figure 3.
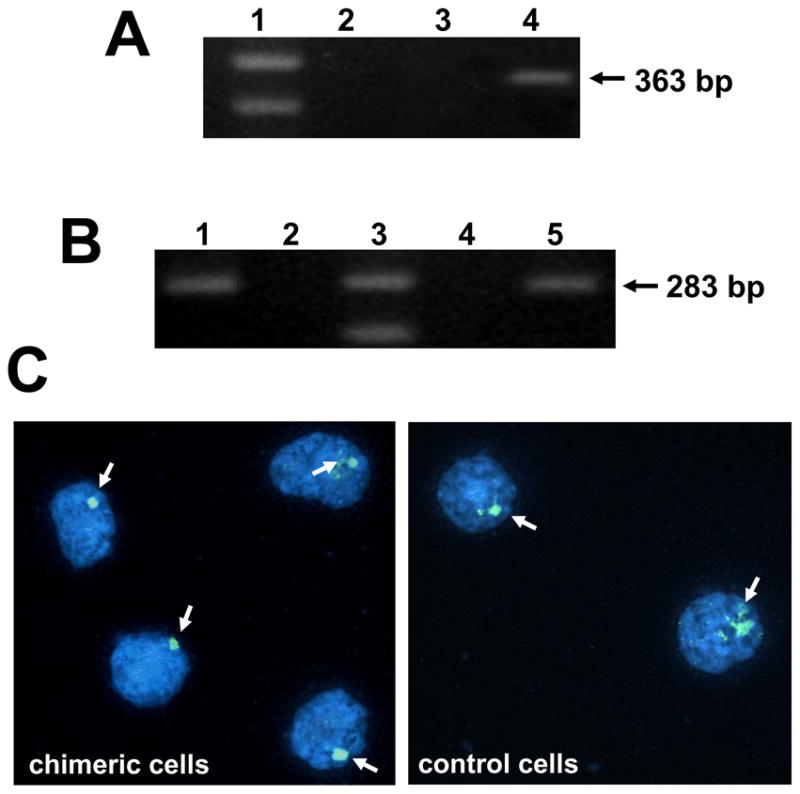
CD11bc+/His48+ TIL are bone marrow derived. A) CD11bc+/His48+ myeloid cells express CD34 transcripts. RNA was extracted from FACS purified CD11bc+/His48+ cells from the TIL of T9+vac animals; total spleen cells or lymphocytes and subjected to RT-PCR using CD34 specific primers to generate a 363 bp fragment. Lanes: 1-marker; 2-lymphocytes; 3-spleen cells; and 4- His48+/CD11bc+ myeloid cells. B) PCR analysis for the presence of the SRY gene (283 bp fragment) was conducted on the DNA obtained from lymphocytes from: male, female or a cross-sex chimeric animal. Lanes: 1-male, positive control; 2-blank; 3-marker; 4-female, negative control; 5 cross-sex chimeric animal. C) Chimeric animals were used in the T9+vac model and CD11bc+/His48+ cells were purified by FACS from the TIL and subjected to FISH analysis for the presence of the Y-chromosome (image on left). Spleen cells from male rat were used as a positive control (image on right). 4′-6-Diamidino-2-phenylindole stained nuclei are shown and arrows indicate positive signals for the Y chromosome. Some positive signals are more dispersed which is often observed with painting probes. Magnification 100x. This experiment was repeated and generated similar results.
To unequivocally determine the source of the glioma-infiltrating His48+/CD11bc+ cells, we constructed bone marrow chimeric rats. In these studies, female Fischer rats were exposed to 6 Gy of whole body radiation and then received a transfer of bone marrow cells from age-matched, male Fischer rats. After 2 months, PCR was performed on the lymphocytes from the recipient animals for the male SYR gene to verify that the female rats were successfully reconstituted with male bone marrow (Fig. 3B). Chimeric animals were then used in the T9+vac model and became moribund in ~14 d. TIL were purified; stained with CD11bc and His48 mAbs; and the double positive population was purified by FACS. The His48+/CD11bc+ cells were then subjected to FISH analysis using a probe specific for the rat Y chromosome and nuclei were scored for the presence or absence of the Y chromosome signal. Of the 500 nuclei analyzed from the chimeric specimen, 89% were positive for the Y chromosome. The cells lacking signal exhibited an altered morphology that was suggestive of compromised viability. In comparison, 95% of the 500 spleen cells analyzed from the male rat were positive for the Y chromosome. Representative images are shown in Figure 3C. These results confirm that the His48+/CD11bc+ cells originated from the bone marrow of the sex-chimeric rats and were not derived from endogenous glial cells. Based upon the origin, phenotype and T cell suppressive capability of the His48+/CD11bc+ cells, we believe that these cells represent tumor-infiltrating MDSC in our rat glioma model.
3.3. Tumor infiltrating MDSC from T9+vac animals suppress T cell effector functions in a contact-independent fashion
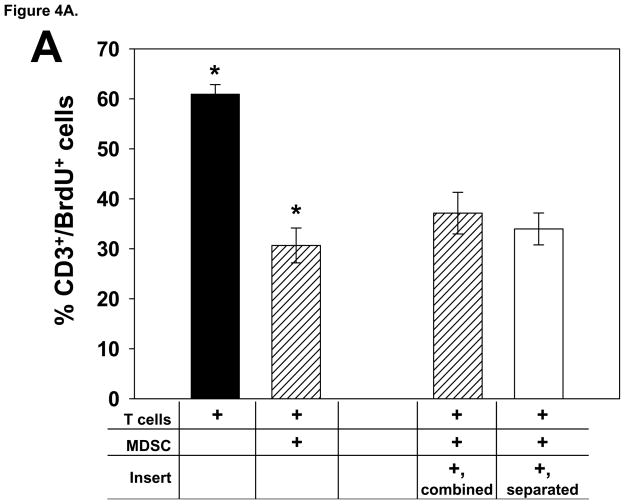
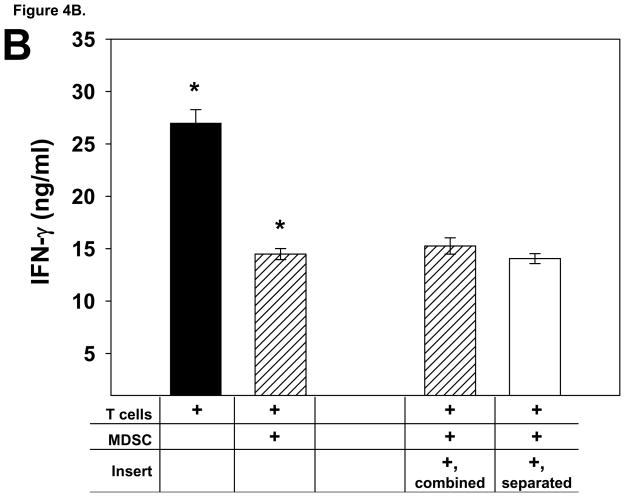
We conducted a series of add-back experiments in order to determine if glioma-infiltrating MDSC from T9+vac animals could inhibit multiple T cell effector functions and if suppression was contact dependent. In proliferation and IFN-γ production studies, MDSC were co-cultured with splenic T cells obtained from naïve animals. T cells were activated with CD3 and CD28 mAbs and the MDSC were either in contact with the T cells or separated from the T cells by a 0.4 μM transwell insert. The results of proliferation studies demonstrated that the MDSC were able to inhibit T cell proliferation in a non-contact dependent fashion (Fig. 4A). Moreover, the level of the T helper 1 cytokine, IFN-γ, was assessed in the conditioned medium from the co-cultures and showed that the MDSC also suppressed the secretion of IFN-γ by the stimulated T cells in a contact-independent manner (Fig. 4B).
Figure 4.
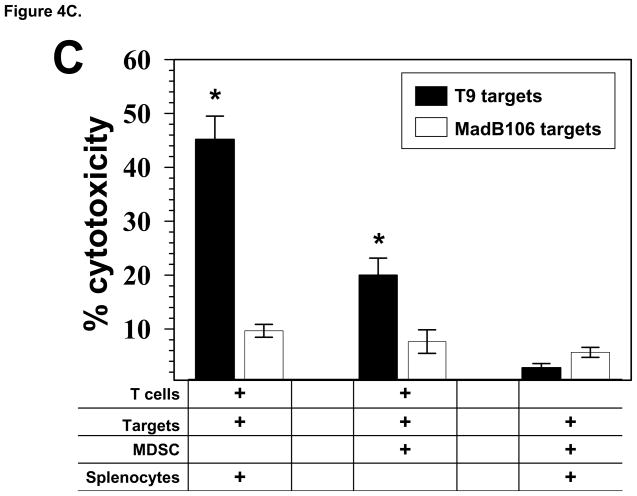
Glioma-infiltrating MDSC suppress the T cell effector functions in add-back experiments. A) T cells from naïve rats (1×10⁶/ml) were co-cultured with and equal number MDSC and stimulated with CD3 and CD28 mAbs for 3 days. Cultures were pulsed with BrdU for the last 24 h. When transwell inserts were used, MDSC were either added to the top chamber to prevent T cell contact or combined with the T cells in the lower chamber. Cells were harvested; stained with anti-CD3 and BrdU mAbs; and analyzed by FACS. The mean percentage of CD3+ T cells that incorporated BrdU is shown for each culture condition, ±SEM. *p<0.002. B) The levels of IFN-γ in the conditioned media from the 3 day, add-back proliferation experiment were determined by ELISA. Mean values of the triplicate cultures are shown, ±SEM. *p<0.005. Representative results from 3 independent experiments are shown. C) Effector T cells (1×10⁶) primed with T9 antigens were used in a 5 h cytoxicity assay in the presence or absence of MDSC (1×10⁶) from the TIL of T9+vac animals using chromium-51 labeled T9 target cells or MadB106 target cells (1×10⁴). Ratios used were Effectors:T9 (100:1), Effectors:MDSC:T9 (100:100:1) and MDSC:T9 (100:1). Irradiated, naïve splenocytes were added to wells as indicated to keep cell concentrations equal in each experimental condition. Similar ratios were used with MadB106 target cells. Mean cytotoxicity values of triplicate conditions ±SEM are shown, *p<0.01. The cytotoxicity assay was performed 3 individual times and yielded similar results.
Standard cytotoxicity assays were conducted to determine if the MDSC could actively inhibit the killing of T9 target cells by tumor-specific T cells. Naïve animals were immunized s.c. with T9 cells and splenic lymphocytes from immunized animals were re-stimulated in vitro with irradiated T9 cells. In the killing assays, effector lymphocytes were cultured with targets at a 100:1 (effector:target) ratio. In specified experimental wells, MDSC and effector cells were combined in equal numbers to achieve a 100:100:1 (MDSC:effector:target) ratio. The results are shown in Fig. 4C and demonstrate that activated lymphocytes effectively lysed T9 targets while only marginal killing was observed towards MadB106 targets. The presence of the MDSC significantly inhibited the killing of T9 target cells by the primed lymphocytes. Additionally, when MDSC alone were combined with T9 or MadB106 target cells, no significant cytotoxicity was detected.
3.4. T cell inhibition by glioma-infiltrating MDSC is mediated by NO production
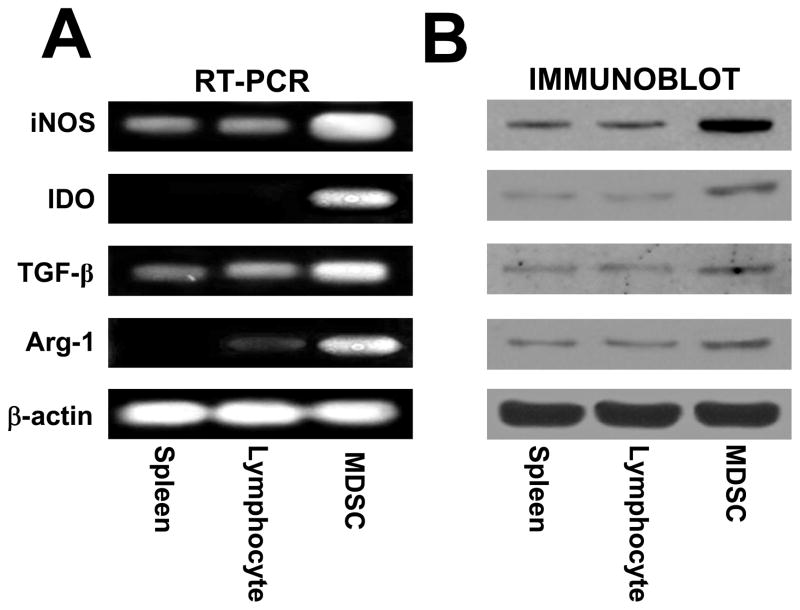
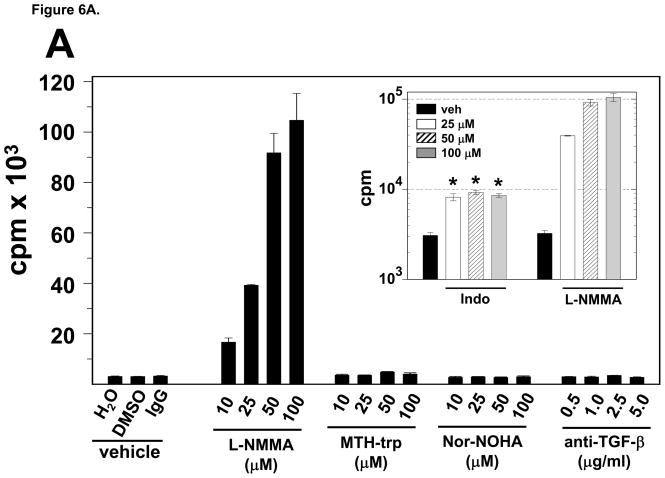
It has been shown that MDSC can suppress T cell function by the production of soluble factors such as TGF-β, arginase 1, IDO or NO (Mazzoni et al., 2002; Mellor and Munn, 2004; Rodriguez and Ochoa, 2008; Xiang et al., 2008). Therefore, we investigated if MDSC from the gliomas of T9+vac rats utilize these mechanisms to suppress T cell function. Analysis of RNA extracted from purified MDSC revealed the expression of TGF-β, arginase 1, IDO and iNOS genes (Fig. 5A). Immunoblotting was then conducted to confirm the presence of these proteins (Fig. 5B). Because, mRNAs encoding TGF-β, arginase 1, IDO and iNOS and their respective proteins were present, we could not rule out the potential role of each soluble factor in T cell suppression. Therefore, we the opted to use neutralizing mAbs for TGF-β or inhibitors of arginase 1, IDO or NOS in proliferation assays in which total TIL from T9+vac animals were stimulated with CD3 and CD28 mAbs. The results, shown in Fig. 6A, demonstrate that in the presence of the NOS inhibitor, L-NMMA, there is a robust T cell proliferative response. The presence of the other inhibitors or TGF-β neutralizing mAbs had little effect on T cell proliferation.
Figure 5.
Glioma-infiltrating MDSC expression of TGF-β, IDO, iNOS and arginase-1. A) RT-PCR analysis of RNA purified from spleen cells or lymphocytes from a naïve rat or CD11bc+/His48+ MDSC purified by FACS using primers specific for iNOS, IDO, TGF-β, arginase-1 (Arg-1) or β-actin for PCR control. B) Immunoblotting of lysates obtained from spleen cells or lymphocytes from a naïve rat or FACS purified CD11bc+/His48+ MDSC using mAbs specific for iNOS, IDO, arginase-1 (Arg-1) or β-actin for a loading control. Representative results from 3 independent experiments are shown.
Figure 6.
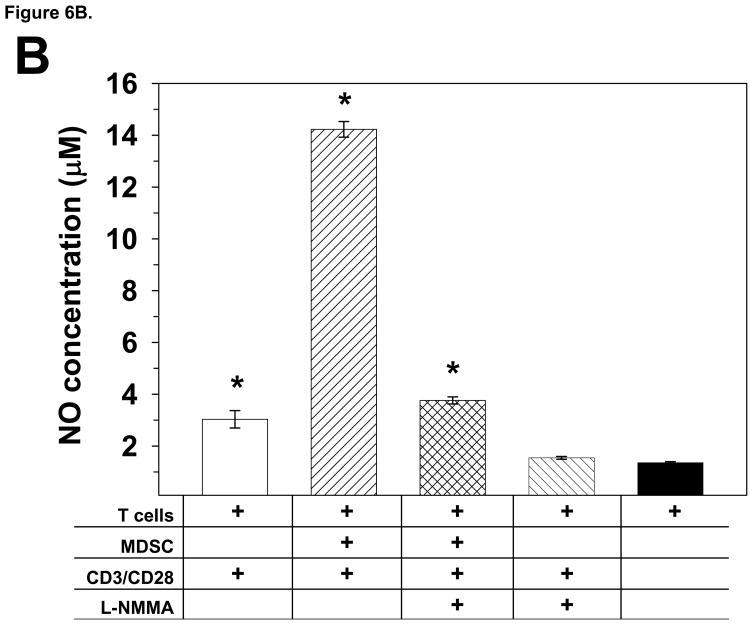
MDSC purified from T9+vac gliomas inhibit T cell proliferation by the production of NO. A) Total TIL (1×10⁶/ml) from T9+vac rats were stimulated with CD3 and CD28 mAbs and used in a 48 h proliferation assay. Titrated concentrations of neutralizing anti-TGF-B mAbs or inhibitors for NOS (L-NMMA); IDO (MTH-trp); arginase-1 (Nor-NOHA); or cyclooxygenase/prostaglandin synthesis [indomethacin, Indo (inset, note log scale) were added to the cultures at the indicated final concentrations. Cultures were pulsed with 3H-thymidne for the last 15 h. Mean cpm values ±SEM of triplicate wells are shown, *p<0.001. B) Splenic T cells from naïve animals (1×10⁶/ml) were cultured in the presence or absence of an equal number of MDSC and were stimulated with CD3 and CD28 mAbs as indicated. L-NMMA (100 μM) was added to select cultures. After 24 h the level of NO was measured in the in the condition medium. The concentration of NO was significantly higher in stimulated T cell/MDSC co-cultures as compared to stimulated T cell cultures or T cell/MDSC co-cultures in the presence of L-NMMA. *p<0.0002. These experiments were conducted at least 3 independent times and yielded similar results.
Myeloid cell-associated prostaglandins may play a direct or indirect role by regulating arginase-1 or NOS expression in immune-suppression (Donkor et al., 2009). To investigate a possible role for prostaglandins in MDSC mediated T cell inhibition, we repeated the proliferation assay with TIL from T9+vac animals in the presence of indomethacin, an agent that blocks prostaglandin synthesis by inhibiting cyclooxygenase (Kulmacz, 1989). The results shown in Figure 6A (inset) indicate that, in the presence of indomethacin, T cell proliferation is increased ~ 4-fold and plateaus. Although this is significant, it is a modest enhancement in proliferation as compared to the ~30-fold increase observed when the NOS inhibitor, L-NMMA is used.
To complement the NOS inhibitor studies, we measured the level of NO in the conditioned medium of stimulated T cells cultured in the presence or absence of equal numbers of MDSC. The results are shown in Fig. 6B in clearly indicate that the cultures containing MDSC have a significantly elevated level of NO as compared to that of control T cell cultures. When L-NMMA was included in the T cell/MDSC co-cultures, the level of NO in the conditioned medium was reduced to levels comparable to that of controls.
3.5. Glioma-infiltrating MDSC induce T cell apoptosis
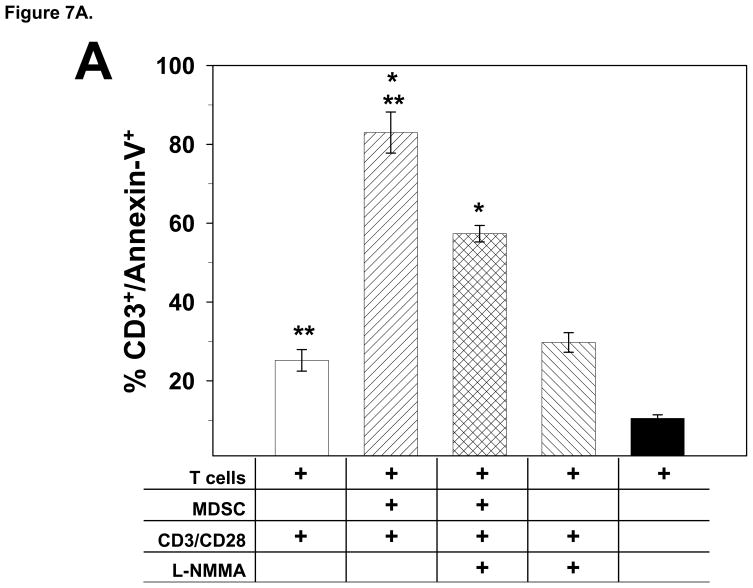
In order to determine if glioma-infiltrating MDSC and associated NO production inhibit T cell function by inducing T cell apoptosis, we analyzed T cells for the translocation of phosphatidylserine to the cell surface, caspase activation and PARP cleavage. Splenic T cells from a naïve rat were stimulated with CD3 and CD28 mAbs in the presence of an equal number of MDSC. After 24 h of co-culture, cells were collected and sequentially stained with anti-CD3 mAb and Annexin-V and analyzed by flow cytometry to determine the percentage of CD3+ T cells that were also Annexin-V+. The results are shown in Fig. 7A, and indicate that ~80% of the T cells in the co-cultures were apoptotic as revealed by their reactivity with Annexin-V. Moreover, the inclusion of the NOS inhibitor L-NMMA in the T cell/MDSC co-cultures significantly decreased the percentage of apoptotic T cells (p<0.02).
Figure 7.
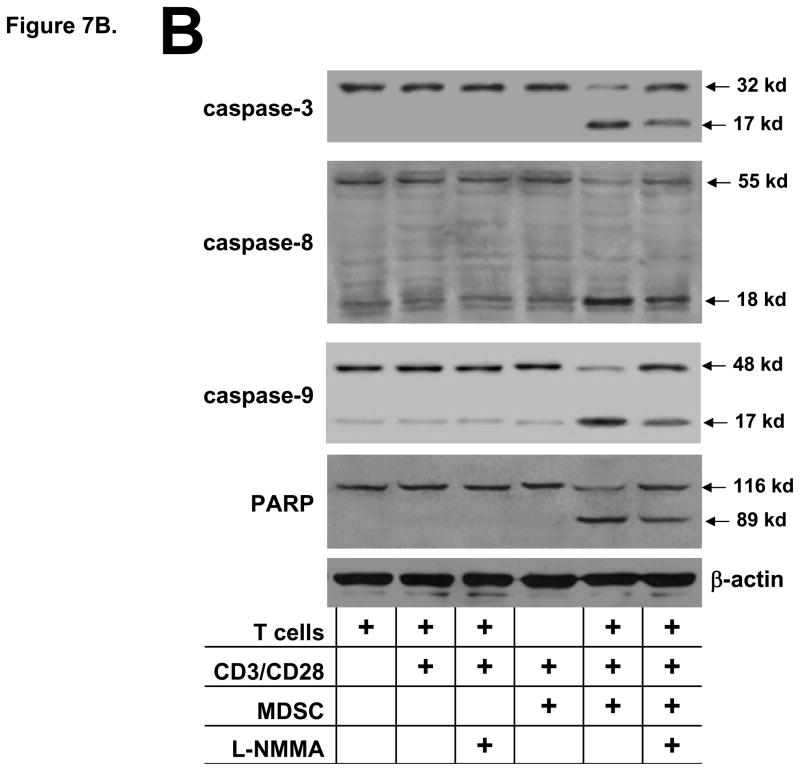
Glioma-infiltrating MDSC induce T cell apoptosis. A) T cells obtained from naïve rats (1×10⁶/ml) were co-cultured in the presence or absence of an equal number MDSC and stimulated with CD3 and CD28 mAbs as indicated for 2 days. Cells were collected; stained with an anti-CD3 mAb and Annexin-V; and were analyzed by flow cytometry. The mean percentage ±SEM of CD3+ T cells that were positive for Annexin-V for each culture condition (performed in triplicate) is shown. *p<0.02, **p<0.002 relative to stimulated T cell/MDSC co-cultures. B) Co-cultures of T cells obtained from naïve rats and MDSC were prepared as described above. After 24 h, cells were collected, lysed and used for immunoblotting for the pro-form and cleavage product of caspase-3, -8 and -9 or PARP processing. An increase of caspase -3, -8 or -9 cleavage and PARP conversion can be detected in the stimulated T cell/MDSC co-cultures and the degree of processing was attenuated by the presence of L-NMMA. These experiments were repeated 2 additional times and generated similar results.
For the analysis of caspase activation and proteolytic processing of PARP, T cell and MDSC co-cultures were prepared as described above. After 24 h of culture, cells were harvested; lysed and immunoblotting was conducted to determine the extent of the activation of initiator caspases 8 and 9; effector caspase 3 and PARP cleavage. The results, shown in Fig. 7B, demonstrate that in cultures containing non-stimulated or activated T cells; activated T cells + L-NMMA; or MDSC only, no processing of caspase 3 or PARP was present and only a small degree of caspase 8 and 9 cleavage was detected. In contrast, in the T cell/MDSC co-cultures, caspase -3, -8 and -9 activation and PARP cleavage was readily detected and the addition of L-NMMA in the T cell/MSC co-cultures attenuated the degree of caspase and PARP processing. The results from the Annexin-V staining and immunoblotting studies strongly suggest that NO production by glioma-infiltrating MDSC inhibit T cell function by the induction of T cell apoptosis.
4. Discussion
Immunization of rats with T9 glioma cells effectively induces protective, T cell-mediated immunity against a subsequent i.c. challenge with viable T9 cells (Denlinger et al., 1975). When the experimental model is altered to that of more clinical relevance, in which animals with an established intracerebral T9 glioma are vaccinated with irradiated T9 cells, tumors progress despite being significantly infiltrated by CD4+ and CD8+ T cells (Prins et al., 2002). In these studies, we identified a population of immature myeloid cells that co-expressed granulocyte and monocyte lineage markers which also infiltrated the gliomas. In the T9+vac model, it appears that the activation of T cells by immunization is required for the mobilization of MDSC since very few (<4%) MDSC can be detected in the spleen or tumor infiltrate of non-vaccinated, animals bearing an i.c. T9 glioma or when nude rats are used in the T9+vac paradigm (Graf et al., 2005; Prins et al., 2002). In this presented report, we characterized the glioma-infiltrating myeloid cells in terms of their: phenotypic profile; tissue of origin; and ability to suppress T cell effector functions. Furthermore, we identified one mechanism by which the glioma-infiltrating myeloid cells inhibit T cell function and induce T cell apoptosis.
The results from the initial proliferations studies clearly demonstrated that the removal of either His48+ of CD11bc+ cells from the TIL significantly enhanced the proliferation of CD4+ and CD8+ T cell populations. These findings suggest that the infiltrating T cells were functionally competent; however, within the tumor environment of the T9+vac animals, they were actively suppressed, at least in part, by glioma-infiltrating His48+ and CD11bc+ myeloid cells. Analysis of the cervical lymph nodes of the T9+vac animals revealed that <1% of the lymph node cells were His48+/CD11bc+ indicating that the intracerebral tumor site, rather than tumor draining lymph nodes, is the location of T cell inhibition by the myeloid cells (M. Graf, unpublished). Subsequent studies using purified, glioma-infiltrating MDSC demonstrated that these cells could suppress the proliferation and IFN-γ production of TCR stimulated T cells in a non-contact dependent manner and inhibit the cytolytic activity of primed lymphocytes.
Flow cytometry was used to identify other surface markers expressed by the His48+/CD11bc+ cells in the T9+vac model and revealed that the cells also expressed the myeloid marker CD11b and the rat granulocyte marker RP3; a low level of CD4 and CD54; and both MHC class molecules but not the co-stimulatory molecule CD86. Microglial cells are commonly found in the infiltrate of gliomas (Watters et al., 2005); however, by using bone marrow chimeric rats in the T9+vac model, we unequivocally confirmed that the His48+/CD11bc+ cells were derived from the bone marrow. Taken collectively, it appears that the tumor-infiltrating His48+/CD11bc+ MDSC in our rat glioma model represent a population of MDSC with neuro-immunoregulatory activity.
There are very few reports of MDSC in the rat. Ghiringhelli et al. (Ghiringhelli et al., 2005) identified a population of immature dendritic cells in BD-IX rats bearing PRoB colon tumors. In this tumor model, the immature myeloid dendritic cells were phenotyped as CD11bc+/MHC class II+ cells which co-expressed CD11b and low levels of co-stimulatory molecules. The presence of granulocyte markers on the immature dendritic cells was not investigated. The immature dendritic cells exerted their immuno-regulatory function by the production of TGF-β, which in turn promoted the generation of T regulatory cells which suppressed T cell activity. The immature dendritic cells in the rat PRoB colon tumor model displayed a similar phenotype to the immunosuppressive myeloid cells described in the T9+vac model. MDSC were recently reported to play a role in rat kidney allograft tolerance. In these studies by Dugast et al. (Dugast et al., 2008), the MDSC were initially phenotyped as CD161(NKRP-1)+/CD86+ non-T cells which expressed CD11a, CD11b, CD172a, His48 and MHC class I but were MHC class II negative. Interestingly, in this allograft model, MDSC suppression of T cell activity was contact-dependent and was mediated by iNOS expression. In the above studies of immunosuppressive myeloid cells in different immunological rat models, the similarities and differences to the MDSC described in the T9+vac model are clear in terms of both phenotype and mechanisms of T cell inhibition.
A similar study was recently conducted using the rat N32 glioma model in which N32 cells were genetically engineered to produce a high level of IFN-γ and the cytokine secreting cells were used as an anti-glioma vaccine. In these studies, it was shown that plastic-adherent spleen cells, putatively splenic macrophages, isolated from animals with progressive gliomas suppressed effector T cell function by the production of nitric oxide (Hegardt et al., 2000). In a subsequent study, Badn et al. (Badn et al., 2007) demonstrated that iNOS inhibition enhanced the anti-tumor immune responses in rats immunized with the IFN-γ secreting N32 glioma cells and that the combined treatment of vaccination and iNOS inhibition extended the survival of rats bearing i.c. N32 gliomas. In the above studies, the presence of glioma-infiltrating MDSC was not investigated.
In several different models of immunosuppression, MDSC have been shown to down-regulate T cell activity by the expression of TGF-β, Arginase 1, IDO or iNOS (Mazzoni et al., 2002; Mellor and Munn, 2004; Rodriguez and Ochoa, 2008; Xiang et al., 2008). By immunoblotting and RT-PCR analysis of proteins and RNA isolated from His48+/CD11bc+ MDSC, we demonstrated that these regulatory myeloid cells express these known, MDSC-derived immunosuppressive factors. Subsequent proliferation studies using total TIL from T9+vac tumors and specific inhibitors or neutralizing mAbs indicated that NO production was the main mechanism by which the myeloid cells mediated the suppression of T cell function. Inhibition of prostaglandin synthesis also alleviated T cell inhibition. It is unclear if this reduction represented a direct effect of prostaglandins on T cells or if it was caused indirectly by modulating NOS expression as suggested by Donkor et al. (Donkor et al., 2009). Nevertheless, the magnitude of the reversal of T cell inhibition by cyclooxygenase inhibition was modest as compared to the effects of NOS inhibition. Down-modulation of T cell activity through NO production by immuno-regulatory myeloid cells has also been reported in models of rat kidney allograft tolerance; murine graft-versus-host bone marrow chimeras; immortalized murine MDSC; and mice bearing fibrosarcomas (Bobe et al., 1999; Dugast et al., 2008; Mazzoni et al., 2002; Zhou et al., 2007). Subsequent add-back studies demonstrated that NO production by MDSC in the T9+vac model induced T cell apoptosis as detected by Annexin-V staining and by immunoblotting for activation of caspases 3, 8, and 9 and PARP processing.
Taken together, the His48+/CD11bc+ immuno-regulatory myeloid cells infiltrating the glioma of T9+vac animals appear to be the rat counterpart to murine MDSC since they are both phenotypically and functionally similar. The MDSC in the T9+vac model regulate T cell inhibition in a non-contact dependent manner by the production of NO and the induction of T cell apoptosis. These findings demonstrate how glioma-infiltrating MDSC may function as neuro-immunoregulatory cells by suppressing T cell activity in the CNS and contribute to the immuno-suppressive environment associated with brain tumors.
Acknowledgments
We would like to thank Kristi Turner for the excellent technical assistance in the FISH analysis. The authors would also like to thank the James and Martha Betts Foundation for their support. This work was supported by the National Cancer Institute at the National Institutes of Health [5R01CA116695 to M.R.G.].
Footnotes
Publisher's Disclaimer: This is a PDF file of an unedited manuscript that has been accepted for publication. As a service to our customers we are providing this early version of the manuscript. The manuscript will undergo copyediting, typesetting, and review of the resulting proof before it is published in its final citable form. Please note that during the production process errors may be discovered which could affect the content, and all legal disclaimers that apply to the journal pertain.
References
- al Ramadi BK, Brodkin MA, Mosser DM, Eisenstein TK. Immunosuppression induced by attenuated Salmonella. Evidence for mediation by macrophage precursors. J Immunol. 1991;146:2737–2746. [PubMed] [Google Scholar]
- Badn W, Visse E, Darabi A, Smith KE, Salford LG, Siesjo P. Postimmunization with IFN-gamma-secreting glioma cells combined with the inducible nitric oxide synthase inhibitor mercaptoethylguanidine prolongs survival of rats with intracerebral tumors. J Immunol. 2007;179:4231–4238. doi: 10.4049/jimmunol.179.6.4231. [DOI] [PubMed] [Google Scholar]
- Barlozzari T, Leonhardt J, Wiltrout RH, Herberman RB, Reynolds CW. Direct evidence for the role of LGL in the inhibition of experimental tumor metastases. J Immunol. 1985;134:2783–2789. [PubMed] [Google Scholar]
- Benda P, Someda K, Messer J, Sweet WH. Morphological and immunochemical studies of rat glial tumors and clonal strains propagated in culture. J Neurosurg. 1971;34:310–323. doi: 10.3171/jns.1971.34.3.0310. [DOI] [PubMed] [Google Scholar]
- Bobe P, Benihoud K, Grandjon D, Opolon P, Pritchard LL, Huchet R. Nitric oxide mediation of active immunosuppression associated with graft-versus-host reaction. Blood. 1999;94:1028–1037. [PubMed] [Google Scholar]
- Cools N, Ponsaerts P, Van Tendeloo VF, Berneman ZN. Balancing between immunity and tolerance: an interplay between dendritic cells, regulatory T cells, and effector T cells. J Leukoc Biol. 2007;82:1365–1374. doi: 10.1189/jlb.0307166. [DOI] [PubMed] [Google Scholar]
- Denlinger RH, Axler DA, Koestner A, Liss L. Tumor-specific transplantation immunity to intracerebral challenge with cells from a methylnitrosourea- induced brain tumor. J Med. 1975;6:249–259. [PubMed] [Google Scholar]
- Donkor MK, Lahue E, Hoke TA, Shafer LR, Coskun U, Solheim JC, Gulen D, Bishay J, Talmadge JE. Mammary tumor heterogeneity in the expansion of myeloid-derived suppressor cells. Int Immunopharmacol. 2009;9:937–948. doi: 10.1016/j.intimp.2009.03.021. [DOI] [PubMed] [Google Scholar]
- Dugast AS, Haudebourg T, Coulon F, Heslan M, Haspot F, Poirier N, Vuillefroy dS, Usal C, Smit H, Martinet B, Thebault P, Renaudin K, Vanhove B. Myeloid-derived suppressor cells accumulate in kidney allograft tolerance and specifically suppress effector T cell expansion. J Immunol. 2008;180:7898–7906. doi: 10.4049/jimmunol.180.12.7898. [DOI] [PubMed] [Google Scholar]
- Filipazzi P, Valenti R, Huber V, Pilla L, Canese P, Iero M, Castelli C, Mariani L, Parmiani G, Rivoltini L. Identification of a new subset of myeloid suppressor cells in peripheral blood of melanoma patients with modulation by a granulocyte-macrophage colony-stimulation factor-based antitumor vaccine. J Clin Oncol. 2007;25:2546–2553. doi: 10.1200/JCO.2006.08.5829. [DOI] [PubMed] [Google Scholar]
- Ford AL, Goodsall AL, Hickey WF, Sedgwick JD. Normal adult ramified microglia separated from other central nervous system macrophages by flow cytometric sorting. Phenotypic differences defined and direct ex vivo antigen presentation to myelin basic protein-reactive CD4+ T cells compared. J Immunol. 1995;154:4309–4321. [PubMed] [Google Scholar]
- Gandhi R, Anderson DE, Weiner HL. Cutting Edge: Immature human dendritic cells express latency-associated peptide and inhibit T cell activation in a TGF-beta-dependent manner. J Immunol. 2007;178:4017–4021. doi: 10.4049/jimmunol.178.7.4017. [DOI] [PubMed] [Google Scholar]
- Ghiringhelli F, Puig PE, Roux S, Parcellier A, Schmitt E, Solary E, Kroemer G, Martin F, Chauffert B, Zitvogel L. Tumor cells convert immature myeloid dendritic cells into TGF-beta-secreting cells inducing CD4+CD25+ regulatory T cell proliferation. J Exp Med. 2005;202:919–929. doi: 10.1084/jem.20050463. [DOI] [PMC free article] [PubMed] [Google Scholar]
- Gomez GG, Kruse CA. Mechanisms of malignant glioma immune resistance and sources of immunosuppression. Gene Ther Mol Biol. 2006;10:133–146. [PMC free article] [PubMed] [Google Scholar]
- Graf MR, Prins RM, Poulsen GA, Merchant RE. Contrasting effects of interleukin-2 secretion by rat glioma cells contingent upon anatomical location: accelerated tumorigenesis in the central nervous system and complete rejection in the periphery. J Neuroimmunol. 2003;140:49–60. doi: 10.1016/s0165-5728(03)00167-x. [DOI] [PubMed] [Google Scholar]
- Graf MR, Sauer JT, Merchant RE. Tumor infiltration by myeloid suppressor cells in response to T cell activation in rat gliomas. J Neurooncol. 2005;73:29–36. doi: 10.1007/s11060-007-9442-z. [DOI] [PubMed] [Google Scholar]
- Hegardt P, Widegren B, Sjogren HO. Nitric-oxide-dependent systemic immunosuppression in animals with progressively growing malignant gliomas. Cell Immunol. 2000;200:116–127. doi: 10.1006/cimm.2000.1625. [DOI] [PubMed] [Google Scholar]
- Howson KM, Aplin AC, Gelati M, Alessandri G, Parati EA, Nicosia RF. The postnatal rat aorta contains pericyte progenitor cells that form spheroidal colonies in suspension culture. Am J Physiol Cell Physiol. 2005;289:C1396–C1407. doi: 10.1152/ajpcell.00168.2005. [DOI] [PubMed] [Google Scholar]
- Klasen S, Hammermann R, Fuhrmann M, Lindemann D, Beck KF, Pfeilschifter J, Racke K. Glucocorticoids inhibit lipopolysaccharide-induced up-regulation of arginase in rat alveolar macrophages. Br J Pharmacol. 2001;132:1349–1357. doi: 10.1038/sj.bjp.0703951. [DOI] [PMC free article] [PubMed] [Google Scholar]
- Ko JS, Zea AH, Rini BI, Ireland JL, Elson P, Cohen P, Golshayan A, Rayman PA, Wood L, Garcia J, Dreicer R, Bukowski R, Finke JH. Sunitinib mediates reversal of myeloid-derived suppressor cell accumulation in renal cell carcinoma patients. Clin Cancer Res. 2009;15:2148–2157. doi: 10.1158/1078-0432.CCR-08-1332. [DOI] [PubMed] [Google Scholar]
- Kulmacz RJ. Topography of prostaglandin H synthase. Antiinflammatory agents and the protease-sensitive arginine 253 region. J Biol Chem. 1989;264:14136–14144. [PubMed] [Google Scholar]
- Liu H, Xue ZT, Sjogren HO, Salford LG, Widegren B. Low dose Zebularine treatment enhances immunogenicity of tumor cells. Cancer Lett. 2007;257:107–115. doi: 10.1016/j.canlet.2007.07.013. [DOI] [PubMed] [Google Scholar]
- Luptrawan A, Liu G, Yu JS. Dendritic cell immunotherapy for malignant gliomas. Rev Recent Clin Trials. 2008;3:10–21. doi: 10.2174/157488708783330530. [DOI] [PubMed] [Google Scholar]
- Makarenkova VP, Bansal V, Matta BM, Perez LA, Ochoa JB. CD11b+/Gr-1+ myeloid suppressor cells cause T cell dysfunction after traumatic stress. J Immunol. 2006;176:2085–2094. doi: 10.4049/jimmunol.176.4.2085. [DOI] [PubMed] [Google Scholar]
- Mazzoni A, Bronte V, Visintin A, Spitzer JH, Apolloni E, Serafini P, Zanovello P, Segal DM. Myeloid suppressor lines inhibit T cell responses by an NO-dependent mechanism. J Immunol. 2002;168:689–695. doi: 10.4049/jimmunol.168.2.689. [DOI] [PubMed] [Google Scholar]
- Mellor AL, Munn DH. IDO expression by dendritic cells: tolerance and tryptophan catabolism. Nat Rev Immunol. 2004;4:762–774. doi: 10.1038/nri1457. [DOI] [PubMed] [Google Scholar]
- Nagaraj S, Gabrilovich DI. Myeloid-derived suppressor cells. Adv Exp Med Biol. 2007;601:213–223. doi: 10.1007/978-0-387-72005-0_22. [DOI] [PubMed] [Google Scholar]
- Okada H, Pollack IF. Cytokine gene therapy for malignant glioma. Expert Opin Biol Ther. 2004;4:1609–1620. doi: 10.1517/14712598.4.10.1609. [DOI] [PubMed] [Google Scholar]
- Plain KM, Fava L, Spinelli A, He XY, Chen J, Boyd R, Davidson CL, Hall BM. Induction of tolerance with nondepleting anti-CD4 monoclonal antibodies is associated with down-regulation of TH2 cytokines. Transplantation. 1997;64:1559–1567. doi: 10.1097/00007890-199712150-00009. [DOI] [PubMed] [Google Scholar]
- Prins RM, Scott GP, Merchant RE, Graf MR. Irradiated tumor cell vaccine for treatment of an established glioma. II Expansion of myeloid suppressor cells that promote tumor progression. Cancer Immunol Immunother. 2002;51:190–199. doi: 10.1007/s00262-002-0270-x. [DOI] [PMC free article] [PubMed] [Google Scholar]
- Rodriguez PC, Ochoa AC. Arginine regulation by myeloid derived suppressor cells and tolerance in cancer: mechanisms and therapeutic perspectives. Immunol Rev. 2008;222:180–191. doi: 10.1111/j.1600-065X.2008.00608.x. [DOI] [PMC free article] [PubMed] [Google Scholar]
- Selznick LA, Shamji MF, Fecci P, Gromeier M, Friedman AH, Sampson J. Molecular strategies for the treatment of malignant glioma--genes, viruses, and vaccines. Neurosurg Rev. 2008;31:141–155. doi: 10.1007/s10143-008-0121-0. [DOI] [PMC free article] [PubMed] [Google Scholar]
- Sonabend AM, Rolle CE, Lesniak MS. The role of regulatory T cells in malignant glioma. Anticancer Res. 2008;28:1143–1150. [PubMed] [Google Scholar]
- Stupp R, Hegi ME, Mason WP, van den Bent MJ, Taphoorn MJ, Janzer RC, Ludwin SK, Allgeier A, Fisher B, Belanger K, Hau P, Brandes AA, Gijtenbeek J, Marosi C, Vecht CJ, Mokhtari K, Wesseling P, Villa S, Eisenhauer E, Gorlia T, Weller M, Lacombe D, Cairncross JG, Mirimanoff RO. Effects of radiotherapy with concomitant and adjuvant temozolomide versus radiotherapy alone on survival in glioblastoma in a randomised phase III study: 5-year analysis of the EORTC-NCIC trial. Lancet Oncol. 2009;10:459–466. doi: 10.1016/S1470-2045(09)70025-7. [DOI] [PubMed] [Google Scholar]
- Surawicz TS, Davis F, Freels S, Laws ER, Jr, Menck HR. Brain tumor survival: results from the National Cancer Data Base. J Neurooncol. 1998;40:151–160. doi: 10.1023/a:1006091608586. [DOI] [PubMed] [Google Scholar]
- Thomas DL, Kranz DM, Roy EJ. Experimental manipulations of afferent immune responses influence efferent immune responses to brain tumors. Cancer Immunol Immunother. 2008;57:1323–1333. doi: 10.1007/s00262-008-0467-8. [DOI] [PMC free article] [PubMed] [Google Scholar]
- Watters JJ, Schartner JM, Badie B. Microglia function in brain tumors. J Neurosci Res. 2005;81:447–455. doi: 10.1002/jnr.20485. [DOI] [PubMed] [Google Scholar]
- Xiang X, Poliakov A, Liu C, Liu Y, Deng ZB, Wang J, Cheng Z, Shah SV, Wang GJ, Zhang L, Grizzle WE, Mobley J, Zhang HG. Induction of myeloid-derived suppressor cells by tumor exosomes. Int J Cancer. 2008;124:2621–2633. doi: 10.1002/ijc.24249. [DOI] [PMC free article] [PubMed] [Google Scholar]
- Zea AH, Rodriguez PC, Atkins MB, Hernandez C, Signoretti S, Zabaleta J, McDermott D, Quiceno D, Youmans A, O’Neill A, Mier J, Ochoa AC. Arginase-producing myeloid suppressor cells in renal cell carcinoma patients: a mechanism of tumor evasion. Cancer Res. 2005;65:3044–3048. doi: 10.1158/0008-5472.CAN-04-4505. [DOI] [PubMed] [Google Scholar]
- Zhou R, He PL, Ren YX, Wang WH, Zhou RY, Wan H, Ono S, Fujiwara H, Zuo JP. Myeloid suppressor cell-associated immune dysfunction in CSA1M fibrosarcoma tumor-bearing mice. Cancer Sci. 2007;98:882–889. doi: 10.1111/j.1349-7006.2007.00465.x. [DOI] [PMC free article] [PubMed] [Google Scholar]
- Zhu B, Bando Y, Xiao S, Yang K, Anderson AC, Kuchroo VK, Khoury SJ. CD11b+Ly-6C(hi) suppressive monocytes in experimental autoimmune encephalomyelitis. J Immunol. 2007;179:5228–5237. doi: 10.4049/jimmunol.179.8.5228. [DOI] [PubMed] [Google Scholar]


