Abstract
Cluster-size dependent behavior of pancreatic β-cells has direct implications in islet transplantation therapy for type I diabetes treatment. Control over the cluster-size enables evaluation of cluster-size dependent function, ultimately leading to the production of β-cell clusters with improved transplant efficacy. This work for the first time demonstrates the use of microcontact printing-based cell patterning of discrete two and three-dimensional clusters of pancreatic β-cells. Both single and multiple cell layers are confined to a 2D area by attaching to patterns of covalently linked laminin and not adhering to surrounding polyethylene glycol. Cell clusters were successfully formed within 24 hours for printed patterns in the range 40-120 μm, and simple modulation of the initial cell seeding density leads to the formation of multiple cell layers. Semi-quantitative fluorescence microscopy, x-ray photoelectron spectroscopy, and fourier-transform infrared spectroscopy were used to extensively characterize the surface chemistry. This technique offers exceptional control over cell cluster shape and size and provides an effective tool to study not only the cluster-size dependent behavior of pancreatic β-cells, but also has potential applicability to numerous other cell lines.
Keywords: Pancreatic, β-cell, Insulinoma, Insulin, Microcontact Printing, Cell Cluster, Cell Patterning, INS-1, 832/13, Multilayered
1. Introduction
Type I diabetes is characterized by the absence of insulin production from the pancreas. The current standard of care requires frequent monitoring of a patient's blood-glucose level by measuring blood obtained from a finger-prick. Current technologies for delivering an appropriate amount of insulin also depend on diligent patient compliance. There have been significant efforts towards improving therapy by transplanting islets that comprise a majority of functional glucose-responsive insulin-secreting pancreatic β-cells1. Since the Edmonton protocol showed 7 islet transplant recipients with insulin independence for a full year in 19992, numerous centers now offer this therapy to patients with severe type I diabetes. Approximately 80% of patients receiving this treatment achieve insulin independence within the first year3. However, long-term clinical success is limited and numerous challenges remain before this therapy can be applied to a larger population1. In particular, the size-dependent behavior of pancreatic β-cell transplanted clusters is a major challenge4, as islets lose their vasculature upon explantation and do not sufficiently revascularize after transplantation5. As a result, cells on the inside of larger clusters are typically nutrient-deprived and insulin secretion declines as the size of an islet exceeds 50-100 μm4.
It is well established that the sensitivity of pancreatic β-cells to secrete insulin in response to glucose stimulation is highly dependent on cell-cell contact. For example, β-cell pairs and monolayers have a greater glucose stimulated insulin secretion (GSIS) response than single β-cells6-7, and 3-D β-cell clusters secrete greater insulin than β-cell monolayers8. Mechanistic evaluations have revealed the importance of junction proteins, such as Cx369-10 and E-cadherins7, on insulin production from β-cells. One β-cell model predicts a lower limit of four β-cells in contact with each other to achieve coordinated insulin secretion11. These studies therefore emphasize the need to optimize β-cell cluster size to maintain cell function and maximize cell response.
Immobilization of cell-adhesive proteins on a surface to defined areas can be achieved through a process called microcontact printing and was originally developed by the Whitesides group in 199412. Since then, the process has successfully produced cell patterns from a variety of cell types including endothelial cells13-14, fibroblasts15, and HeLA cells16. Various surface chemistry techniques have been developed on gold12-14,17-18, silver13, silicon oxide/glass18, polydimethylsiloxane (PDMS)19 and applicable to multiple substrates20, where the chemistry plays a critical role in cell adhesion. A tool that achieves controlled and reproducible 3D cell clusters of arbitrary size can have significant impact in the understanding of pancreatic β-cell function. While the hanging-drop technique has enabled the creation of 3D cell clusters of a specific size21, the creation of varied 3D cell cluster sizes has not been shown.
This study develops and characterizes an approach for pancreatic β-cell patterning in the range 40-120 μm by utilizing microcontact printing of proteins. The rat insulinoma cell line 832/13 was used because it exhibits glucose stimulated insulin secretion at physiologically relevant glucose concentrations22. Here, the cell-adhesive protein laminin was printed as it is a common ligand for α3β1 integrins that are expressed by 832/13 cells as well as primary β-cells23. Variations of cell seeding densities were used to promote the formation of multilayered cell clusters, allowing the effect of cluster size to be studied while maintaining constant area of attachment. The approach presented here demonstrates a method that effectively controls cluster size, potentially providing an avenue to better understand pancreatic β-cell behavior and function that has major implications for islet transplantation therapy.
2. Materials and Methods
Materials
The following materials and chemicals were used as received: microscope cover glass (22 mm × 22 mm, No. 1.5; Fisher Scientific, Pittsburgh, PA), 3” silicon <111> p-type wafer (Addison Engineering, San Jose, CA), 3-aminopropyltriethoxysilane (APTES; Sigma-Aldrich, St. Louis, MO), glutaraldehyde (solution grade I 50%; Sigma-Aldrich, St. Louis, MO), SU-8 2010 and SU-8 developer (Microchem, Newton, MA), Sylgard 184 silicone elastomer kit (base and cross-linker; Dow Corning, Midland, MI), methoxypoly(ethylene glycol) amine (mPEG-amine, MW 5000; Fluka, Buchs, Switzerland), sodium cyanoborohydride (Sigma-Aldrich, St. Louis, MO), acetone (histological grade; Fisher Scientific, Fair Lawn, NJ), isopropanol (IPA; VWR Internationl, Westchester, PA), ethanol (A.C.S. Reagent; Sigma-Aldrich, Sheboygan Falls, WI), fluorescein isothiocyanate-bovine serum albumin (FITC-BSA; Sigma-Aldrich, St. Louis, MO), mouse laminin (1 mg/mL; Invitrogen, Carlsbad, CA), fetal bovine serum (FBS; Hyclone Laboratories, South Logan, UT), 2-mercaptoethanol (Sigma-Aldrich, France), sodium-pyruvate, penicillin/streptomycin, RPMI-1640 with HEPES, 0.05% trypsin-EDTA and l-glutamine (UCSF Cell Culture Facility, San Francisco, CA), immunoglobulin G (IgG) free BSA (Sigma-Aldrich, St. Louis, MO), dipotassium phosphate (Sigma-Aldrich, Japan), sodium chloride (Sigma-Aldrich, St. Louis, MO), Tween 20 (Sigma-Aldrich, St. Louis, MO), mouse monoclonal anti-insulin IgG (SPM139, Santa Cruz Biotech, Santa Cruz, CA), donkey anti-mouse IgG Alexa Fluor 488 (Invitrogen, Eugene, OR), Alexa Fluor 568 phalloidin (Invitrogen, Eugene, OR), and SlowFade Gold antifade reagent with DAPI (Invitrogen, Eugene, OR).
Cleaning of glass cover slips
Glass cover slips were sonicated in a 70:30 ethanol:Milli-Q water (Millipore, Bedford MA) solution for 10 minutes, then dried for 30 minutes at 120°C. Following this, cover slips were then cleaned in oxygen plasma at 175-200 W and 0.5 mTorrr for 30 seconds (Plasmaline, TCGAL Corporation).
Preparation of aldehyde-terminated glass cover slips
Clean dry glass cover slips were silanized in a freshly prepared solution of APTES (2% v/v) in acetone for 5 minutes, followed by two acetone washes and a 2 minute sonication in acetone. Cover slips were then dried at 120°C for 1 hour, then dried for a further 24 hours under vacuum at room temperature. The amine-terminated cover slips were sonicated for 10 minutes in Milli-Q water before incubation for 1 hour at room temperature in 10% glutaraldehyde in phosphate-buffered saline (PBS). The aldehyde-terminated cover slips were sonicated again for 10 minutes in Milli-Q water and then dried with a stream of N2.
Preparation of PDMS stamp for microcontact printing of laminin
PDMS stamps were fabricated through a multi-step process that uses photolithography and micropatterning techniques. Firstly, a negative photoresist SU-8 2010 was spin cast onto a silicon wafer at 2000 rpm for 1 minute yielding a thickness of approximately 11 μm as determined by profilometry (Ambios XP-2, Ambiostech, Santa Cruz, CA). SU-8 films were pre-baked on a hot-plate at 95°C for 3 minutes, exposed to a UV light for 30 seconds at an intensity of 5 mW·cm−1, and then post-baked at 95°C for 4 minutes. This unpatterned SU-8 layer facilitates adhesion of the subsequent patterned layer and improves pattern uniformity. A second layer of SU-8 was then spin cast at 2000 rpm for 1 minute and pre-baked at 95°C for 2 minutes. SU-8 films were subsequently patterned by exposure to UV light through a transparency mask defining 20, 40, 60, and 120 μm patterns. Patterned SU-8 films were post-baked at 95°C for 4 minutes and then immersed in SU-8 developer for 2 minutes to remove uncrosslinked SU-8. Wafers were subsequently rinsed with SU-8 developer, IPA, and dried with a stream of N2. Lastly, the wafers were baked at 150°C for 15-20 minutes.
An inverse pattern of the silicon wafer was prepared with PDMS. The base and curing agent were mixed at a 10:1 by mass and deposited onto the micropatterned wafers. The PDMS film was then de-gassed under vacuum for 1-2 hours to remove all bubbles, and then cured at 70°C for 2 hours at atmospheric pressure. Once cured, the PDMS was cut and peeled from the silicon master.
Covalent attachment of laminin by microcontact printing
Following exposure of PDMS stamps to the above O2 plasma for 30 seconds at 175-200 W and 0.5 mTorr, the surface was covered with a solution of 200 μg/mL laminin in PBS and incubated for 30 minutes at room temperature. A Kimwipe was used to wick away excess solution before drying the remaining liquid with N2. Immediately after drying, the PDMS stamps were carefully placed on the aldehyde-terminated cover slip with a 10 g weight for 30 minutes at room temperature. The stamps were then carefully peeled off, leaving printed laminin.
Covalent attachment of PEG
After PDMS stamping of laminin on aldehyde-terminated cover slips, the cover slips were covered with 75 μL of 3 mM mPEG-amine in methanol and excess sodium cyanoborohydride (>8 mM) to quench unreacted aldehyde groups. Cover slips were incubated overnight (>12 hours) in a fume hood due to hydrogen cyanide gas production, subsequently sonicated for 5 minutes in methanol, and lastly rinsed with methanol before being dried with N2.
Fluorescent imaging of cover slips
Cover slips with printed laminin were immersed in a 20 μg/mL FITC-BSA solution before and after PEG functionalization for 20 minutes and sonicated in PBS for 5 minutes before semi-quantitative analysis of images were taken with a spectral confocal microscope (Nikon C1si, Melville, NY). The mean intensities of the images were quantified using NIS-elements software (Nikon, Melville, NY) by evaluating the average intensity of three representative areas from each image. The settings on the camera were maintained between images, which were all acquired within the hour.
Cell culture and seeding onto microcontact printed slides
INS-1 (832/13) cells were cultured with RPMI-1640 medium supplemented with 25 mM HEPES, 10% FBS, sodium-pyruvate, penicillin, streptomycin, and 2-mercaptoethanol 22. Cells were trypsinized in a 0.05% trypsin–EDTA solution, re-suspended in the above media and 1 mL of the cell solution was seeded onto the patterned cover slips within a 12-well plate. The cells were cultured in an incubator at 37°C with 5% CO2.
Fixing of cells for imaging
Cells were fixed with a solution of 3.7% formaldehyde in PBS solution for 15 minutes. After thoroughly rinsing with PBS, the cells were permeabilized with 0.5% Triton X-100 solution for 15 minutes and rinsed again with PBS.
Fluorescent imaging of cells
After fixing and permeabilizing, the cells were immunostained for insulin. Cells were initially immersed in BSA-buffer (5% immunoglobulin G (IgG) free BSA, 13 mM dipotassium phosphate, 150 mM sodium chloride and 0.2% Tween 20, pH 7.5; same buffer used as follows unless otherwise specified) for 20 minutes at room temperature. Mouse monoclonal anti-insulin IgG was then introduced at 5 μg/mL into the above BSA-buffer and rotated at 4°C overnight. The cells were then rinsed thoroughly with BSA-buffer prior to addition of donkey anti-mouse IgG Alexa Fluor 488 at 2 μg/mL in BSA-buffer for 20 minutes on a shaker at room temperature. The cells were rinsed with BSA-buffer before staining the actin cytoskeleton with Alexa Flour 568 Phalloidin (165 nM) for 50 minutes, followed by a second PBS rinse. SlowFade Gold antifade reagent with DAPI was deposited (6 μL) onto a microscope slide and then a cover glass was placed on top of the drop. Nail polish was used to adhere the cover glass to the microscope slide. Cell clusters were then visualized by spectral confocal microscopy.
Surface Characterization
The static water contact angle of the prepared cover slips at each surface chemistry stage were measured as the average of three independently prepared slides using a Tantec model CAM-Micro goniometer. Static water contact angle measurements are displayed as averages ± equipment measurement error, which was larger than the standard deviations. All IR spectra were obtained using a Nicolet Nexus (Thermo Electron Corporation, Hayward, CA). Germanium Attenuated Total Reflection Fourier Transform Infrared Spectroscopy (GATR-FTIR) with wire-grid polarizer was detected with a deuterated triglycine sulfate detector (DTGS) and analyzed using OMNIC version 7.0 software. Spectra were obtained in the range 800-3200 cm−1 at a resolution of 8 cm−1. All spectra were acquired with an atmospheric background. Chemical characterization was performed using a Surface Science Instruments S-Probe monochromatized X-ray photoelectron spectrometer (XPS), with a Al(k-α) radiation (1486 eV) probe.
3. Results and Discussion
Covalent attachment of laminin and PEG
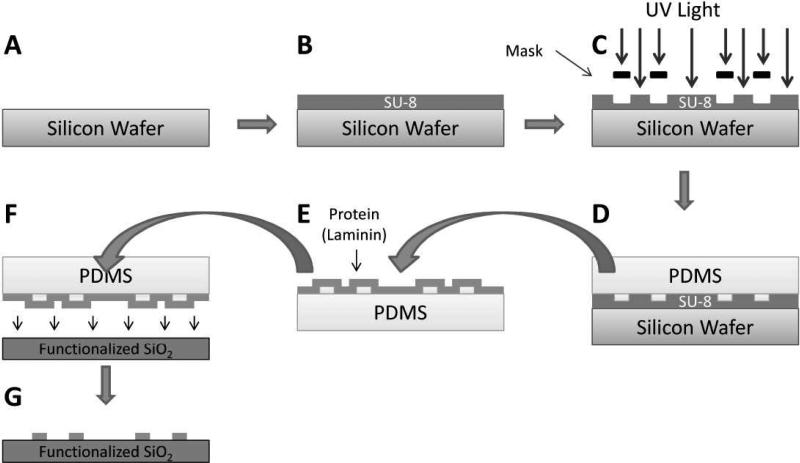
Patterning of laminin on glass cover slips through microcontact printing is presented in Figure 1. Briefly, patterned SU-8 (Figure 1A-C) on silicon is used as a mold to create a polydimethylsiloxane (PDMS) stamp that adsorbs a monolayer of laminin solution (Figure 1D & E) and then stamped and transferred onto a functionalized glass cover slip (Figure 1F & G). This method creates discrete regions of protein defined by the mask used in the lithographic process. Aldehyde linker chemistry is employed to covalently attach laminin to the glass cover slip as represented in Figure 2. Quenching of exposed non-printed aldehydes was achieved using mPEG-amine. Sodium cyanoborohydride is then used to reduce the Schiff base formed between the amine and the aldehyde into a stable imine bond24.
Figure 1.
A clean silicon wafer (A) is spin-cast with SU-8 (B) followed by selective photopolymerization of SU-8 by UV light (C). PDMS is deposited and cured on top of the SU-8 microfabricated mold (D), is subsequently peeled off, and the patterned PDMS is incubated in a protein solution (E). Dried protein solution on the PDMS is then stamped (F) and transferred to a functionalized glass cover slip (G).
Figure 2.
Glass cover slip is cleaned with oxygen plasma (A), and APTES is deposited to form an exposed amine (B). Glutaraldehyde incubation results in an exposed aldehyde (C). Amines located within the amino acids of the printed protein bind to the exposed aldehydes (D) and mPEG-amine passifies the remaining aldehydes after sodium cyanoborohydride reduction reduces the Schiff bases to stable imines (E).
Characterization of covalent attachment of laminin patterns and PEG were performed on functionalized glass cover slips for contact angle and cell attachment and on silicon wafers for XPS and FTIR characterization. Table 1 shows static water contact angles for each functionalization step. Oxygen plasma thoroughly cleaned the substrates as verified by excellent hydrophilicity (water contact angle <5°). The surface increased in hydrophobicity after APTES deposition and then had greater hydrophilicity after PEG deposition, both consistent with what has been reported elsewhere18,25.
Table 1.
Static water-contact angles for functionalized glass cover slips.
| Layer | θsta [°] |
|---|---|
| O2 Plasma Cleaned | <5 |
| APTES | 40 ± 2 |
| Glutaraldehyde | 50 ± 2 |
| Printed Laminin | 57 ± 2 |
| PEG | 26 ± 2 |
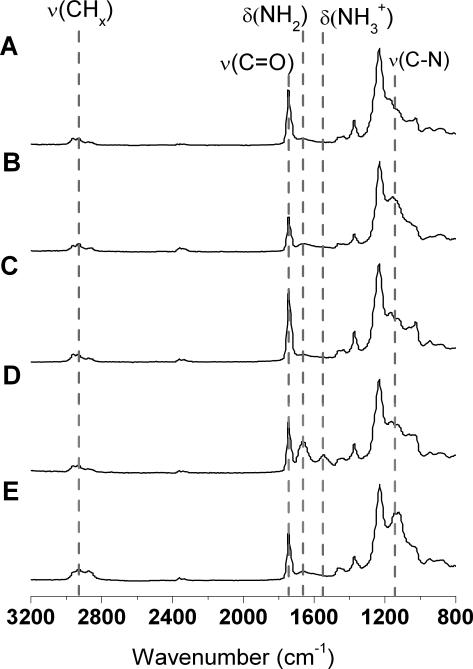
Typical FTIR spectra of the step-wise surface functionalization are shown in Figure 3. Upon exposure to an oxygen plasma (Figure 3A), the silicon surface shows characteristic peaks at 1050 cm−1 and 840 cm−1, which correspond to the expected Si-O stretching and bending, respectively. Incubation of the silicon surface with APTES (Figure 3B) resulted in the appearance of a small peak corresponding to N-H bending vibration at 1650 cm−1 and a larger peak at 1157 cm−1 related to a C-N stretch. Subsequent addition of glutaraldehyde (Figure 3C) resulted in an increase in the C=O stretching vibration and the disappearance of the small N-H bending vibration. This result is consistent with the reaction between glutaraldehyde and an amine and the addition of a carbonyl functional group.
Figure 3.
FTIR spectra of (A) O2 plasma treated Si, (B) APTES derivatized Si, (C) glutaraldehyde modified, (D) laminin printed, and (E) PEG functionalized.
In Figure 3D the peaks at 1650 cm−1 and 1540 cm−1 are attributed to NH2 and NH3+ bending vibrations, respectively. These two distinctive peaks are due to the large presence of amine groups within the protein laminin. Incubation of the glutaraldehyde-modified surface with mPEG-amine and subsequent reduction with sodium cyanoborohydride resulted in the appearance of a strong C-N peak, characteristic of Schiff base reduction. For all spectra, C-H stretching vibrations at 2850-2960 cm−1 and bending vibrations at 1460 cm−1 are observed. These peaks are attributed to adsorbed adventitious carbon species during sample transport and storage, in addition to the surface functionalization that contains CH, CH2 and CH3 bonds.
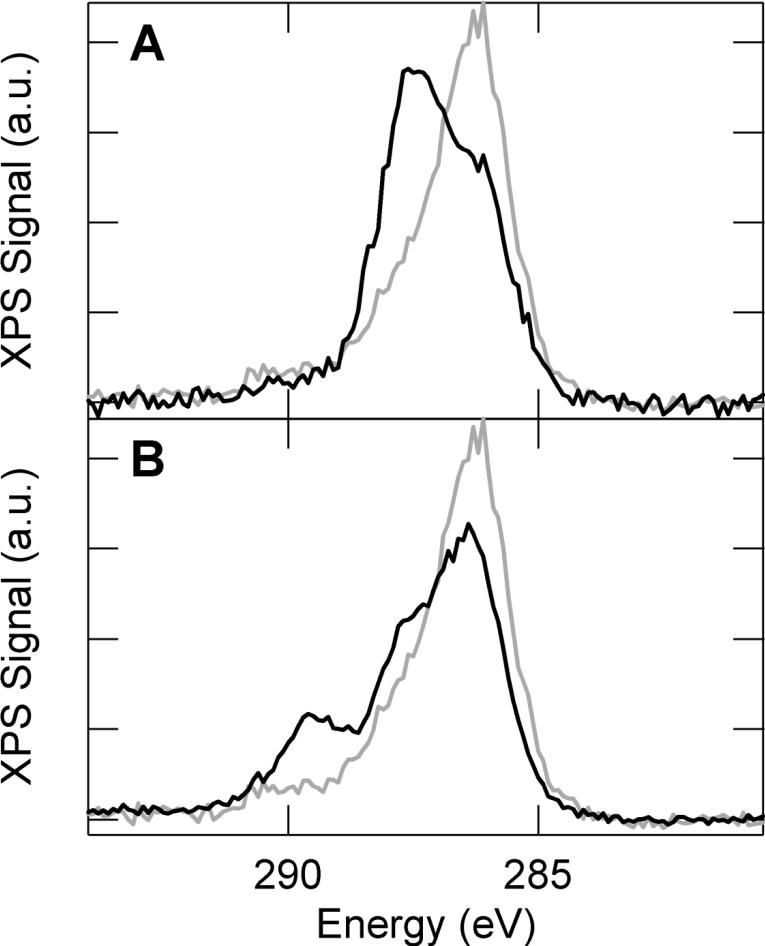
To further characterize the relative chemical composition of the surfaces, the C 1s peak was monitored using x-ray photoelectron spectroscopy (XPS) (Figure 4). For samples coated with glutaraldehyde functionalized APTES, a primary peak centered at 286 eV can be attributed to carbon-carbon bonding of the primarily alkyl coating. Compared to an expected energy of ~284 eV for carbon-carbon bonding, the measured spectra is slightly shifted to higher energy due to charging. This effect was consistent amongst all samples and can be attributed to the poor conductivity of these substrates. A low intensity tail at higher energy (~290 eV) is also observed and likely corresponds to carbon-nitrogen bonding associated with APTES.
Figure 4.
X-ray photoelectron spectra of the C 1s region for surfaces functionalized with APTES and glutaraldehyde (light), APTES, glutaraldehyde and mPEG-amine (dark, A), and APTES, glutaraldehyde and laminin (dark, B)
When evaluating PEG and laminin functionalization, it is informative to compare the observed spectra relative to a glutaraldehyde/APTES functionalization. Upon PEG deposition, the peak at 286 eV is attenuated and a secondary peak at higher energy (287.5 eV) becomes more prominent. This shift is consistent with carbon-oxygen bonding and provides good evidence for effective PEG deposition. Functionalization of the surface with the protein laminin leads to a more complex spectra, which can be subdivided into three characteristic peaks. These peaks can be associated with carbon-carbon (main peak at 286 eV), carbon-oxygen (peak shoulder at 287.5 eV), and carbon-nitrogen (secondary peak at 289.5 eV) bonding within the coating, which is consistent with laminin coating and demonstrates protein deposition.
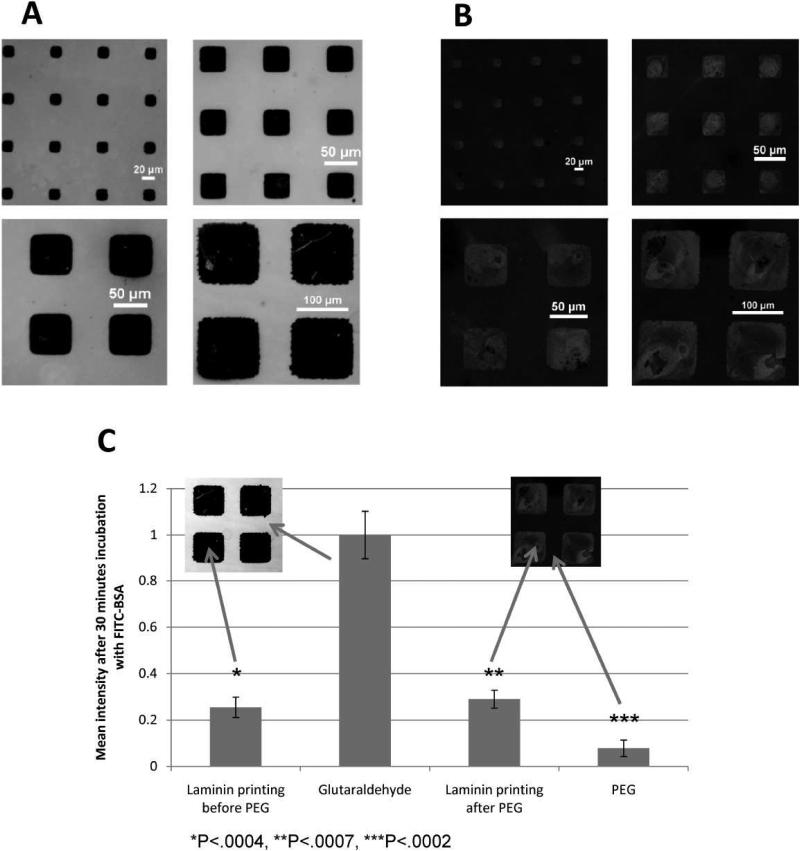
To determine the effectiveness of the PEG functionalization, the propensity of protein attachment to PEG was evaluated using semi-quantitative fluorescence analysis of FITC-BSA. Figure 5A shows fluorescent images before the deposition of PEG. FITC-BSA adsorbs strongly to the exposed aldehyde and comparatively less so to the laminin patterns. Upon covalent attachment of PEG, protein adsorption is strongly attenuated in unpatterned areas (Figure 5B). The quantified intensities of fluorescence are shown in Figure 5C. Interestingly, PEG deposition does not affect the ability of printed laminin to adsorb FITC-BSA, suggesting that the laminin adheres completely to the underlying aldehyde surface and prevents any attachment of PEG. Furthermore, the significant decrease in FITC-BSA adsorption following PEG deposition indicates that PEG is effectively preventing protein adsorption.
Figure 5.
Glass cover slips are incubated with 20 μg/mL FITC-BSA for 30 minutes before (A) and after PEG deposition (B). 120 μm printed laminin cover slips were incubated with FITC-BSA before and after PEG deposition and imaged with a spectral confocal microscope (C). The images were analyzed semi-quantitatively and the data is presented as an average of n=3 samples ± standard deviation. P-values are calculated from a 1-tailed student's t-test.
Effect of seeding density on mono vs. multi-layered cluster formation
To assess the effect of seeding density, 60 μm square laminin features were prepared and seeded with INS-1 (832/13) insulinoma cells at two representative seeding densities. The resulting cluster formations on the laminin patterns for 8,000 and 80,000 cells/cm2 are shown in Figure 6A and 6B, respectively. After initial attachment, cells migrate across the surface and form connections to other cells. Cell clusters eventually release from the PEG surface. Only partial cluster attachment to laminin is required for the remaining cells in that cluster to migrate and become confined to the area defined by the printed laminin. When printed patterns are too small for monolayer attachment of initially formed clusters the cells layer upon each other. This phenomenon occurs when cells are seeded at 80,000 cells/cm2, but it is not observed when cells are seeded at 8,000 cells/cm2. This effect is possibly due to the lower seeding concentration initially forming cell clusters small enough to fit in one layer on 60 μm patterns, and only reaching confluency after cells proliferate over time. At the higher seeding density, larger clusters are formed initially that cannot be accommodated by the 2D area, leading to multilayered clusters. From this we postulate that requirements for achieving multi-layered clusters include: (1) initial cell attachment to both adherent and non-adherent areas, (2) cell-cell attachment prior to the detachment of cells from non-adhesive areas, (3) and a cell seeding concentration at which initially formed clusters are too large to fit on each pattern.
Figure 6.
Brightfield images illustrating formation of cell clusters on cover slip seeded at 8,000 cells/cm2 (A) and 80,000 cells/cm2 (B). All images show live cells except for the 24 hour time point, which occurred after the cells had been fixed.
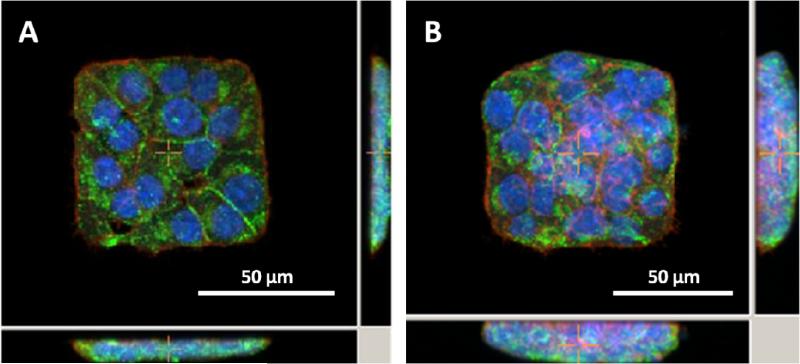
After 24 hours, cell clusters conform to the outlines defined by laminin patterns. A representative image of a mono-layered cluster and a multi-layered cluster is shown in Figure 7, where cells were fixed and stained for actin, nuclei, and insulin. These images show that higher cell seeding densities produce multiple cell layers confined to a 2D area. Furthermore, incubation of these cells with similar glucose concentrations (11.1 mM) has previously resulted in the secretion of already-present insulin within the first couple of hours22. Therefore, positive insulin immuno-staining verifies maintenance of insulin production capabilities 24 hours after patterning. The ability to produce both mono and multi-layer cell patterns and evaluate cluster-size dependent insulin production and distribution in response to physiological conditions, such as glucose stimulated insulin secretion, will potentially lead to the determination of optimal pancreatic β-cell cluster size for transplants.
Figure 7.
Fluorescent images of 832/13 insulinoma cells forming monolayers (A) or multilayers (B). Red – F-actin phalloidin stain, Blue – DAPI nuclear stain, Green – anti-insulin Alexa 488 immunostain. (Cross-sections of central images are shown to right and below)
Effect of concentration of adherent area
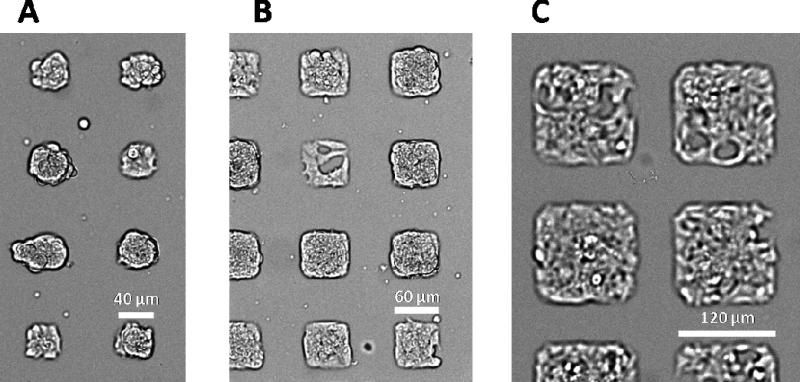
The formation of mono-layered and multi-layered clusters is also influenced by the percentage of adherent area. Figure 8 shows bright-field images of live cells taken 24 hours after seeding at 80,000 cells/cm2 on 40, 60, and 120 μm square laminin patterns. The separation between laminin islands are maintained at 50 μm as the laminin pattern size changes. As the pattern size increases, so does the available area for cells to adhere: 20%, 30%, and 50% of the area contains laminin for 40 μm, 60 μm and 120 μm patterns, respectively. In this case, the concentration of cells is held constant. On the smaller laminin patterns, attached cells have less adherent area to attach to resulting in the 40 μm patterns having almost all multi-layered clusters which is apparent by the crowded nature of the cell patterns in Figure 8A. In contrast, the 120 μm patterns are single-layered clusters and there is still area available in the pattern after 24 hours. Interestingly, the 60 μm patterns have a combination of mono and multi-layered clusters. The size of the clusters initially formed at seeding density 80,000 cells/cm2 appears to be between 60 and 120 μm. Evidently, the formation of multi-layered clusters can also be achieved while maintaining cell seeding concentration by reducing the percentage of adherent area.
Figure 8.
Bright-field microscopy of fixed 832/13 insulinoma cells on 40 (A), 60 (B) and 120 μm (C) laminin islands, demonstrating the variation in mono- and multi-layer cell clusters.
4. Conclusions
We have demonstrated the first example of pancreatic β-cell patterning able to form both mono and multi-layered cell patterns, where previous use of cell patterning techniques for the evaluation of cell clusters has been limited to monolayers. Photolithographic and microcontact printing techniques were employed to develop this technique for patterning three-dimensional cell clusters. Extensive characterization including XPS, FTIR, and fluorescence microscopy confirmed the success of this method and was used to optimize cell patterning. The patterning technique described here enables the systematic evaluation of the effect that cluster size has on insulin production and viability for pancreatic β-cells.
5. Acknowledgments
This work was supported by the Sandler Family Foundation and NIH training grant T32 DK07418. Images were taken at the Nikon Center at UCSF with the assistance of Kurt Thorn and Sebastien Peck. FTIR was performed at Harrick Scientific by Susan Berets, and XPS was performed at the Stanford Nanocharacterization Laboratory. The authors would also like to thank Dr. Kristy Ainslie for assistance with surface chemistry and Dr. Christopher Newgard for providing the 832/13 insulinoma cell line.
References
- 1.Ichii H, Ricordi C. J Hepatobiliary Pancreat Surg. 2009;16:101. doi: 10.1007/s00534-008-0021-2. [DOI] [PMC free article] [PubMed] [Google Scholar]
- 2.Shapiro AM, Lakey JR, Ryan EA, Korbutt GS, Toth E, Warnock GL, Kneteman NM, Rajotte RV. N Engl J Med. 2000;343:230. doi: 10.1056/NEJM200007273430401. [DOI] [PubMed] [Google Scholar]
- 3.Shapiro AM, Ricordi C, Hering B. Lancet. 2003;362:1242. doi: 10.1016/S0140-6736(03)14526-6. [DOI] [PubMed] [Google Scholar]
- 4.Lehmann R, Zuellig RA, Kugelmeier P, Baenninger PB, Moritz W, Perren A, Clavien PA, Weber M, Spinas GA. Diabetes. 2007;56:594. doi: 10.2337/db06-0779. [DOI] [PubMed] [Google Scholar]
- 5.Lau J, Carlsson PO. Transplantation. 2009;87:322. doi: 10.1097/TP.0b013e3181943b3d. [DOI] [PubMed] [Google Scholar]
- 6.Meda P, Bosco D, Chanson M, Giordano E, Vallar L, Wollheim C, Orci L. J Clin Invest. 1990;86:759. doi: 10.1172/JCI114772. [DOI] [PMC free article] [PubMed] [Google Scholar]
- 7.Jaques F, Jousset H, Tomas A, Prost AL, Wollheim CB, Irminger JC, Demaurex N, Halban PA. Endocrinology. 2008;149:2494. doi: 10.1210/en.2007-0974. [DOI] [PubMed] [Google Scholar]
- 8.Brereton HC, Carvell MJ, Asare-Anane H, Roberts G, Christie MR, Persaud SJ, Jones PM. Biochem Biophys Res Commun. 2006;344:995. doi: 10.1016/j.bbrc.2006.03.214. [DOI] [PubMed] [Google Scholar]
- 9.Meda P. Cell Commun Adhes. 2003;10:431. doi: 10.1080/cac.10.4-6.431.435. [DOI] [PubMed] [Google Scholar]
- 10.Bavamian S, Klee P, Britan A, Populaire C, Caille D, Cancela J, Charollais A, Meda P. Diabetes Obes Metab. 2007;9(Suppl 2):118. doi: 10.1111/j.1463-1326.2007.00780.x. [DOI] [PubMed] [Google Scholar]
- 11.Nittala A, Ghosh S, Wang X. PLoS One. 2007;2:e983. doi: 10.1371/journal.pone.0000983. [DOI] [PMC free article] [PubMed] [Google Scholar]
- 12.Kumar A, Biebuyck HA, Whitesides GM. Langmuir. 1994;10:1498. [Google Scholar]
- 13.Mrksich M, Dike LE, Tien J, Ingber DE, Whitesides GM. Exp Cell Res. 1997;235:305. doi: 10.1006/excr.1997.3668. [DOI] [PubMed] [Google Scholar]
- 14.Chen CS, Mrksich M, Huang S, Whitesides GM, Ingber DE. Science. 1997;276:1425. doi: 10.1126/science.276.5317.1425. [DOI] [PubMed] [Google Scholar]
- 15.Hou S, Li XX, Li XY, Feng XZ, Guan L, Yang YL, Wang C. Anal Bioanal Chem. 2009;394:2111. doi: 10.1007/s00216-009-2892-8. [DOI] [PubMed] [Google Scholar]
- 16.Rozkiewicz DI, Kraan Y, Werten MW, de Wolf FA, Subramaniam V, Ravoo BJ, Reinhoudt DN. Chemistry. 2006;12:6290. doi: 10.1002/chem.200501554. [DOI] [PubMed] [Google Scholar]
- 17.de la Fuente JM, Andar A, Gadegaard N, Berry CC, Kingshott P, Riehle MO. Langmuir. 2006;22:5528. doi: 10.1021/la053045s. [DOI] [PubMed] [Google Scholar]
- 18.Rozkiewicz DI, Ravoo BJ, Reinhoudt DN. Langmuir. 2005;21:6337. doi: 10.1021/la050438i. [DOI] [PubMed] [Google Scholar]
- 19.Cheng CM, LeDuc PR. Appl Phys. Letters. 2008:93. [Google Scholar]
- 20.Lahann J, Balcells M, Rodon T, Lee J, Choi IS, Jensen KF, Langer R. Langmuir. 2002;18:3632. [Google Scholar]
- 21.Cavallari G, Zuellig RA, Lehmann R, Weber M, Moritz W. Transplant Proc. 2007;39:2018. doi: 10.1016/j.transproceed.2007.05.016. [DOI] [PubMed] [Google Scholar]
- 22.Hohmeier HE, Mulder H, Chen G, Henkel-Rieger R, Prentki M, Newgard CB. Diabetes. 2000;49:424. doi: 10.2337/diabetes.49.3.424. [DOI] [PubMed] [Google Scholar]
- 23.Krishnamurthy M, Li J, Al-Masri M, Wang R. J Cell Commun Signal. 2008;2:67. doi: 10.1007/s12079-008-0030-6. [DOI] [PMC free article] [PubMed] [Google Scholar]
- 24.Miller AW, Robyt JF. Biotechnol Bioeng. 1983;25:2795. doi: 10.1002/bit.260251122. [DOI] [PubMed] [Google Scholar]
- 25.Saneinejad S, Shoichet MS. J Biomed Mater Res. 1998;42:13. doi: 10.1002/(sici)1097-4636(199810)42:1<13::aid-jbm3>3.0.co;2-r. [DOI] [PubMed] [Google Scholar]


