

Abstract
We demonstrate the feasibility of a nanopore based single-molecule DNA sequencing method, which employs multi-color readout. Target DNA is converted according to a binary code, which is recognized by molecular beacons with two types of fluorophores. Solid-state nanopores are then used to sequentially strip off the beacons, leading to a series of detectable photon bursts, at high speed. We show that signals from multiple nanopores can be detected simultaneously, allowing straightforward parallelization to large nanopore arrays.
Nanopore based DNA sequencing is widely considered to be a promising next generation sequencing platform[1, 2]. Two main features of the nanopore method make it exceptionally useful for single molecule-based genome analyses: First, the method’s ability to electrophoretically focus and thread extremely long DNA molecules from the bulk into the pore, making it possible to analyze minute DNA samples[3]. Second, sub-5 nm pores are now routinely used to linearize long DNA coils, thus in principle, nanopores can be used to effectively ‘scan’ information along a long genome. These features, as well as the fact that solid-state nanopores can be fabricated in a highly dense array[4, 5], allow the development of massively parallel detection, and are crucial for the realization of an amplification-free, low-cost and high-throughput sequencing [2, 6–9].
A nanopore is a nanometer-sized pore in an ultra-thin membrane that separates two chambers containing an ionic solution. An external electrical field applied across the membrane creates an ionic current and a local electrical potential gradient near the pore, which draws in and threads biopolymers through the pore in a single file manner [3, 10]. As a biopolymer enters the pore, it displaces a fraction of the electrolytes, giving rise to a change in the pore conductivity, which can be measured directly using an electrometer. A number of nanopore based DNA sequencing methods have recently been proposed and highlight two major challenges[1, 11]: 1) The ability to discriminate among individual nucleotides (nt). The system must be capable of differentiating among the four bases on a single-molecule level. 2) The method must enable parallel readout. As a single nanopore can probe only a single molecule at a time, a strategy for manufacturing an array of nanopores and simultaneously monitoring them is needed. To date, parallel readout through any nanopore-based method has not yet been demonstrated. A large number of current, and future, generation sequencing methodologies rely on the use of an enzyme (polymerase, exonuclease, etc) in the readout process. The kinetics of enzymatic activity, however, is a major bottleneck for increasing readout speed, and these methods are at the mercy of enzyme unperturbed activity. In this paper we present a novel nanopore based method for high-throughput base recognition that obviates the need for enzymes during the readout stage, and provides a straightforward method for multi-pore optical detection[12].
In our method, biochemical preparation of the target DNA molecules converts each base into a form that can be read directly using an unmodified solid-state nanopore. The massively parallel conversion process is performed off-line, and does not require enzyme immobilization or an amplification step. Due to this biochemical preparation step, the nanopore readout speeds and read length are not enzyme limited. Moreover, while previous publications utilized the electrical signal to probe biomolecules in nanopores, we use optical sensing to detect DNA sequence. A custom Total Internal Reflection (TIR) method, which permits high spatiotemporal resolution and wide-field optical detection of individual DNA molecules translocating through a nanopore, is used for the first time for 2-color fast single molecule detection[13]. Here we use this system to achieve simultaneous optical detection from multiple nanopores. Thus we demonstrate the proof of principle for the necessary components of a nanopore based single-molecule sequencing method.
Our approach comprises two steps (Figure 1a): First, each of the four nucleotides (A, C, G and T) in the target DNA is converted to a predefined sequence of oligonucleotides, which is hybridized with a molecular beacon that carries a specific fluorophore[12]. In the Supporting Information we describe the steps necessary to carry out the DNA conversion, and a successful conversion of all four bases, using a method that we call “Circular DNA Conversion” (CDC). For two-color readout (i.e., two types of fluorophores), the four sequences are combinations of two predefined unique sequences, bit ‘0’ and bit ‘1’, such that an A would be ‘1 1’, a G would be ‘1 0’, a T would be ‘0 1’ and finally a C would be ‘0 0’ (Figure 1a). Two types of molecular beacons, carrying two types of fluorophores, hybridize specifically to the ‘0’ and ‘1’ sequences. Second, the converted DNA and hybridized molecular beacons are electrophoretically threaded through a solid-state pore, where the beacons are sequentially stripped off. Each time a beacon is stripped off, a new fluorophore is unquenched, giving rise to a burst of photons, recorded at the location of the pore (Figure 1b). The sequence of two-color photon bursts, at each pore location, (colored yellow and red in Figure 1b) is the binary code of the target DNA sequence. This approach circumvents the need to detect individual bases and facilitates an enzyme-free readout. Additionally, this method permits wide-field imaging and spatially fixed pores enable straightforward adaptation to simultaneous detection of multiple pores with a electron multiplying charge coupled device (EM-CCD) camera (schematically illustrated in Figure 1b).
Figure 1.

(a) Schematic illustration of the two steps in our proposed DNA sequencing methodology. First, bulk biochemical conversion of each nucleotide of the target DNA sequence to a known oligonuclotide, followed by hybridization with molecular beacons. Threading of the DNA/beacon complex through a nanopore allows optical detection of the target DNA sequence. (b) Schematic illustration of the conceptual parallel readout scheme. Each pore has a specific location in the visual field of the EM-CCD and therefore enables simultaneous readout of an array of nanopores.
The readout approach uses a solid-state nanopore to strip hybridized molecular beacons off converted ssDNA. This normally requires the use of pores in the sub-2 nm range, because the cross-section diameter of double stranded DNA (dsDNA) is 2.2 nm[14]. However, we find that the probability of DNA entry into such small pores is much smaller than larger pores[3, 15], necessitating the use of a larger amount of DNA. Moreover, routine manufacturing of small pores poses technical challenges, as there is little tolerance for error, and the difficulty escalates for high-density nanopore arrays. We find that covalently attaching a 3–5 nm sized ‘bulky’ group (e.g. a protein or a nanoparticle) to the molecular beacons effectively increases the molecular cross section of the complex to 5–7 nm, allowing the use of nanopores in the size range of 3 – 6 nm. This increases the capture rate of DNA molecules by 10 fold or more, and greatly facilitates the fabrication process of the nanopore arrays.
The nanochips used in this study were fabricated in-house, starting from a double-sided polished silicon wafer coated with 30 nm thick, low-stress Si3N4 (SiN). 30 × 30 μm2 windows exposing both sides of the SiN membrane were created using wet KOH etching. Nanopores (3–5 nm in diameter) were fabricated using a focused electron beam, as previously described [16]. The drilled nanochips were cleaned and assembled on a custom-designed Teflon cell incorporating a glass coverslip bottom (see ref [13] for details) under controlled humidity and temperature. Nanopores were hydrated with the addition of degassed and filtered 1M KCl electrolyte to the cis chamber and 1M KCl with 8.6M urea to the trans chamber to facilitate total internal reflection (TIR) imaging. Ag/AgCl electrodes were immersed into each chamber of the cell and connected to an Axon 200B headstage, used to apply a fixed voltage (300 mV for all experiments) across the membrane and to measure the ionic current when needed. Nanopore current was filtered using a 50 kHz low pass Butterworth filter and sampled using a DAQ board at 250 kHz/16 bit (PCI-6154, National Instruments, TX). The signals were acquired using a custom LabView program as previously described[15].
To achieve high-speed single molecule detection of individual fluorophores near the suspended SiN membrane, we developed a custom TIR imaging which greatly reduces the fluorescence background[13]. The index of refraction of the trans chamber solution was adjusted, such that TIR could be created at the SiN membrane, preventing light from progressing into the cis chamber and thus reducing additional background. The cell was mounted on a high NA objective (Olympus 60X/1.45), and TIR was optimized by focusing the incident 640 nm laser beam (iFlex2000, Point-Source UK) to an off-axis point at its back focal plane, thereby controlling the angle of incidence. Fluorescence emission was split into two separate optical paths using a dichroic mirror (Semrock, FF685Di01) and the two images were projected side by side onto an EM-CCD camera (Andor, iXon DU-860). The EM-CCD worked at maximum gain and 1 ms integration time. Synchronization between the electrical and optical signals was achieved by connecting the camera ‘fire’ pulse to a counter board (PCI-6602, National Instruments), which shared the same sampling clock and start trigger as the main DAQ board. The combined data stream included unique time stamps at the beginning of each CCD frame, which were synched with the ion current sampling. Two separate criteria were used for classifying each event. First, the ion current must abruptly drop below a user defined threshold level, and remain at that level for at least 100 μs, before returning to the original state. Second, the corresponding CCD frames, during the event dwell-time (time where signal stays below the threshold), must show increase in the photon count only at the region of the pore.
For proof of concept, we attached an avidin (4.0 × 5.5 × 6.0 nm)[17] to a biotinylated molecular beacon containing a fluorophore-quencher pair (ATTO647N-BHQ2, abbreviated as “A647-BHQ”). Both this beacon and a similarly constructed oligo, containing a quencher at one end but no fluorophore at the other end, were hybridized to a target ssDNA (‘1 bit’ sample). A similar complex was synthesized containing two beacon molecules (‘2 bit’ sample), as shown schematically in Figure 2a. Bulk studies (see Supporting Information) demonstrated that, when in its hybridized state, the A647 fluorophore is quenched ~95% by the neighboring BHQ quencher. Given this extremely high quenching efficiency, fluorescence bursts can be detected at the single-molecule level only if strand separation occurs.
Figure 2.

Electro/optical detection of bulky group unzipping. (a) Representative events of unzipping 1 bit and 2 bit complexes using sub 5 nm pores. Electrical current is in black, while the optical signal is in blue and green for the 1-bit and 2-bit samples, respectively. (b) Histograms (n > 600 for each sample) of the total photon counts per event indicate that most complexes in the 1-bit sample (blue) produce one photon burst, while most complexes in the 2 bit sample (green) produce two photon bursts. Solid lines represent Poisson fits to the histograms, with mean values of 1.30±0.06 and 2.65±0.08 for the 1 bit and 2 bits samples, respectively. (c) Classification of events using a single intensity threshold to count the number of photon bursts per event. The 1 bit sample displays ~90% of the events having 1 photon burst. The 2 bit sample displays ~80% having 2 photon bursts.
Nanopore experiments for both the 1-bit and 2-bit samples were carried out using a 640 nm laser and imaged at 1,000 frames per second using our EM-CCD camera. Figure 2a displays typical unzipping events for the two samples, with one beacon per complex in the 1-bit sample, and two beacons per complex in the 2-bit sample. Electrical signals are shown in black, and optical signals, measured synchronously with the electrical signals at the pore position[13], in blue or green. An abrupt decrease in electrical current signifies the entry of the molecule to the pore, and the pore is cleared when the electrical signal returns to the open-pore upper state[14]. We note that the unzipping events observed here are substantially longer than previously reported due to the presence of the bulky group[13]. The optical signals clearly show either one or two photon bursts for the 1-bit and 2-bit samples, respectively. This is expected since the fluorophores are quenched before reaching the pore and are self-quenched again immediately after the beacons are unzipped from the template[18]. A simple summation of the optical intensity during each event, as defined by the electrical signal, yields Poisson distributions for the two samples (solid lines in Figure 2b), with mean values of 1.30±0.06 for the 1-bit sample, and double 2.65±0.08 for the 2-bit sample (n > 600 events in each case, errors represent STD). This proves that regardless of a model used to define a photon burst, a single unzipping event occurred for the 1-bit sample and two unzipping events occurred for the 2-bit samples. Moreover, with the use of an intensity threshold analysis (average intensity + 2 STD) we determine that nearly 90% of the collected events in the 1 bit sample contained a single fluorescent burst, while in the 2 bit sample, ~80% of the collected events displayed 2 such bursts (Figure 2c). This data demonstrates that we can optically discriminate between 1 bit and 2 bit samples, in individual unzipping events performed using a 3–5 nm pore.
To distinguish between all four nucleotides, we extend our system from a 1 color to a 2 color coding scheme using two high quantum yield fluorophores, A647 (ATTO647N) and A680 (ATTO680), excited simultaneously by the same 640 nm laser. The optical emission signal was split into channels 1 and 2 using a dichroic mirror and imaged side-by-side on the same EM-CCD camera. Two-color intensity analysis was performed by reading the intensity at a 3×3 pixel area centered at the pore position (see for example Figure 3a). As the emission spectra of the two fluorophores overlap, a fraction of the A647 emission “leaks” into channel 2, and a fraction of A680 “leaks” to channel 1. Two calibration measurements were performed using 1-bit complexes labeled with A647 or A680 fluorophores (Figure 3a). Clearly seen is a single distinct peak in each channel, corresponding to the location of the nanopore, after accumulation of >500 unzipping events in each case. The ratio of the fluorescent intensities in Channel 2 vs. Channel 1 (R) is 0.2 for the A647 sample, and 0.4 for the A680 sample.
Figure 3.
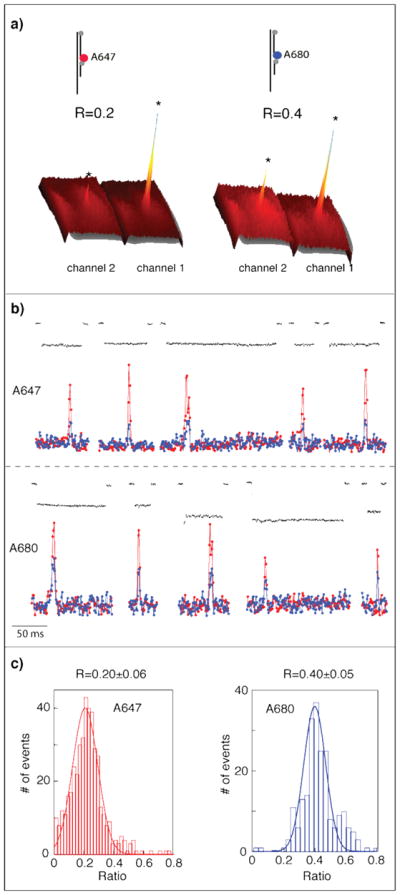
Two-color unzipping experiments with A647 (red) and A680 (blue) fluorophores. (a) Accumulated photon intensity. A single, prominent peak is observed in each channel, indicating pore location as imaged on the EM-CCD. The R values, the ratios of fluorescent intensity measured in Channel 1 vs. Channel 2, are 0.2 and 0.4 for the two fluorophores. (b) Electro/optical signals for representative unzipping events with A647 (top) and A680 (bottom). (c) Accumulating hundred of traces for each sample yielded R=0.20±0.06 and 0.40±0.05 for A647 and A680 respectively. Lines are fits to Gaussian functions.
Representative events (out of >500) for each for the two samples, and the corresponding distributions of R, are depicted in Figures 3b and 3c, respectively. We observe a single prominent fluorescent peak during each translocation event (electrical traces shown in black), with intensity >3 fold larger than the standard deviation of the fluorescence baseline fluctuations. Tallying up all single-molecule events led to R=0.20±0.06 and 0.40±0.05 (mean±std) for A647 and A680, respectively, in complete agreement with the ratios for accumulated fluorescence (for all events) shown in Figure 3a. R follows a Gaussian distribution, given by the solid line fits in Figure 3c. These control measurements show that we can use R to determine the identity of individual fluorophores. Discrimination was performed automatically in a custom LabView code, using the calibration data (Figure 3c). The error in the determination of each of the two dyes can be calculated from the overlap area between the distributions, yielding < 9% for the A647 and < 13% for A680. Data analysis was performed using IGOR Pro (Wavemetrics), and fits were created to optimize chi-square.
Using the calibration distributions given in Figure 3c, we tested our ability to identify the products from the circular DNA conversion containing the four 2-bit combinations for all four bases, namely 11 (A), 00 (C), 01 (T), and 10 (G), where “0” and “1” correspond to the A647 and A680 beacons, respectively. Analysis of >2000 unzipping events, in which 2 distinct photon bursts were detected, revealed a bimodal distribution of R, with two modes at 0.21±0.05 and 0.41±0.06 (Figure 4b), in complete agreement with the calibration measurements (Figure 3c). We classified all photon bursts with R<0.30 as “0”, and those with R>0.30 as “1” (0.30 is the local minimum of the distribution in Figure 4b). The distribution of R was also used to compute the probability of misclassification. This provides us with a further statistical means to calibrate the two channels for optimal discrimination between the two fluorophores. Figure 4c presents representative 2-color fluorescence intensity events depicting the single molecule identification of all 4 DNA bases.
Figure 4.

Optical nanopore nucleobase identification using two fluorophores. (a) 2 colors enable the construction of 2 bit samples which correspond to all four DNA nucleobases. (b) The R distribution generated with >2000 events reveals two modes at 0.21±0.05 and 0.41±0.06, which correspond to the A647 and A680 fluorophores respectively, in excellent agreement with control studies. Line represents a double Gaussian fit function. (c) Representative intensity-corrected fluorescence traces of individual 2-color 2-bit unzipping events, with the corresponding bit called, base called and certainty score indicated above the event. The intensities in the two channels were corrected automatically by a computer code, after each bit is called using a fixed threshold R value. The values in the parenthesis represent certainty value for each base extracted automatically.
The robustness of our two-color identification is attributed primarily to the excellent signal/background levels of the photon bursts and the separation between the fluorophore intensity ratios for the two channels. We developed a computer algorithm to perform automatic peak identification that also filters out random noise (e.g. false spikes) in the fluorescence signals and identifies the bit sequence using the calibration distributions (Figure 3c), followed by base calling. The algorithm outputs two certainty scores, one for bit calling and the other one for base calling. Typical results are shown in Figure 4c. The certainty value for each base extracted automatically from the raw intensity data (range between 0 and 1) is displayed in parenthesis.
One of the major advantages of our wide-field optical-based detection scheme lies in the simplicity with which multiple pores can be probed in parallel, ultimately enabling high-throughput readout. As a proof of concept for parallel readout, we fabricated multiple 3–5 nm sized nanopores on the same SiN membranes, separated by several microns. In Figure 5a we display accumulated fluorescence intensity images, obtained using membranes containing three nanopores. Like the single pore experiments, we recorded fluorescent bursts from all pores in the membrane. Accumulating photon counts from several thousand unzipping events resulted in surface maps of photon intensity at each pixel. The distance between the three peaks for the three-pore membrane were 1.8 μm and 7.7 μm, in complete agreement with the distances between the pores measured during the fabrication process. This data provides direct evidence for the feasibility of a wide-field optical detection scheme.
Figure 5.

Multi-pore detection of DNA unzipping events. (a) Surface plot depicting the accumulated optical intensity clearly depict the locations of three nanopores as imaged by the EM-CCD, fabricated in the SiN membrane. The high-resolution TEM images of the three nanopores (~5 nm each) are shown. (b) Four representative traces display the concurrent unzipping at two different pores. Electrical current traces (black) do not contain information on pore location, while optical traces (green, red, and blue traces) allow us to establish the location of the unzipping event.
In Figure 5b, we demonstrate the ability of our system to probe photon bursts simultaneously from multiple nanopores in a single membrane. Four representative traces show the electrical current (black) and the optical signal using 1-bit sample probed from the three nanopores (green, red and blue markers, respectively). The entrance and unzipping process of each molecule, at each pore, is a stochastic process. We found that under the conditions used in this experiment, out of >3,000 unzipping events, ~50 involved molecules entering through two pores at the same time. The electrical current trace, which is accumulated from all pores, displays two distinct blockade levels, indicating the total number of occupied pores at a particular moment, without information on which pores are occupied. The optical traces reveal occupied pores unambiguously. This will ultimately eliminate the need for electrical current measurements when we extend our method to larger arrays, and rely solely on optical measurements, simplifying instrumentation requirements.
DNA sequencing methods using nanopores offer several advantages over alternative methods. The speed of readout is completely controllable by adjusting the applied voltage, and is only limited by the detection modality resolution. Future developments of brighter fluorophores and higher-sensitivity CCDs can straightforwardly translate to faster readout speeds. As a single-molecule method, it does not have large sample concentration stipulations and therefore aids in driving down both cost and sample amplification error. Finally, the nanopore readout shown here does not involve the immobilization of enzymes onto predefined or random locations, thus highly simplifying the reading platform. Here we demonstrated the feasibility of two color converted DNA readout using a binary code (2 bits per base) to represent each DNA base. At its current stage, our system can read 50–250 bases per second per nanopore, which compares favorably with other single-molecule approaches[6, 8]. We anticipate that a straightforward adaptation for 4-color and the use of optimized reagents will allow us to achieve >500 bases per second, per nanopore and sharply decrease the base classification errors. Even at this early stage where of-the-shelf reagents were used and a single laser line was employed, the nucleaobase classification error is about 10% (per single read). Since the DNA conversion process produces a structure-free DNA it automatically removes systematic errors from the readout stage (i.e. errors do not depend on the DNA template sequence). Therefore the predominant source of readout error can be substantialy lowered with multiple reads of the same sequence. Lastly, we demonstrate the feasibility of multi-pore readout; a first for nanopore based methods.
Though a number of technical challenges still remain prior to the completion of an all-in-one sequencing device, our results strongly indicate the feasibility of using solid-state nanopores for optical DNA sequencing. Ultimately, the fabrication of arrays of hundreds, to thousands, of pores needs to be accomplished. Recently, a number of publications have demonstrated the fabrication of similar scale arrays in solid-state materials[19, 20]. We demonstrated that the incorporation of a bulky group allows the use of 3–6 nm pores, which are relatively easy to manufacture. The implementing of a four-color detection system that uses one fluorophore for each base will halve the converted DNA length and double the detection speed, while also increasing the accuracy for base calling. A four-color system would also remove the error created in the two-color system as a result of potential frame shifting. Our results demonstrate the first all solid-state DNA sequence readout, and further technical refinements will allow us to realize a highly parallel nanopore based DNA sequencing system. Such an ultra-fast and affordable system has numerous applications in biomedical research and in the diagnosis and treatment of human diseases.
Supplementary Material
Acknowledgments
We thank J. Sutin for critical reading and commenting on the manuscript and acknowledge G. Soni, M. Wanunu, N. Di Fiori and J. Larkin for technical assistance, and support from Harvard University’s Center for Nanoscale Systems. AM and ZW acknowledge support from NIH award HG-004128.
References
- 1.Branton D, Deamer DW, Marziali A, Bayley H, Benner SA, Butler T, Di Ventra M, Garaj S, Hibbs A, Huang XH, Jovanovich SB, Krstic PS, Lindsay S, Ling XSS, Mastrangelo CH, Meller A, Oliver JS, Pershin YV, Ramsey JM, Riehn R, Soni GV, Tabard-Cossa V, Wanunu M, Wiggin M, Schloss JA. The potential and challenges of nanopore sequencing. Nat Biotechnol. 2008;26:1146–1153. doi: 10.1038/nbt.1495. [DOI] [PMC free article] [PubMed] [Google Scholar]
- 2.Healy K. Nanopore-based single-molecule DNA analysis. Nanomedicine. 2007;2:459–481. doi: 10.2217/17435889.2.4.459. [DOI] [PubMed] [Google Scholar]
- 3.Wanunu M, Morrison W, Rabin Y, Grosberg AY, Meller A. Electrostatic focusing of unlabelled DNA into nanoscale pores using a salt gradient. Nature Nanotech. 2010;5:160–165. doi: 10.1038/nnano.2009.379. [DOI] [PMC free article] [PubMed] [Google Scholar]
- 4.Nam SW, Rooks MJ, Kim KB, Rossnagel SM. Ionic Field Effect Transistors with Sub-10 nm Multiple Nanopores. Nano Lett. 2009;9:2044–2048. doi: 10.1021/nl900309s. [DOI] [PubMed] [Google Scholar]
- 5.Lee HS, Kim BS, Kim HM, Wi JS, Nam SW, Jin KB, Arai Y, Kim KB. Electron Beam Projection Nanopatterning Using Crystal Lattice Images Obtained from High Resolution Transmission Electron Microscopy. Adv Mater. 2007;19:4189–4193. [Google Scholar]
- 6.Harris TD, Buzby PR, Babcock H, Beer E, Bowers J, Braslavsky I, Causey M, Colonell J, DiMeo J, Efcavitch JW, Giladi E, Gill J, Healy J, Jarosz M, Lapen D, Moulton K, Quake SR, Steinmann K, Thayer E, Tyurina A, Ward R, Weiss H, Xie Z. Single-Molecule DNA Sequencing of a Viral Genome. Science. 2008;320:106–109. doi: 10.1126/science.1150427. [DOI] [PubMed] [Google Scholar]
- 7.Shendure J, Mitra RD, Varma C, Church GM. Advanced sequencing technologies: Methods and goals. Nat Rev Genet. 2004;5:335–344. doi: 10.1038/nrg1325. [DOI] [PubMed] [Google Scholar]
- 8.Eid J, Fehr A, Gray J, Luong K, Lyle J, Otto G, Peluso P, Rank D, Baybayan P, Bettman B, Bibillo A, Bjornson K, Chaudhuri B, Christians F, Cicero R, Clark S, Dalal R, Dewinter A, Dixon J, Foquet M, Gaertner A, Hardenbol P, Heiner C, Hester K, Holden D, Kearns G, Kong XX, Kuse R, Lacroix Y, Lin S, Lundquist P, Ma CC, Marks P, Maxham M, Murphy D, Park I, Pham T, Phillips M, Roy J, Sebra R, Shen G, Sorenson J, Tomaney A, Travers K, Trulson M, Vieceli J, Wegener J, Wu D, Yang A, Zaccarin D, Zhao P, Zhong F, Korlach J, Turner S. Real-Time DNA Sequencing from Single Polymerase Molecules. Science. 2009;323:133–138. doi: 10.1126/science.1162986. [DOI] [PubMed] [Google Scholar]
- 9.Fuller CW, Middendorf LR, Benner SA, Church GM, Harris T, Huang X, Jovanovich SB, Nelson JR, Schloss JA, Schwartz DC, Vezenov DV. The challenges of sequencing by synthesis. Nat Biotech. 2009;27:1013–1023. doi: 10.1038/nbt.1585. [DOI] [PubMed] [Google Scholar]
- 10.Deamer DW, Branton D. Characterization of Nucleic Acids by Nanopore Analysis. Accounts Chem Res. 2002;35:817–825. doi: 10.1021/ar000138m. [DOI] [PubMed] [Google Scholar]
- 11.Clarke J, Wu HC, Jayasinghe L, Patel A, Reid S, Bayley H. Continuous base identification for single-molecule nanopore DNA sequencing. Nature Nanotech. 2009;4:265–270. doi: 10.1038/nnano.2009.12. [DOI] [PubMed] [Google Scholar]
- 12.Soni G, Meller A. Progress towards ultra-fast DNA sequencing using solid-state nanopores. Clin Chem. 2007;53:1996–2001. doi: 10.1373/clinchem.2007.091231. [DOI] [PubMed] [Google Scholar]
- 13.Soni GV, Singer A, Yu Z, Sun Y, McNally B, Meller A. Synchronous optical and electrical detection of biomolecules traversing through solid-state nanopores. Rev Sci Instrum. 2010;81:014301–014307. doi: 10.1063/1.3277116. [DOI] [PMC free article] [PubMed] [Google Scholar]
- 14.McNally B, Wanunu M, Meller A. Electromechanical Unzipping of Individual DNA Molecules Using Synthetic Sub-2 nm Pores. Nano Lett. 2008;8:3418–3422. doi: 10.1021/nl802218f. [DOI] [PMC free article] [PubMed] [Google Scholar]
- 15.Wanunu M, Sutin J, McNally B, Chow A, Meller A. DNA Translocation Governed by Interactions with Solid-State Nanopores. Biophys J. 2008;95:4716–4725. doi: 10.1529/biophysj.108.140475. [DOI] [PMC free article] [PubMed] [Google Scholar]
- 16.Kim MJ, Wanunu M, Bell DC, Meller A. Rapid fabrication of uniformly sized nanopores and nanopore arrays for parallel DNA analysis. Adv Mater. 2006;18:3149–3153. [Google Scholar]
- 17.Green NM, Joynson MA. A preliminary crystallographic investigation of avidin. Biochem J. 1970;118:71–72. doi: 10.1042/bj1180071. [DOI] [PMC free article] [PubMed] [Google Scholar]
- 18.Bonnet Gg, Krichevsky O, Libchaber A. Kinetics of conformational fluctuations in DNA hairpin-loops. P Natl Acad Sci USA. 1998;95:8602–8606. doi: 10.1073/pnas.95.15.8602. [DOI] [PMC free article] [PubMed] [Google Scholar]
- 19.Tong HD, Jansen HV, Gadgil VJ, Bostan CG, Berenschot E, van Rijn CJM, Elwenspoek M. Silicon Nitride Nanosieve Membrane. Nano Lett. 2004;4:283–287. [Google Scholar]
- 20.Wico CLH, et al. Focused ion beam scan routine, dwell time and dose optimizations for submicrometre period planar photonic crystal components and stamps in silicon. Nanotechnology. 2007;18:195305. [Google Scholar]
Associated Data
This section collects any data citations, data availability statements, or supplementary materials included in this article.