

Abstract
Purpose
Current biodosimetric techniques for determining radiation exposure have inherent delays, and quantitation and interpretation limitations. We have identified a new technique with the advantage of directly measuring circulating DNA by amplifying inter-B1 regions in the mouse genome, providing a sensitive method for quantitating plasma DNA.
Methods and Materials
Real-time quantitative PCR was used to detect levels of DNA by amplifying inter-B1 genomic DNA in plasma samples collected at 0-48 hrs from mice receiving 0-10 Gy total- or partial-body irradiation [137Cs γ-ray source at ≈1.86 Gy/min (homogeneity: ±6.5%)].
Results
The correlation coefficient between DNA levels and the threshold cycle value (CT) was 0.996, and the average recoveries of DNA in the assay were 87%. This assay revealed that when BALB/c mice were exposed to 10 Gy TBI, plasma DNA levels gradually increased beginning at 3 hours after irradiation, peaked at 9 hours, and returned to baseline within 48 hours. Increased plasma DNA levels were also detected following upper-torso or lower-torso partial-body irradiation; however, TBI approximately doubled those plasma DNA levels at the same radiation dose. This technique therefore reflects total body cell damage. The advantages of this assay are that DNA extraction is not required, the assay is highly sensitive (0.002 ng), and results can be obtained within 2.5 hours after collection of plasma samples.
Conclusions
A radiation dose-dependent increase of plasma DNA was observed in the dose range from 2—10 Gy, suggesting that plasma DNA may be a useful radiation biomarker and adjunct to existing cell-based assays.
Keywords: qPCR, irradiation, inter-B1, Alu, DNA, Plasma
Introduction
Environmental and medical radiation exposures are common components of modern life, as is the continued risk of accidental, occupational, and malevolent exposure. Furthermore, plans for space exploration demand better understanding of radiation exposure risks; thus, detecting exposure levels, measuring the effects, and assessing the implications are topics of increasing importance.
The hallmark of radiation biological damage is DNA breakage. Measuring chromosomal aberrations remains the “gold standard” assay (1, 2), but newer techniques measuring DNA repair complexes (3), micronuclei (4), and electron paramagnetic resonance (EPR) (5-7) are nearing utility. Other methods such as analysis of circulating mRNA patterns (8), proteomics (9), and metabolomics (10) are also being investigated. Each method has strengths and weaknesses, and combinations of methods will likely be needed. For example, genomic methods are dilatory and measure genotoxicity but not physical dose, EPR may be insensitive to neutron exposures, and mRNA fingerprints, if identified, will only be useful during a limited time-window (11). The limitations of existing methods prompted us to investigate other methods to measure radiation-related toxicity.
In 1987, Russian scientists were the first to determine that sera from rats exposed to whole body doses of 8-100 Gy showed increased nucleosome DNA when assayed in 0.85% agarose gel (12). They further established that much of this DNA was of low molecular weight (13-18). Considering that a radiation biodosimeter must be sensitive to much lower dose exposures, we now report a new approach utilizing the B1 repetitive sequence, the murine equivalent of the human Alu sequence (the most abundant form of repetitive DNA in humans), and quantitative real-time PCR (qPCR) to create a biodosimeter in the relevant dose range. A discussion is included regarding the changes that might be needed in the assay for human application.
Methods and Materials
Animals and treatments
Male BALB/c mice, 6—8 weeks old, were divided into groups (5 mice/group). Control mice were not irradiated, and other groups received either single dose total-body irradiation (TBI) or partial-body irradiation (PBI, either upper or lower body). Animals were immobilized with the aid of a plastic restrainer during exposure to a 137Cs γ-ray source at ≈1.86 Gy/min (homogeneity: ±6.5%), which took 5.37 min for a 10 Gy exposure. Mice were housed in a pathogen-free barrier facility (12-hour light/12-hour dark cycle), and fed autoclaved standard rodent chow. All protocols were approved by the University Committee on Animal Research, and all experiments were carried out in accordance with USPHS guidelines.
Preparation of samples
Approximately 50-100 μl of EDTA-anticoagulated blood was collected from the mouse lateral saphenous vein into polypropylene tubes as described (19) at the time points indicated. Plasma was subjected to centrifugation (8,000 g for 5 min at 4°C), followed by separation of 25-50 μl of plasma into fresh polypropylene tubes with care taken to leave the buffy coat undisturbed. The samples were stored at -20°C until further qPCR analysis.
Primer design
The two oligonucleotide primers for qPCR were outwardly-oriented and were identical to those designed previously for use against sequences from the 5′ and 3′ ends of the B1 repetitive element DNA sequences (20) of the mouse genome. The approach for the primer design and validation studies mimics the previous study with human Alu, a similar genomic DNA in humans (21). The primers used in the current study, which amplify mouse DNA regions between B1 repeats (Figure 1A and 1B), had the following sequences, as determined by Krayev et al. (22):
Figure 1. Consensus B1 sequence and scheme for amplication.

(A) Consensus B1 sequence and locations of primers for amplification. The sequence determined by Krayev et al. (22) is shown. PCR primers are shown as lines with arrowheads to indicate 5′ to 3′ orientation relative to the B1 sequence. The sequence of each primer is described in Methods and Materials. (B) Representation of the types of amplification of genomic DNA sequences between adjacent B1 elements by the forward and reverse primers in a “tail-to-tail” (T-T), “head-to-head” (H-H), or “tail-to-head” (T-H) orientation.
5′-CCAGGACACCAGGGCTACAGAG-3′ (forward) and
5′-CCCGAGTGCTGGGATTAAAG-3′ (reverse).
qPCR amplification and DNA Quantification
qPCR was performed using mouse plasma as the DNA template source and a combination of the two primers described above. Mouse plasma was diluted 10-fold with DNase- and RNase-free H2O prior to being added into the reaction well. The total volume of the PCR reaction mixture was 20 μl consisting of 2 × iQ™ SYBR Green Supermix (1 × final) (Bio-Rad Laboratories-Hercules, CA), 0.5 μM of each oligonucleotide primer, and 1 - 4 μl of the diluted plasma sample. Each reaction was subjected to an initial denaturation of 8 min at 95°C followed by 40 amplification cycles of denaturation at 95°C for 30s, annealing at 55°C for 40s, and 1 min of extension at 72°C. To develop a standard curve, mouse skin DNA purified in-house by using standard phenol-chloroform procedure was used as the template DNA source and added into the reaction mixture after being serially diluted with DNase- and RNase-free H2O to the concentrations indicated. The standard curve was constructed using threshold cycle value (Ct) as the y-axis and DNA concentration as the x-axis. It should be noted that although inter-B1 sequences were amplified, those levels of amplification were then converted to final total DNA concentrations by reference to the total DNA standard curve. A melt curve was also performed in each assay to check for specificity of the reaction. A Bio-Rad i-cycler iQ real-time PCR detection system (Bio-Rad Laboratories-Hercules, CA) was employed to run the reactions. The plasma samples were assayed with the standards run simultaneously in each experiment. All the reactions were performed either in duplicate or in triplicate for both standard or test plasma samples, and the DNA quantity in each test sample was interpolated automatically by the qPCR detection system from a range of standards of known quantity. The standard deviations of the raw data about the mean values were calculated by the detection system automatically and also verified manually using Microsoft Excel statistical functions. The data were plotted with Microsoft Excel and Sigmaplot.
DNA recovery by qPCR
To test recovery, DNA concentrations in each of two randomly chosen normal mouse plasma samples were first measured by qPCR. Then either 1.0 or 10.0 ng of purified mouse skin DNA, as measured by UV absorbance at 260 nm, was added to each of those two samples. These mixtures were then diluted 10-fold in DNase- and RNase-free H2O. One microliter of each such dilution was subsequently loaded into separate detection wells in triplicate for DNA quantification by qPCR. Recovery was calculated using the following equation:
Where R, the recovery, is the total amount of DNA measured by qPCR in the spiked sample (Q PCR(spiked)sample), over the sum of the DNA quantity in the plasma samples before spiking (QPCR (original)sample) and the amount of DNA spiked without plasma (QUVspike), expressed as a percent.
Gel electrophoresis
Real-time PCR reactions were run separately and terminated after 25 cycles to collect amplicons before reaching plateau phase. The PCR products were then combined from the reactions for all animals in the same group and visualized with ethidium bromide after electrophoresis in 4% agarose gels by loading an equal volume of the combined PCR reaction solutions for different groups.
Statistical analysis
The plasma samples were assayed with the standards run simultaneously in each experiment. All the reactions were performed either in duplicate or in triplicate for both standard or test plasma samples, and the DNA quantity in each test sample was interpolated automatically by the qPCR detection system from a range of standards of known quantity. The standard deviations of the raw data about the mean values were calculated by the detection system automatically and also verified manually using Microsoft Excel statistical functions. The data were plotted with Microsoft Excel and Sigmaplot. When appropriate, ANOVA was first used to ascertain whether there was significant difference between the means. When ANOVA indicated significance, the data were scrutinized further by performing unpaired two-tailed t tests. The significance level was set at P≤0.05.
Results
Development of qPCR
To detect slight changes quantitatively in circulating DNA in mice exposed to lower and higher doses of irradiation, two primers that framed the mouse B1 consensus sequence were selected and constructed (Fig. 1A). It was possible to amplify the DNA sequences between adjacent B1 elements in either orientation (Fig. 1B). The distance between B1 elements varies considerably. Correspondingly, the PCR products generated by qPCR exhibited a range of sizes between 100—1500 bp, as evidenced by the smear of ethidium bromide staining in Figure 3B and 4B. Regarding the extension time, we experimented with 1.5 and 2 min, and found the results were similar to 1 min, indicating that the extension time of 1 min is sufficient to discover all or the vast majority of amplification of inter-B1 elements.
Figure 3. Change of plasma DNA level with time after exposure.
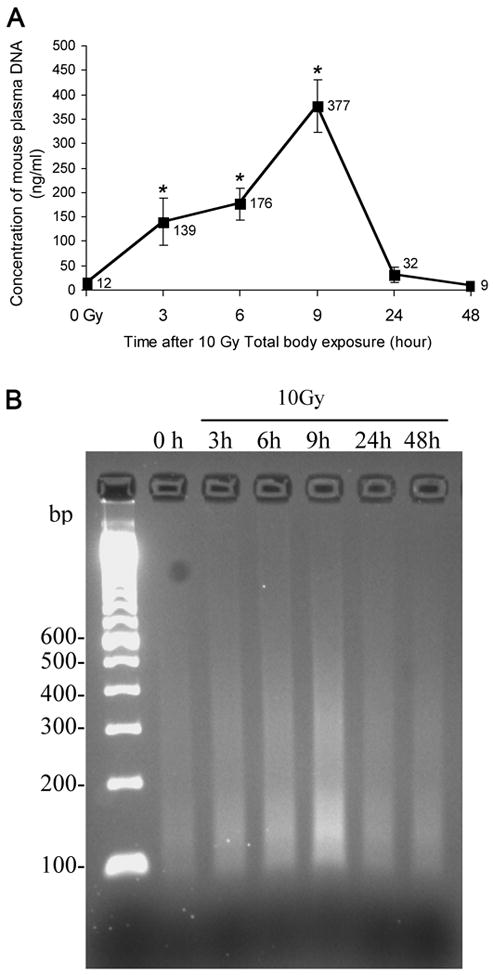
(A) Plasma was collected at different time points after total body irradiation of mice at a single dose of 10 Gy, and its DNA quantity was measured as described in Methods and Materials. The mean value is given for each data point (denotes the mean ± SD of 5 mice per treatment and time point). Asterisks indicate a significant difference between control and treated values at the time point indicated. (B) Detection of plasma DNA by agarose gel electrophoresis demonstrates a median DNA size of about 155 base pairs at 9 hrs. The same samples as analyzed in (A) were amplified by qPCR and amplicons were subjected to electrophoresis on a 4% agarose gel stained with ethidium bromide as described in Methods and Materials.
Figure 4. Dose-effect of irradiation on plasma DNA level.
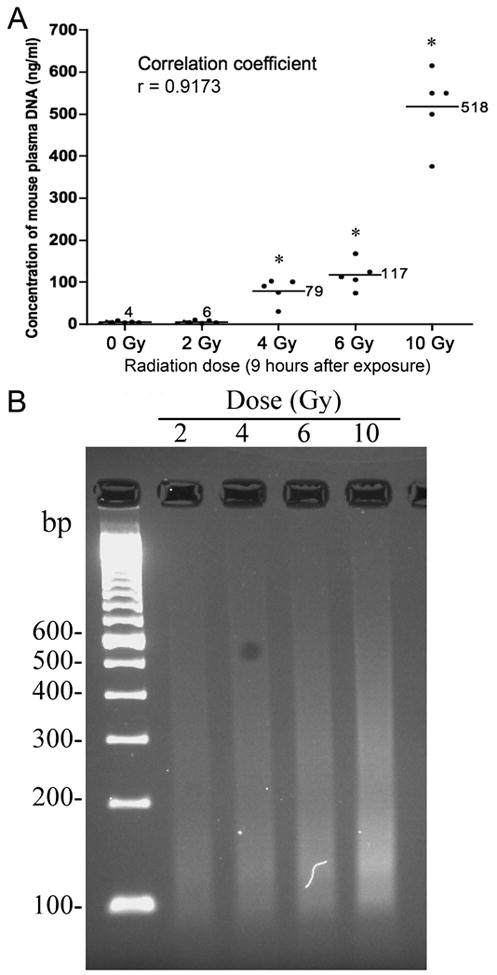
(A) Plasma was collected at 9 hours after single exposure to different doses of irradiation as indicated, and its DNA level was measured as described in Methods and Materials. Data points denote the mean ± SD of 5 mice per treatment. Asterisks indicate a significant difference between control and treated values at the dose indicated. (B) Detection of plasma DNA by agarose gel electrophoresis. The same samples as analyzed in (A) were run by qPCR and amplicons were subjected to electrophoresis through a 4% agarose gel and photographed under UV illumination after staining with ethidium bromide.
When the different standard dilutions and plasma samples were melted during the amplification process, a sharp composite melting curve was obtained (Fig. 2A). As each of the reactions was heated toward the denaturation temperature, the fluorescence suddenly fell to background levels within a 7°C range between 80 to 87°C. After background subtraction, the derivative of the curve was used to convert the melting curves to a melting peak (Fig. 2B). Multiple single peaks occurring in a narrow range of melting temperature indicate that the method is target-specific, but that various fragments with different base contents and length were amplified from the inter-B1-regions of DNA in the original qPCR reaction mixture.
Figure 2. Real-time quantitative PCR amplification.

Representative melting curves (A) were acquired for amplification products from each of the standard dilutions and plasma samples. The melting curves were transformed into melting peaks (B), which were plotted as the negative first derivative values of SYBR Green fluorescence intensity as a function of temperature ([-dRFU/dt]). (C) Amplification plots obtained using real-time quantitative PCR for the inter-B1 sequence. Each plot corresponds to a particular input target quantity as indicated. The X-axis denotes the cycle number of a quantitative PCR reaction. The Y-axis denotes the fluorescence intensity above background. Each dilution was assayed in duplicate. (D) Plot of the threshold cycle (CT) against the log of the starting quantity of template serially made by a 4-fold dilution. Each dilution was measured in duplicate. The inset graph includes all data points. The correlation coefficient (r2) is 0.996.
To determine the dynamic range of qPCR, we made serial dilutions of the purified mouse skin DNA in water, and then subjected these to qPCR analysis. Initially, we performed experiments using several 10-fold dilutions of purified DNA, with 100 ng/reaction as the highest concentration and 0.0001 ng/ reaction as the lowest. Linearity was lost in the reactions with the highest and lowest DNA concentrations, and the curve shape was significantly altered (not shown). We therefore switched to a 4-fold dilution series starting from 32 ng/reaction and ending at 0.002 ng/reaction, resulting in evenly spaced amplification curves (Figure 2C). As expected, the amplification curve shifted to the right with even spacing as the input target quantity was reduced. This can be explained theoretically: reactions with fewer target molecules require more amplification cycles to produce a certain quantity of detectable fluorescent signal. Given the primer design was chosen to amplify intergenomic sequences, which are of various lengths, we used short and long length DNA for developing the standards. There was minimal difference between the results obtained with the two systems and there was minimal impact of prolonging the duration of the PCR cycle times. Therefore, the detection system used was sufficiently sensitive and reproducible to detect template DNA over the range from 0.002—32 ng.
The standard curve was expressed as a plot of the threshold cycle (CT) against the input target quantity, with the latter plotted on a common log scale (Figure 2D). CT was inversely related to the amount of template present at the start of the amplification reaction. The linearity of the graph was excellent over the wide range of DNA content (R2=0.996).
The reliability of qPCR was tested by measuring recovery of DNA from spiked plasma samples. As shown in Table 1, at the DNA concentration levels tested here, the amounts of DNA spiked to the plasma samples exhibited average recoveries of 69∼106%. The recoveries corresponding to the two concentrations for each sample did not differ greatly, indicating that qPCR is satisfactorily reliable and consistent when used to directly estimate DNA quantity in routine plasma samples.
Table 1. Recovery of DNA from mouse plasma by qPCR*.
| Test Set | Baseline (ng/reaction**) | Spiked (ng/reaction) | Expected (ng/reaction**) | Measured by qPCR (ng/reaction**) | Recovery (%) | Mean ± SEM (%) |
|---|---|---|---|---|---|---|
| Low range | 0.035 | 0.1 | 0.135 | 0.165 | 122.2 | 105.65 ± 23.41 |
| 0.037 | 0.1 | 0.137 | 0.122 | 89.1 | ||
| High range | 0.035 | 1.0 | 1.035 | 0.733 | 70.8 | 68.60 ±.3.11 |
| 0.037 | 1.0 | 1.037 | 0.689 | 66.4 |
Recoveries were the ratio of total DNA measured by qPCR over the quantity of DNA consisting of the pre-existing and spiked DNA in the samples as described in Material and Methods.
Each representing mean values from triplicate assays.
Application of qPCR in quantifying plasma DNA
The high frequency of the B1 element in murine genomic DNA, and therefore the potential for using it to detect murine DNA in the circulation, was tested using qPCR. We first employed this technique to monitor alterations of plasma DNA concentration over time after 10 Gy TBI in mice. We found that the mean baseline plasma DNA level was low and that the peak level measured at 9 hours was increased more than ten-fold above baseline levels. The time course of the plasma DNA was modal and included detectable levels at 3 hours, a peak at 9 hours, and a rapid decline by 24 hours. The levels returned to near normal at 48 hours. The mean concentration of the total plasma DNA was 12 ng/ml in non-exposed mice and either 139, 176, 377, 32, or 9 ng/ml in the exposed mice at 3, 6, 9, 24, and 48 hours post-exposure, respectively (Fig. 3A). This observation was qualitatively confirmed by electrophoresis of the qPCR products from the same samples (Fig. 3B). The intensity of the qPCR products started increasing at 3 hours (lane 3), progressed at 6 hours (lane 4), reaching a maximum at 9 hours (lane 5). The intensity of the qPCR products then faded to the control level at 24 hours (lane 6) and 48 hours (lane 7, Fig. 3B). Apart from the overall intensity difference in various lanes, another feature of the qPCR products in the gel was that they were visualized as a smear in each lane with greatest intensity at 130 bp (Fig. 3B). This may be due to the formation of various inter-B1 PCR products, which vary in size from 100 to 1500 bp but largely appear to be approximately 130 bp.
The next test was to determine if the released plasma DNA was correlated with the dose of TBI. For this experiment, mice received TBI with a dose of 0, 2, 4, 6 or 10 Gy. Samples were collected 9 hours after irradiation. As shown in Fig. 4A, the quantity of total DNA in plasma increased monotonically with dose. The mean values of plasma DNA at 9 hours after 2, 4, 6, or 10 Gy were 6, 79, 117, and 518 ng/ml, respectively. There was a marked correlation between radiation doses and plasma DNA levels (correlation coefficient R2 = 0.917), indicating that this assay is potentially useful as biodosimeter. Clinically, this early increase in circulating DNA corresponds to a dose range in which lethality increases sharply, although the death of animals does not occur until later (7 to 30 days). Again, the result of qPCR can be directly visualized in the gel image (Fig. 4B).
Tolerance to radiation varies greatly with the volume of the body irradiated. To address this aspect of radiation bio-response we collected plasma 9 hours after 10 Gy exposure, restricted to only the partial-body exposures: upper body (diaphragm-up) or lower body (diaphragm-down). These were completely separate experiments from those in the previous figure. The results of inter B1-qPCR confirmed that in the upper torso model, the plasma DNA concentration was 250 ng/ml, much higher than the pre-exposure level (5 ng/ml in this experiment) but half the level seen previously with TBI. Likewise, in the lower torso model, the pre-exposure level of plasma DNA was 5 ng/ml, and surged to 252 ng/ml at 9 hours after exposure to 10 Gy.
Discussion
Identifying molecular biomarkers of radiation response is of growing interest. Biomarkers should prove very important for evaluating biological damage after accidental or malevolent exposure to ionizing radiation, monitoring the progress of radiation therapy, and for early prediction of treatment toxicity. Finally, biomarkers of radiation effects should prove useful for the screening of new radioprotective agents.
Most available biomarkers of radiation toxicity are measures of genotoxicity rather than cytotoxicity, and most are cell-based assays. These systems commonly require cell culture and special processing or cytological evaluation (e.g., chromosomal aberrations). Many of the biological effects are delayed days or longer (e.g., lymphocyte counts and micronuclei), and thus may not be available in the time frame they are needed. Finally, cell-based biodosimeters typically respond to a limited radiation dose range. For example, some work best at high doses (e.g., EPR where the likely range is ≥2 Gy) or lower doses (e.g., chromosomal aberrations where the most useful range is <5 Gy). Thus no single assay fully satisfies the need for biodosimetry. There is therefore a great need for methods that can be used within the first 24 hours of exposure, that allow for high-throughput automation, and that can measure damage related to the full clinically relevant radiation exposure scale (0 to 10 Gy).
Our work builds on discoveries by others, first reported in 1987 (12-18, 23, 24). Our findings and approach differ in several important ways: 1) the molecule studied and method used: we used real-time PCR to amplify inter B1 sequences, a specific genomic repeat, while they used the agarose gel to evaluate fragmentation of the whole genome. Others have recently used real-time PCR to measure the released mitochondrial DNA; 2) the radiation dose: we focused on the clinically relevant low dose range (< 10 Gy) while the studies available in the English literature emphasized higher doses 8-100 Gy; 3) the animal model: they employed the rat model exclusively, while we utilized mice; 4) the sample source: the clotting process is likely to cause the release of DNA from blood cells, and we therefore used plasma rather than serum to improve specificity. These technique refinements take us closer to a methodology that is likely to produce reliable and quantitative results that will enable the development of a useful human biodosimeter.
Circulating DNA is always present at low levels but is elevated within a few hours of irradiation. In mice it reaches a peak at about 9 hours and then declines to near background within a day. In rats, an even earlier peak of plasma DNA was reported (25). Human plasma DNA kinetics following irradiation remain unknown and the variability between subjects will also need to be studied. The modal kinetics of circulating DNA following irradiation is a double-edged sword: it permits an estimation of the time of irradiation through two measurements spaced a few hours apart, while, alternatively, if the time of radiation and of specimen collection is known, the dose can be estimated; however, quantitation of radiation dose becomes difficult after 24 hours, and likewise dose estimates will have large errors for samples not collected near the peak time point. Thus this method will need to be complemented by other techniques. Radiation is just one trauma that victims of radiological exposure might experience. We do not yet know whether other traumas will also cause circulating DNA to accumulate. Combined traumas with radiation are known to greatly augment the lethality of irradiation. We are therefore interested to study whether this assay might predict lethality in the case of otherwise tolerable radiation doses, when combined with other trauma (burns, blunt or open wounds, infection, etc).
The presence of DNA in plasma is now a well-established phenomenon. Generally, the concentration of DNA in plasma ranges between 10-100 ng/ml in healthy humans (26, 27). In disease states such as cancer, levels as high as 318 to 36,000 ng/ml are common (26, 28). In experimental animals exposed to radiation, we found the level of circulating DNA to be dose-dependent. In our study it ranged from 5 to 12 ng/ml in non-irradiated mice, compared with 79 to 517 ng/ml in irradiated mice. Similarly, plasma DNA levels were reported to be 50 to 340 ng/ml after irradiation in a study using rats (16). Our studies demonstrate that the radiation induced elevation of plasma inter-B1 DNA is dependent on the time after radiation exposure, the radiation dose, and the volume of the animal exposed to radiation. These dependencies have advantages and disadvantages that require further investigation in order to maximize the utility of our proposed method.
The source of the circulating DNA is unknown. Dying cells are likely the major sources of DNA released into the plasma (29). We do not yet know the cell type(s) responsible for releasing DNA into the circulation. The B1 sequence is present in all cells and plasma can clearly accept DNA from cells anywhere in the body, and cells from all organs are involved in apoptosis. Thus the cell source of circulating DNA is likely mixed. It is reasonable however to postulate that real time inter-B1 qPCR sensitively detects apoptosis in lymphocytes or endothelial cells. Both these cell types are known to undergo apoptosis within hours of low-dose irradiation in vitro (30, 31). An estimated 1000 single strand DNA breaks occur per 1 Gy per genome (32). The breaks occur in a roughly linear manner with increasing radiation dose. It is interesting to postulate that some of this damaged DNA finds its way to the circulation independent of apoptosis. Other phenomena known to occur after radiation also result in circulating DNA. These include bystander responses (33), adaptive responses (34), low-dose hypersensitivity (35), and genomic instability (33). Some of these are not strictly dose-dependent and may not occur in the 48-hour window of our experiments. The effects of age, gender, infection, physical and chemical trauma, and other insults on DNA levels in the peripheral blood remain unknown and will be the subject of future studies. The existence of circulating DNA in non-exposed animals suggests that, in normal situations, only a small portion of DNA is able to escape clearance. The mechanisms above underscore that circulating DNA could prove a valuable biomarker for radiation toxicity, and the method presented in this study demonstrates that the inter B1-qPCR assay can be readily applied to investigate radiation response.
In humans, the Alu sequence replaces the B1 sequence. Alu is the most abundant repeat in the human genome (36, 37), with over 106 copies accounting for 6—13% of the haploid genome (38, 39). Detection of Alu should outperform that of B1 given the lower number of repeats of the latter per haploid mouse genome (130,000—180,000 copies) (40). Alu and B1 sequences are 75% homologous (41) and therefore translation of our inter B1-qPCR method to an Alu-focused technique should present little challenge. The time and dose response of circulating DNA in human plasma however may be very different than for mice depending on the rate of cellular release of DNA, the rate of digestion in the circulation, and the DNA clearance by the hepatic, splenic, and lymphatic systems.
Conclusion
In conclusion, we present a method to directly quantitate DNA levels in mouse plasma. We have also shown that plasma DNA detected using real-time PCR of inter-B1 sequences increases with radiation dose and has a very specific time course after radiation exposure. The techniques presented can be performed on unprocessed plasma and can detect levels of DNA as low as 0.002 ng and as high as 30 ng. The results can be obtained within 2.5 hours after specimen collection. In addition, the method is adaptable to high-throughput automation. Further research is needed to determine whether this technique can distinguish between risk of lethal partial-body exposure and combined radiation and trauma. Questions about the potential for false positives, such as might be exhibited by undiagnosed cancer, also need to be resolved. It may be that concurrent analysis of sub-classes of DNA, such as mitochondrial DNA, will allow distinction between sources of circulating DNA.
Figure 5. Effect of partial body irradiation on plasma DNA level.
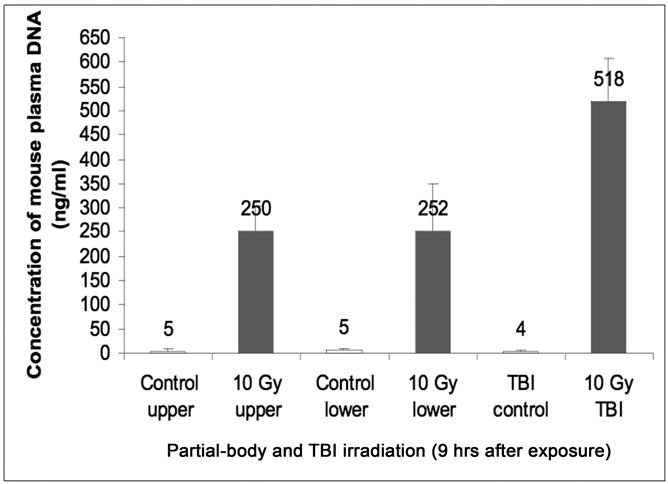
Plasma was collected at 9 hours after exposure of upper torso only (effectively lung and liver exposure), or only the lower torso, i.e. the abdominal and pelvic region, to 10 Gy irradiation. Partial-body irradiation induced approximately half the amount of circulating DNA as compared with total-body exposure. The DNA level in the plasma samples was measured as described in Methods and Materials. Data points denote the mean ± SD of 5 mice per treatment. Control animal were mock-irradiated.
Acknowledgments
This research was supported by the Centers for Medical Countermeasures against Radiation program, U19-AI067733, National Institute of Allergy and Infectious Diseases (NIAID). The authors wish to thank Amy K. Huser for thoughtful writing and editing contributions.
Footnotes
Conflict of Interest Notification: The authors acknowledge that a conflict of interest exists; Dr. Lurong Zhang and Dr. Paul Okunieff are co-owners of the technology development company DiaCarta, which owns intellectual property related to the measurement of radiation exposure using circulating DNA.
References
- 1.Leonard A, Rueff J, Gerber GB, et al. Usefulness and limits of biological dosimetry based on cytogenetic methods. Radiat Prot Dosimetry. 2005;115:448–454. doi: 10.1093/rpd/nci061. [DOI] [PubMed] [Google Scholar]
- 2.Blakely WF, Prasanna PG, Grace MB, et al. Radiation exposure assessment using cytological and molecular biomarkers. Radiat Prot Dosimetry. 2001;97:17–23. doi: 10.1093/oxfordjournals.rpd.a006633. [DOI] [PubMed] [Google Scholar]
- 3.Jacquemont C, Taniguchi T. Proteasome function is required for DNA damage response and fanconi anemia pathway activation. Cancer Res. 2007;67:7395–7405. doi: 10.1158/0008-5472.CAN-07-1015. [DOI] [PubMed] [Google Scholar]
- 4.Hatayoglu SE, Orta T. Relationship between radiation induced dicentric chromosome aberrations and micronucleus formation in human lymphocytes. J Exp Clin Cancer Res. 2007;26:229–234. [PubMed] [Google Scholar]
- 5.Swartz HM, Iwasaki A, Walczak T, et al. Measurements of clinically significant doses of ionizing radiation using non-invasive in vivo EPR spectroscopy of teeth in situ. Appl Radiat Isot. 2005;62:293–299. doi: 10.1016/j.apradiso.2004.08.016. [DOI] [PubMed] [Google Scholar]
- 6.Swartz HM, Iwasaki A, Walczak T, et al. In vivo EPR dosimetry to quantify exposures to clinically significant doses of ionizing radiation. Radiat Prot Dosim. 2006;120:163–170. doi: 10.1093/rpd/nci554. [DOI] [PubMed] [Google Scholar]
- 7.Desrosiers M, Schauer DA. Electron paramagnetic resonance (EPR) biodosimetry. Nucl Instrum Meth. 2001;184:219–228. [Google Scholar]
- 8.Ge M, Shi D, Wu Q, et al. Fluctuation of circulating tumor cells in patients with lung cancer by real-time fluorescent quantitative-PCR approach before and after radiotherapy. J Cancer Res Ther. 2005;1:221–226. doi: 10.4103/0973-1482.19591. [DOI] [PubMed] [Google Scholar]
- 9.Orre LM, Pernemalm M, Lengqvist J, et al. Up-regulation, Modification, and Translocation of S100A6 Induced by Exposure to Ionizing Radiation Revealed by Proteomics Profiling. Mol Cell Proteomics. 2007;6:2122–2131. doi: 10.1074/mcp.M700202-MCP200. [DOI] [PubMed] [Google Scholar]
- 10.Kim SY, Seo M, Oh JM, et al. Inhibition of gamma ray-induced apoptosis by stimulatory heterotrimeric GTP binding protein involves Bcl-xL down-regulation in SH-SY5Y human neuroblastoma cells. Exp Mol Med. 2007;39:583–593. doi: 10.1038/emm.2007.64. [DOI] [PubMed] [Google Scholar]
- 11.Amundson SA, Fornace AJ., Jr Gene expression profiles for monitoring radiation exposure. Radiat Prot Dosimetry. 2001;97:11–16. doi: 10.1093/oxfordjournals.rpd.a006632. [DOI] [PubMed] [Google Scholar]
- 12.Belokhvostov AS, Lebedev SN, Sherlina SS. Changes in the serum fraction composition of nucleic acids in radiation injuries. Alterations in an early period after gamma-irradiation of rats. Radiobiologiia. 1987;27:505–510. [PubMed] [Google Scholar]
- 13.Baleva LS, Sipiagina AE, Smotriaeva MA, et al. Markers of the metabolic changes arising as a result of ionizing radiation exposure. Izv Akad Nauk Ser Biol. 1995;6:657–568. [PubMed] [Google Scholar]
- 14.Vladimirov VG, Tishchenko LI, Surkova EA, et al. Extracellular DNA of blood after irradiation. Radiats Biol Radioecol. 1993;33:854–860. [PubMed] [Google Scholar]
- 15.Vasiléva IN, Belokhvostov AS, Vladimirov VG, et al. Structure of low-molecular DNA in the blood plasma of irradiated rats. Radiats Biol Radioecol. 1993;33:700–705. [PubMed] [Google Scholar]
- 16.Vasilyeva IN. Low-molecular-weight DNA in blood plasma as an index of the influence of ionizing radiation. Ann NY Acad Sci. 2001;945:221–228. doi: 10.1111/j.1749-6632.2001.tb03889.x. [DOI] [PubMed] [Google Scholar]
- 17.Veniaminova NA, Vassetzky NS, Kramerov DA. B1 SINEs in different rodent families. Genomics. 2007;89(6):678–686. doi: 10.1016/j.ygeno.2007.02.007. [DOI] [PubMed] [Google Scholar]
- 18.Vladimirov VG, Belokhvostov AS, Sherlina SS, et al. Contents of extracellular DNA in blood of irradiated rats. Biull Eksp Biol Med. 1992;113:188–191. [PubMed] [Google Scholar]
- 19.Hem A, Smith AJ, Solberg P, et al. Saphenous vein puncture for blood sampling of the mouse, rat, hamster, gerbil, guineapig, ferret and mink. Lab Anim. 1998;32:364–368. doi: 10.1258/002367798780599866. [DOI] [PubMed] [Google Scholar]
- 20.Kingsmore SF, Barbosa MD, Nguyen QA, et al. Physical mapping of the beige critical region on mouse chromosome 13. Mamm Genome. 1996;7:773–775. doi: 10.1007/s003359900231. [DOI] [PubMed] [Google Scholar]
- 21.Walker JA, Kilroy GE, Xing J, et al. Human DNA quantitation using Alu element-based polymerase chain reaction. Anal Biochem. 2003;315(1):122–128. doi: 10.1016/s0003-2697(03)00081-2. [DOI] [PubMed] [Google Scholar]
- 22.Krayev AS, Kramerov DA, Skryabin KG, et al. The nucleotide sequence of the ubiquitous repetitive DNA sequence B1 complementary to the most abundant class of mouse fold-back RNA. Nucleic Acids Res. 1980;8:1201–1215. doi: 10.1093/nar/8.6.1201. [DOI] [PMC free article] [PubMed] [Google Scholar]
- 23.Evdokimovskiĭ EV, Patrushev MV, Ushakova TE, et al. Sharp changes in the copy number of mtDNA and its transcription in the blood cells of X-ray irradiated mice are observed, and mtDNA fragments appear in the blood serum. Radiats Biol Radioecol. 2007;47:402–407. [PubMed] [Google Scholar]
- 24.Patrushev MV, Patrusheva VE, Kasymov VA, et al. Release of mtDNA from mitochondria and activation of its replication in tissues of irradiated mice. Tsitologiia. 2006;48:684–690. [PubMed] [Google Scholar]
- 25.Sherlina SS, Vladimirov VG. Postradiation DNA polymorphism. Ann NY Acad Sci. 2001;945:229–233. doi: 10.1111/j.1749-6632.2001.tb03890.x. [DOI] [PubMed] [Google Scholar]
- 26.Sozzi G, Conte D, Mariani L, et al. Analysis of circulating tumor DNA in plasma at diagnosis and during follow-up of lung cancer patients. Cancer Res. 2001;61:4675–4678. [PubMed] [Google Scholar]
- 27.Lichtenstein AV, Melkonyan HS, Tomei LD, et al. Circulating nucleic acids and apoptosis. Ann NY Acad Sci. 2001;945:239–249. doi: 10.1111/j.1749-6632.2001.tb03892.x. [DOI] [PubMed] [Google Scholar]
- 28.Stroun M, Anker P, Lyautey J, et al. Isolation and characterization of DNA from the plasma of cancer patients. Eur J Cancer Clin Oncol. 1987;23:707–712. doi: 10.1016/0277-5379(87)90266-5. [DOI] [PubMed] [Google Scholar]
- 29.Prise KM, Schettino G, Folkard M, et al. New insights on cell death from radiation exposure. Lancet Oncol. 2005;6:520–528. doi: 10.1016/S1470-2045(05)70246-1. [DOI] [PubMed] [Google Scholar]
- 30.Peña LA, Fuks Z, Kolesnick RN. Radiation-induced apoptosis of endothelial cells in the murine central nervous system: protection by fibroblast growth factor and sphingomyelinase deficiency. Cancer Res. 2000;60:321–327. [PubMed] [Google Scholar]
- 31.Belka C, Marini P, Budach W, et al. Radiation-induced apoptosis in human lymphocytes and lymphoma cells critically relies on the up-regulation of CD95/Fas/APO-1 ligand. Radiation Res. 1998;149:588–595. [PubMed] [Google Scholar]
- 32.Ward JF. DNA damage produced by ionizing radiation in mammalian cells: Identities, mechanisms of formation, and repairability. Prog Nucleic Acids Res Mol Biol. 1988;35:95–125. doi: 10.1016/s0079-6603(08)60611-x. [DOI] [PubMed] [Google Scholar]
- 33.Morgan WF. Non-targeted and delayed effects of exposure to ionizing radiation: I. radiation-induced genomic instability and bystander effects in vitro Radiat Res. 2003;159:567–580. doi: 10.1667/0033-7587(2003)159[0567:nadeoe]2.0.co;2. [DOI] [PubMed] [Google Scholar]
- 34.Wolff S. The adaptive response in radiobiology: evolving insights and implications. Environ Health Perspect. 1998;106(Suppl 1):277–283. doi: 10.1289/ehp.98106s1277. [DOI] [PMC free article] [PubMed] [Google Scholar]
- 35.Joiner MC, Marples B, Lambin P, et al. Low-dose hypersensitivity: current status and possible mechanisms. Int J Radiat Oncol Biol Phys. 2001;49:379–389. doi: 10.1016/s0360-3016(00)01471-1. [DOI] [PubMed] [Google Scholar]
- 36.Jelinek WR. Repetitive sequences in eukaryotic DNA and their expression. Ann Rev Biochem. 1982;51:813–844. doi: 10.1146/annurev.bi.51.070182.004121. [DOI] [PubMed] [Google Scholar]
- 37.Laird CD. Chromatid structure: relationship between DNA content and nucleotide sequence diversity. Chromosoma. 1971;32:378–406. doi: 10.1007/BF00285251. [DOI] [PubMed] [Google Scholar]
- 38.Deininger PL. SINEs: short interspersed repeated DNA elements in higher eukaryotes. In: Howe M, Berg D, editors. Mobile DNA. Washington, DC: American Society for Microbiology Press; 1989. pp. 619–636. [Google Scholar]
- 39.Mighell AJ, Markham AF, Robinson PA. Alu sequences. FEBS Letters. 1997;417:1–5. doi: 10.1016/s0014-5793(97)01259-3. [DOI] [PubMed] [Google Scholar]
- 40.Bennett KL, Hill RE, Pietras DF, et al. Most highly repeated dispersed DNA families in the mouse genome. Mol Cell Biol. 1984;4:1561–1571. doi: 10.1128/mcb.4.8.1561. [DOI] [PMC free article] [PubMed] [Google Scholar]
- 41.Haynes SR, Toomey TP, Leinwand L, et al. The Chinese hamster Alu-equivalent sequence: a conserved highly repetitious, interspersed deoxyribonucleic acid sequence in mammals has a structure suggestive of a transposable element. Mol Cell Biol. 1981;1(7):573–583. doi: 10.1128/mcb.1.7.573. [DOI] [PMC free article] [PubMed] [Google Scholar]