i. Summary
Myoblast fusion requires a number of cellular behaviors, including cell migration, recognition and adhesion as well as a series of subcellular behaviors, such as cytoskeletal rearrangements, vesicle trafficking and membrane dynamics leading to two cells becoming one. With the discovery of fluorescent proteins that can be introduced and followed within living cells, the possibility of monitoring these complex processes within the living embryo is now a reality. Live imaging, unlike imaging techniques in fixed embryos, allows the opportunity to visualize and measure the dynamics of these processes in vivo. This chapter describes the development and use of live imaging techniques to study myoblast fusion in Drosophila.
Keywords: Drosophila, myoblast fusion, muscle development, fluorescent proteins, live imaging
1. Introduction
There are 30 individual muscles per hemisegment of the Drosophila embryo. Formation of these individual body wall muscles depends on the specification and fusion of two myoblast cell types, founder cells (FCs) and fusion-competent myoblasts (FCMs) (discussed in greater detail in Chapter X). Each FC contains the necessary information to direct the formation of a specific muscle. FCs can be identified by expression of identity genes, such as the transcriptional regulators even-skipped, apterous, slouch and Kruppel. The combination of identity genes expressed by a particular FC is thought to regulate the final morphology of the specific muscle. FCMs, in contrast, are thought to be naïve cells. Upon fusion to an FC, FCMs become reprogrammed to the FC’s specific developmental program, as witnessed by each newly incorporated FCM nucleus expressing the FC’s particular combination of identity genes (1–5). Myoblast fusion is a reiterative process; depending on the particular muscle, body wall muscles in Drosophila embryos arise from between 2 and 25 fusion events (6).
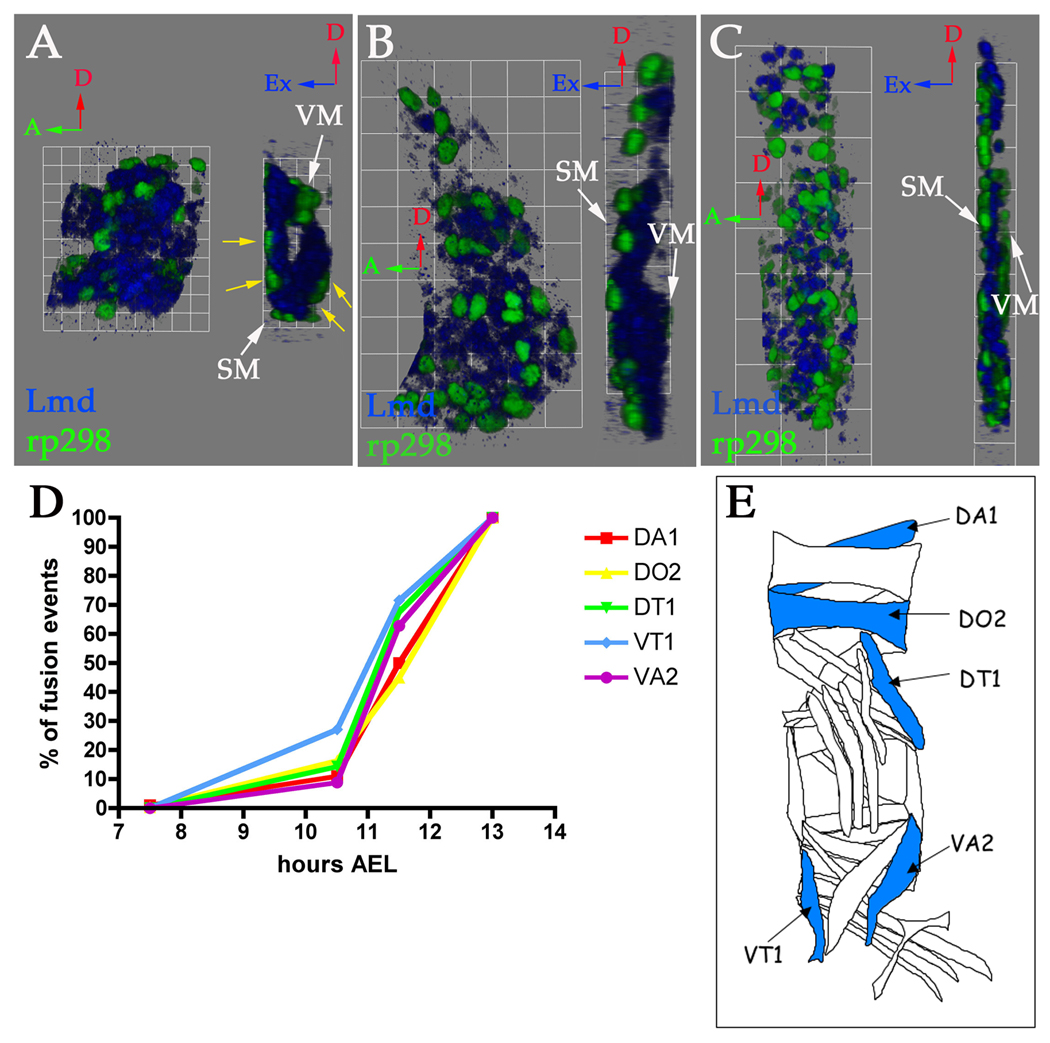
Fusion occurs during stages 12 to 15 [7.5–13 hrs after egg laying (AEL)]. FCs/myotubes and FCMs are arranged in multiple cell layers prior to and during the fusion process [Figure 1; (7)]. As fusion commences, the mesoderm is arranged with the FCs occupying both the most external and internal positions with multiple layers of FCMs found in between (Figure 1A). As germband retraction and dorsal closure proceed during stages 13 and 14, the ventral FCs/myotubes and FCMs move externally to lie underneath the epidermis and central nervous system (Figure 1B–C). While some FCMs contact the FCs/myotubes and are responsible for the initial fusion events, the remaining FCMs are located more internally and must migrate to find their fusion partners. An appreciation of these cell arrangements and movements is essential for the analysis of myoblast fusion.
Figure 1. FC and FCM arrangements and fusion profile of individual muscles.
(A–C) Stage 12 (A), 13 (B) and 14 (C) rp298-lacZ embryos were stained with antibodies against ß-gal to label FC/myotube nuclei (green) and Lmd to label FCMs (blue). Three-dimensional renderings of single mesodermal hemisegments at stage 12 (A, 1 grid unit = 5.7 µm), 13 (B, 1 grid unit = 10.9 µm) and 14 (C, 1 grid unit = 14.1 µm) are shown. Each panel shows an external view (left) and a side view rotated 90° clockwise (right). Red arrows point to dorsal, green arrows point to anterior and blue arrows point to external. SM stands for somatic mesoderm and VM stands for visceral mesoderm. (A) At stage 12 the somatic mesoderm folds into two layers so that the FCs (green) are concurrently the most external and internal cells (yellow arrows, A), with the FCMs (blue) in between. (B) At stage 13, the internal FCs and FCMs have moved externally to underlay the overlaying epidermis (not labeled). The FCs (green) appear to rest on top of the FCMs (blue) at this stage and the cells are tightly packed together. (C) By stage 14, the number of rp298-lacZ expressing nuclei (green) have increased due to fusion. The FCMs (blue) have separated from one another. (D) Wild type stage 12–15 embryos were stained with antibodies against Eve (DA1), Runt (DO2) or Slouch (DT1, VT1 and VA2) in combination with phalloidin to assist accurate staging. The number of nuclei for each muscle and stage were counted in 50 hemisegments (A2-4). Graph showing the percentage of fusion events that occur during each stage for each muscle during the course of fusion (7.5–13 hours AEL). The mean number of nuclei observed for each muscle at stage 15 is 100% and a single nucleus is 0%. (E) Schematic showing which muscles were analyzed for wild type fusion profiles (blue). Adapted from (7).
Fusion does not start concurrently in all muscles [Figure 1D; (7)]. For example, fusion begins during stage 12 (7.5–9.5 hrs AEL) in the dorsal DA1 muscle, but does not begin until stage 13 (9.5–10.5 hrs AEL) in the ventral VA2 muscle. However, for all muscles examined to date, the majority of fusion events occur during stage 14 (10.5–11.5 hrs AEL; Figure 1D), making this a particularly useful stage for the analysis of the cellular biology underlying myoblast fusion.
While genetic analysis has revealed a number of genes required for the fusion process (reviewed in Chapter x), their precise function during fusion has been hampered by the lack of direct, cellular assays. For example, while many of the known genes encode regulators of the actin cytoskeleton (8), the impact of cytoskeletal rearrangements on fusion were unclear. Furthermore, the arrangements of FCs and FCMs (7) have implicated a critical role of migration in the fusion process that remains to be analyzed. Lastly, the site of fusion has only been implied by localization of proteins implicated in fusion and not directly located. To address these issues, we developed live imaging techniques in Drosophila to further our understanding of the myoblast fusion process. This chapter deals with the methodology and considerations underlying this approach including collection and mounting of the embryos for live imaging, as well as the imaging itself and techniques for processing and presenting the data.
2. Materials
2.1 Embryo Collection
Embryo laying chamber: 100 ml plastic beaker, punched with holes to allow air exchange and prevent condensation.
Embryo collection plates, attached to laying chamber with rubber band: Microwave 1500 ml of ddH2O, 50 g of granulated sugar and 45 g of agar until an even solution is formed. Add 500 ml of cold apple juice. Cool to 65°C, add 40 ml of 10% Tegosept in 100% Ethanol. Pour into 35mm Petri dishes, makes approximately 200.
Yeast paste: water plus dry baker’s yeast, stirred to make a paste. Store at 4°C.
Paint brush.
Dechorionating baskets: cut the top off of a 15 ml Falcon tube at approximately the 12 ml line, cut the center out of the tube cap.
Nitex membrane, screwed onto the dechorionating basket with the cap.
50% Clorox bleach.
Small Petri dish.
2.2 Embryo Mounting
For inverted microscopy – uncoated 35mm glass bottom microwell dish (Mattek Cultureware).
For upright microscopy – air-permeable Teflon membrane mounted on Perspex frame (designed by E. Wieschaus)(9,10).
Microscope slides.
Embryo hook.
18 × 18 mm Coverslips.
22 × 40 mm Coverslips.
Technau glue – double-sided Scotch tape dissolved in heptane.
Halocarbon oil 700 (Halocarbon Products Corp.).
2.3 Fluorescent Proteins
When selecting a fluorescent protein for live imaging studies, important factors include brightness of signal, spectral properties, folding time, and cytotoxicity [reviewed in (11)]. Brightness in particular is of utmost important in the developing musculature, which extends several cell layers and up to 25 µm below the surface of the embryo. Fluorescent proteins that we have used successfully to label the forming musculature of the embryo are listed in Table 1. The protein of choice for most purposes continues to be green fluorescent protein (GFP). GFP is small, non-toxic, and easily visualized with most fluorescent microscopes. Mutation of the original sequence has provided derivatives with enhanced properties, such as increased thermostability, increased expression, and optimized excitation peaks (12). For co-labeling studies requiring the use of multiple fluorescent proteins, yellow fluorescent proteins (YFPs) and red fluorescent proteins (RFPs) have both proven useful. We have not encountered a cyan fluorescent protein (CFP) that is bright enough to visualize myogenesis. YFPs require newer filter sets to distinguish their emission signal from GFP. DsRed, the original RFP, had problems with slow maturation times and contamination of the GFP signal (13). However, we have had success with DsRed.T4, which does not produce green fluorescence and has substantially improved maturation time (14,15).
Table 1. Fluorescent proteins useful for live imaging of myoblast fusion.
EGFP=enhanced green fluorescent protein; EYFP=enhanced yellow fluorescent protein; NLS=nuclear localization signal; DsRed=Discosoma Red; H2B=human histone 2B, mCD8 = mouse CD8. Excitation and emission represent approximate maximum values.
| Protein | Localization | Excitation/Emission | Reference/Source |
|---|---|---|---|
| EGFP | cytoplasm | 488nm/509nm | Clontech, (24, 25) |
| EYFP | cytoplasm | 514nm/527nm | Invitrogen, (24) |
| GFP::actin | actin cytoskeleton |
488nm/509nm | (16) |
| GFP::moesin | actin cytoskeleton |
488nm/509nm | (26) |
| GFP::α-Tubulin | Microtubules | 488nm/509nm | (18) |
| NLS::EGFP | Nucleus | 488nm/509nm | (25) |
| NLS::DsRed.T4 | nucleus | 556nm/586nm | (15) |
| H2B:YFP | nucleus | 514nm/527nm | (27) |
| Src::GFP | cell membrane | 488nm/509nm | (9) |
| mCD8::GFP | cell membrane | 488nm/509nm | (17) |
Although the proteins in Table 1 have been quite useful in our studies, fluorescent proteins with increased brightness, distinct spectral properties, and other advantages are being developed constantly and should be considered in any new studies. Thanks to focused engineering, a wide range of fluorescent proteins across all spectra of light are now available. These include mPlum (far-red), mCherry and mStrawberry (red), Venus (yellow), Emerald (green) and Cerulean (cyan), which represent a diverse reagent set for multi-color live imaging (11).
The fusion of fluorescent proteins to other proteins or sequences is useful for marking specific cell structures during fusion. For example, we have used a GFP::actin fusion protein in our studies of the role of the actin cytoskeleton in fusion [(16);Figures 2,3,4], as well a nuclear localization signal fused to DsRed.T4 to track subsets of myoblast nuclei through the fusion process [(15);Figure 4]. Src::GFP and mCD8::GFP are both useful as cell membrane markers (9, 17). A GFP::α-tubulin fusion protein can be used to examine microtubule dynamics (18).
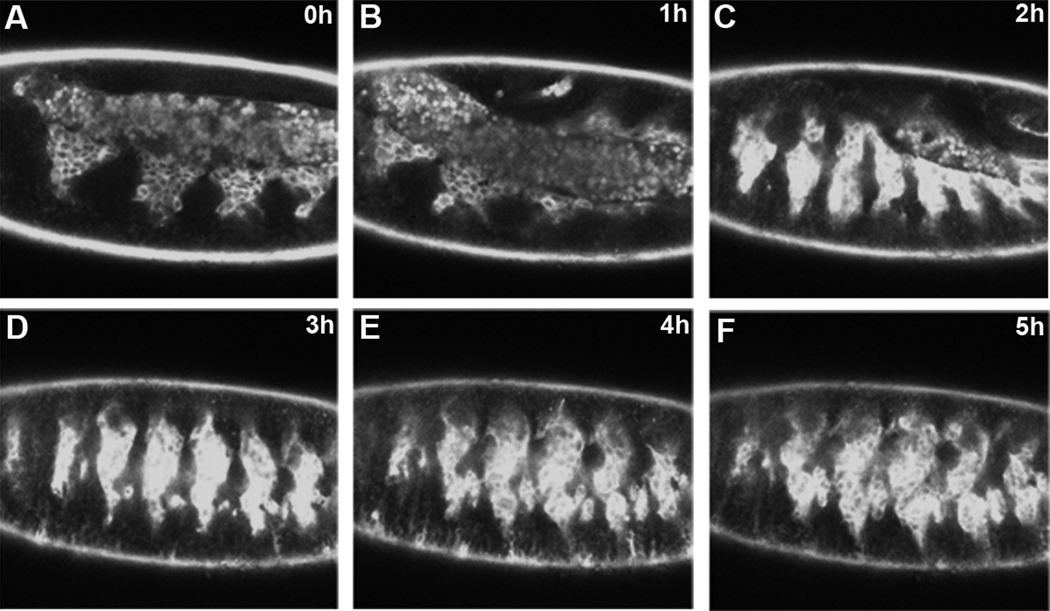
Figure 2. All of Drosophila myogenesis can be visualized using live imaging.
Lateral view of live twi-GAL4; Dmef2-GAL4 × UAS-GFP::actin embryo. These GAL4 lines strongly express throughout myogenesis. Each image represents a single frame from a time lapse sequence over the course of 5 hrs, covering stages 12–15. During this time, most of myoblast fusion is completed. Images are single optical slices. (arrow points to mesodermal hemisegment. * denotes autofluorescence of amnioserosa)
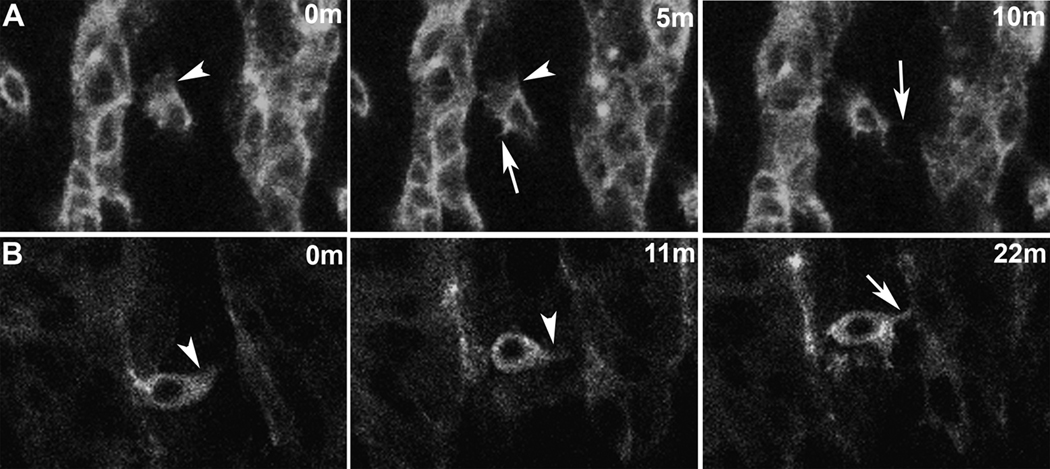
Figure 3. Dynamic actin-bases behaviors of myoblasts.
Lateral views of live twi promoter-GFP::actin embryos. Actin labeling is concentrated at the cell cortices and in cellular extensions such as lamellipodia and filopodia. Such behaviors appear critical for myoblast fusion. The nucleus is evident as a non-labeled structure in the middle of the cells. Each panel represents a single time point from a time lapse sequence. Images are single optical slices.
(A) FC for a segment border muscle prior to fusion extends lamellipodia (arrowhead) and filopoida (arrow). (B) FCM extends lamellipodia (arrowhead) and a filopodium (arrow) prior to fusion.
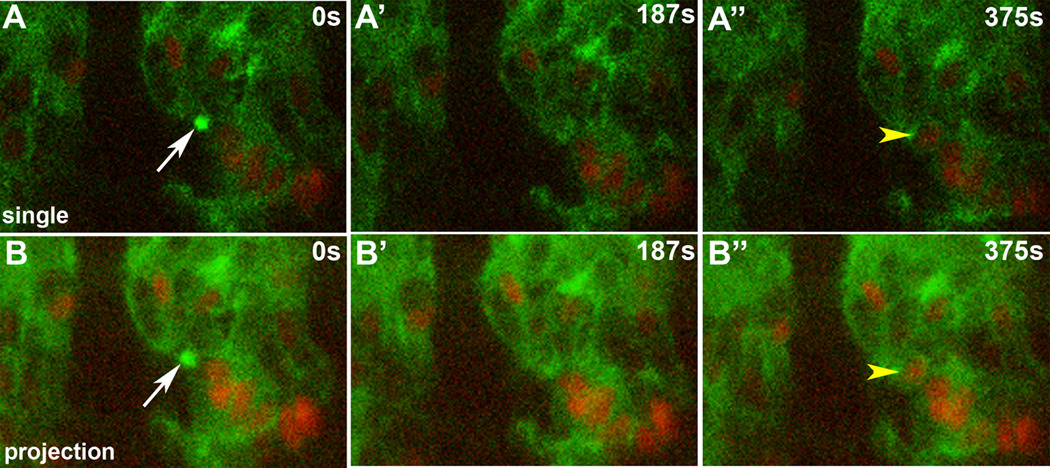
Figure 4. Single myoblast fusion event.
Lateral view of live twist promoter-GFP::actin, apME580-NLS::dsRed.T4 embryo. Each row of panels represents a time point from a time-lapse sequence. (A) Single optical slice. In this sequence, an actin focus (white arrow) forms at the site of adhesion between an FCM and an apterous-labeled myotube. This focus resolves, followed by fusion and addition of an additional labeled nucleus (yellow arrowhead) to the myotube. (B) Same sequence as in A, but as an optical projection displaying 9 µm of the Z-axis.
2.4 Expression of Fluorescent Proteins
The GAL4/UAS system is a widely used system for expressing a variety of proteins, including fluorescent protein, in a tissue-specific manner (19). As mentioned above, brightness of signal is critical, necessitating the use of strongly expressing GAL4 lines. Combining different UAS-fluorescent protein lines under control of a single GAL4 allows labeling of different cell structures, such as actin cytoskeleton and nucleus, with different fluorescent colors. However, the GAL4/UAS system does not allow multicolor labeling of different cell types, such as FCs vs. FCMs. An alternative approach is to create direct enhancer and/or promoter fusions to the coding regions of fluorescent proteins. This allows simultaneous transgenic expression of different fluorescent proteins in two or more cell types, allowing multicolor live imaging. We also observe that fluorescence signal is often visible sooner using enhancer/promoter fusions than a comparable GAL4/UAS combination, presumably because of lag time for GAL4 to bind and activate UAS.
Reagents that we have found useful for driving expression of fluorescent proteins during myoblast fusion are listed in Table 2. Specifically, we have found the twist promoter (20) to be a useful way to drive expression throughout the mesoderm during all stages of myogenesis, both as a GAL4 construct and fused to GFP::actin (Figures 2–4). Specific enhancers of FC identity genes, such as apterous even-skipped, and slouch (2, 21–23), are useful for visualizing FCs/myotubes as fusion proceeds (Figure 4). We are currently lacking promoters or enhancers for FCM-specific expression, which would facilitate analysis of the contribution of this cell type to the fusion process.
Table 2. Promoters and enhancers useful for driving fluorescent proteins during myoblast fusion.
twi=twist; apME580=apterous Mesodermal Enhancer 580; eveMHE=even-skipped mesoderm and heart enhancer; Mhc=Myosin heavy chain
2.5 Fluorescent Balancer Chromosomes
Analysis of mutants using live imaging presents the additional challenge of correctly separating homozygous and heterozygous embryos. This is especially important since the process being studied often takes place before the final mutant phenotype is apparent. Correct identification can be achieved by negative selection against a fluorescently labeled balancer chromosome. In our hands, the CTG (Cyo, twi-GAL4, UAS-2XEGFP) and TTG (TM3, twi-GAL4, UAS-2XEGFP) balancers created by A. Michelson’s group can be easily identified under a standard dissecting scope fitted for fluorescence microscopy (24).
3. Methods
3.1 Embryo Collection
Collect embryos of the appropriate age on an apple juice/agar plate.
Wash embryos into an embryo basket using water and a paintbrush.
Dechorionate embryos for 3 minutes in 50% Clorox bleach in a Petri dish, then rinse well with water.
3.2 Embryo Mounting
Transfer embryos to a microscope slide with a paintbrush and cover them with Halocarbon 700 oil.
Select embryos of the appropriate age and genotype (using negative selection against fluorescent balancers, if necessary).
For an upright microscope, apply a thin layer of Technau glue onto an air-permeable Teflon membrane stretched over a Perspex frame. Place embryos onto the glue, which will help prevent rolling and drifting (See Note 1). Cover embryos with a drop of Halocarbon 700 oil. Place an 18 × 18 mm coverslip on either side of the embryos and “bridge” them with a 22 × 40 mm coverslip (9,10).
For an inverted microscope, apply a thin layer of Technau glue onto a glass bottom dish. Place embryos onto the glue, which will help prevent rolling and drifting (See Note 1). Cover embryos with a drop of Halocarbon 700 oil.
3.3 Confocal Microscopy
Although it is possible to visualize fluorescent proteins using standard epifluorescence microscopy, Drosophila embryos display a high level of autofluorescence that can obscure the signal of interest. Furthermore, fluorescent signal is significantly dampened in internal cell layers such as the mesoderm. Fortunately, the thin optical sections and relative strength of confocal microscopy can be used to minimize the effects of these problems. Our standard setup for live imaging is a Zeiss LSM510 scanning confocal system mounted on an Axiovert 100M microscope with a 63× 1.2NA C-Apochromat water objective. GFP and YFP can be detected using standard FITC settings, while RFP can be detected using standard rhodamine settings. Newer systems feature more advanced filters and completely filter-less setups, allowing further spectral separation required for the use of newer fluorescent proteins.
A sufficient signal to noise ratio is critical for proper analysis of confocal data. To reduce noise, it is possible to perform frame averaging and decrease the laser scan speed. However, both of these approaches increase photobleaching and phototoxicity (see Note 2) and decrease temporal resolution due to longer scan times. We find frame averaging of 4 frames and a scan speed of 7 (pixel time of 2.56 µs) is a good balance with our system. Laser strength can be raised to increase signal strength, although this also increases photobleaching (see Note 2). We generally set our 488nm laser (which excites GFP) to 25%. Finally, the confocal pinhole can be opened to allow more light to be imaged. However, this increases the thickness of the optical slice and decreases axial resolution. We set the pinhole to capture 1–1.5 µm per optical slice for live imaging. When performing multi-color imaging, it is essential to set pinholes so that the same size of optical slice is captured for each emission spectrum.
One must consider the type of movie desired before beginning an imaging sequence. For example, imaging the entirety of myoblast fusion requires approximately six hours of scanning, making photobleaching a significant hurdle. Therefore, sampling every 5–10 minutes is advisable as it is sufficient to capture overall tissue dynamics while avoiding drastic photobleaching. For more in depth analysis of fusion dynamics, more frequent sampling becomes necessary. Myoblast migration and fusion events occur quite rapidly; therefore, sampling every 1–2 minutes is necessary to gain an appreciation of these processes. Finally, the analysis of subcellular dynamics during an individual migration or fusion event requires even more rapid imaging; we have found relevant cytoskeletal changes to occur on the order of 5–10 seconds. Such temporal resolution stretches the limits of our current setup, but newer confocal systems such as the Zeiss LSM 5 Live have been specifically designed for high speed laser scanning imaging and will increase the temporal resolution of future live imaging studies. Although spinning disc confocal microscopy already exists as a tool used for high speed imaging, we have found its optical resolution insufficient for visualizing myoblast migration and fusion, presumably due to the cells being too internal in the embryo.
A final but critical consideration when imaging myoblast migration and fusion is the analysis of multiple optical slices along the Z-axis of the embryo. Tissue and cell movement can bring cells of interest in and out of a single optical slice, confusing interpretation of true migration and fusion events. Confocal software allows one to scan several optical slices sequentially over time to create a 3D time sequence, also known as 4D imaging. However, scanning multiple optical slices does have disadvantages, such as decreased temporal resolution and increased photobleaching. Therefore, it is desirable to visualize the fewest number of optical slices while still being able to follow all relevant cell movements.
3.4 Processing software
The Zeiss LSM software allows confocal images to be exported in .AVI or .TIF formats. AVI files can be played on PC computers, while Apple Quicktime can be used to compile TIF files into an image sequence. The LSM software can also be used to create optical projections of 3D data. Other confocal software has similar functions. Alternatively, confocal data files can be directly imported into third-party software such as Improvision Volocity for additional 3D reconstruction analysis and presentation options.
4. Notes
4.1 Potential artifacts
Even with specific cell markers and proper technique, several experimental artifacts are possible when imaging myoblast fusion. The yolk cells of the embryo are autofluorescent and often present near the mesoderm, especially during the earliest stages of fusion (Figure 2). Conversely, near the end of myogenesis, autofluorescent macrophages are present near the musculature and should not be confused with myoblasts.
Unintended movement can cause multiple problems during live imaging. Insufficient gluing of the embryo during mounting often results in embryo rolling or lifting, which can be mistaken for tissue or cell movement. Cell and tissue movement between optical slices can also be confused with true cell migration or fusion events. However, proper used of 4D imaging can circumvent this problem, as discussed.
4.2 Photobleaching
All fluorophores, including those present on fluorescent proteins, are eventually destroyed by exposure to light. This problem can be minimized in several ways, such as reducing laser intensity, reducing frame averaging, increasing the scan speed, or increasing the frame delay. Also, selecting the correct promoter or enhancer to drive expression will allow continual synthesis of new fluorescent protein in the cell, replenishing the supply as old protein is extinguished.
Acknowledgements
We wish to thank members of the Baylies lab, Owen Richardson and, especially, Kat Hadjantonakis for stimulating discussions and advice. We also recognize the valuable input from Julia Kaltschmidt during our early days of filming. This work is supported by NIH grants, GM56989 and GM78318, to M.B.
References
- 1.Baylies MK, Bate M, Ruiz Gomez M. Cell. 1998;93:921–927. doi: 10.1016/s0092-8674(00)81198-8. [DOI] [PubMed] [Google Scholar]
- 2.Capovilla M, Kambris Z, Botas J. Development. 2001;128:1221–1230. doi: 10.1242/dev.128.8.1221. [DOI] [PubMed] [Google Scholar]
- 3.Frasch M. Curr Opin Genet Dev. 1999;9:522–529. doi: 10.1016/s0959-437x(99)00014-3. [DOI] [PubMed] [Google Scholar]
- 4.Beckett K, Baylies MK. Dev Biol. 2006;299:176–192. doi: 10.1016/j.ydbio.2006.07.049. [DOI] [PubMed] [Google Scholar]
- 5.Carmena A, Baylies M. In: Muscle Development in Drosophila. Sink H, editor. New York: Landes Bioscience; 2006. pp. 79–89. [Google Scholar]
- 6.Bate M. Development. 1990;110:791–804. doi: 10.1242/dev.110.3.791. [DOI] [PubMed] [Google Scholar]
- 7.Beckett K, Baylies MK. Developmental Biology. 2007 doi: 10.1016/j.ydbio.2007.06.024. in press. [DOI] [PMC free article] [PubMed] [Google Scholar]
- 8.Chen EH, Olson EN. Trends Cell Biol. 2004;14:452–460. doi: 10.1016/j.tcb.2004.07.008. [DOI] [PubMed] [Google Scholar]
- 9.Kaltschmidt JA, Davidson CM, Brown NH, Brand AH. Nat Cell Biol. 2000;2:7–12. doi: 10.1038/71323. [DOI] [PubMed] [Google Scholar]
- 10.Haseloff J, Dormand E, Brand AH. Methods Mol Biol. 1998;122:241–259. doi: 10.1385/1-59259-722-x:241. [DOI] [PubMed] [Google Scholar]
- 11.Shaner NC, Steinbach PA, Tsien RY. Nat Methods. 2005;2:905–909. doi: 10.1038/nmeth819. [DOI] [PubMed] [Google Scholar]
- 12.Zacharias DA, Tsien RY. Methods Biochem Anal. 2006;47:83–120. [PubMed] [Google Scholar]
- 13.Baird GS, Zacharias DA, Tsien RY. Proc Natl Acad Sci U S A. 2000;97:11984–11989. doi: 10.1073/pnas.97.22.11984. [DOI] [PMC free article] [PubMed] [Google Scholar]
- 14.Bevis BJ, Glick BS. Nat Biotechnol. 2002;20:83–87. doi: 10.1038/nbt0102-83. [DOI] [PubMed] [Google Scholar]
- 15.Barolo S, Castro B, Posakony JW. Biotechniques. 2004;36:436–440. doi: 10.2144/04363ST03. 42. [DOI] [PubMed] [Google Scholar]
- 16.Verkhusha VV, Tsukita S, Oda H. FEBS Lett. 1999;445:395–401. doi: 10.1016/s0014-5793(99)00124-6. [DOI] [PubMed] [Google Scholar]
- 17.Lee T, Luo L. Neuron. 1999;22:451–461. doi: 10.1016/s0896-6273(00)80701-1. [DOI] [PubMed] [Google Scholar]
- 18.Grieder NC, de Cuevas M, Spradling AC. Development. 2000;127:4253–4264. doi: 10.1242/dev.127.19.4253. [DOI] [PubMed] [Google Scholar]
- 19.Brand AH, Perrimon N. Development. 1993;118:401–415. doi: 10.1242/dev.118.2.401. [DOI] [PubMed] [Google Scholar]
- 20.Baylies MK, Bate M. Science. 1996;272:1481–1484. doi: 10.1126/science.272.5267.1481. [DOI] [PubMed] [Google Scholar]
- 21.Schnorrer F, Dickson BJ. Dev Cell. 2004;7:9–20. doi: 10.1016/j.devcel.2004.06.010. [DOI] [PubMed] [Google Scholar]
- 22.Knirr S, Azpiazu N, Frasch M. Development. 1999;126:4525–4535. doi: 10.1242/dev.126.20.4525. [DOI] [PubMed] [Google Scholar]
- 23.Halfon MS, Carmena A, Gisselbrecht S, Sackerson CM, Jimenez F, Baylies MK, Michelson AM. Cell. 2000;103:63–74. doi: 10.1016/s0092-8674(00)00105-7. [DOI] [PubMed] [Google Scholar]
- 24.Halfon MS, Gisselbrecht S, Lu J, Estrada B, Keshishian H, Michelson AM. Genesis. 2002;34:135–138. doi: 10.1002/gene.10136. [DOI] [PubMed] [Google Scholar]
- 25.Barolo S, Carver LA, Posakony JW. Biotechniques. 2000;29 doi: 10.2144/00294bm10. 726, 28, 30, 32. [DOI] [PubMed] [Google Scholar]
- 26.Dutta D, Bloor JW, Ruiz-Gomez M, VijayRaghavan K, Kiehart DP. Genesis. 2002;34:146–151. doi: 10.1002/gene.10113. [DOI] [PubMed] [Google Scholar]
- 27.Bellaiche Y, Gho M, Kaltschmidt JA, Brand AH, Schweisguth F. Nat Cell Biol. 2001;3:50–57. doi: 10.1038/35050558. [DOI] [PubMed] [Google Scholar]
- 28.Ranganayakulu G, Schulz RA, Olson EN. Dev Biol. 1996;176:143–148. doi: 10.1006/dbio.1996.9987. [DOI] [PubMed] [Google Scholar]
- 29.Schnorrer F, Kalchhauser I, Dickson BJ. Dev Cell. 2007;12:751–766. doi: 10.1016/j.devcel.2007.02.017. [DOI] [PubMed] [Google Scholar]
- 30.Chen EH, Olson EN. Dev Cell. 2001;1:705–715. doi: 10.1016/s1534-5807(01)00084-3. [DOI] [PubMed] [Google Scholar]


