

Abstract
Fruit and vegetable consumption has been hypothesized to reduce the risk of renal cell cancer. We conducted a pooled analysis of 13 prospective studies, including 1,478 incident cases of renal cell cancer (709 women and 769 men) among 530,469 women and 244,483 men followed for up to 7 to 20 years. Participants completed a validated food-frequency questionnaire at baseline. Using the primary data from each study, the study-specific relative risks (RRs) were calculated using the Cox proportional hazards model and then pooled using a random effects model. We found that fruit and vegetable consumption was associated with a reduced risk of renal cell cancer. Compared with <200 g/d of fruit and vegetable intake, the pooled multivariate RR for ≥600 g/d was 0.68 (95% CI = 0.54–0.87; P value, test for between-studies heterogeneity = 0.86; P value, test for trend = 0.001). Compared with <100 g/d, the pooled multivariate RRs (95% CIs) for ≥400 g/d were 0.79 (0.63–0.99; P value, test for trend = 0.03) for total fruit, and 0.72 (0.48–1.08; P value, test for trend = 0.07) for total vegetables. For specific carotenoids, the pooled multivariate RRs (95% CIs) comparing the highest and lowest quintiles were 0.87 (0.73–1.03) for α-carotene, 0.82 (0.69–0.98) for β-carotene, 0.86 (0.73–1.01) for β-cryptoxanthin, 0.82 (0.64–1.06) for lutein/zeaxanthin, and 1.13 (0.95–1.34) for lycopene. In conclusion, increasing fruit and vegetable consumption is associated with decreasing risk of renal cell cancer; carotenoids present in fruit and vegetables may partly contribute to this protection.
Fruit and vegetable intakes have long been studied for their potential roles in reducing cancer risk. An international review panel sponsored by the World Cancer Research Fund concluded that the evidence that consuming fruit and vegetables may reduce the risk of renal cell cancer was limited (1). Few epidemiologic studies have examined associations between renal cell cancer and nutrients abundant in fruit and vegetables such as dietary fiber (2), individual carotenoids (3–8), and flavonoids (8–10).
To evaluate further whether intakes of fruit and vegetables and specific carotenoids are associated with renal cell cancer risk, we examined these associations in a pooled analysis of 13 prospective studies. This pooled analysis included eight prospective studies that had not previously reported associations for renal cell cancer and five (8, 11–13) prospective studies that had previously examined the association between fruit and vegetable consumption and renal cell cancer risk.
METHODS
Study population
The Pooling Project of Prospective Studies of Diet and Cancer (referred to as the Pooling Project) has been described elsewhere (14). For the renal cell cancer analyses, the study inclusion criteria were as follows: at least one publication on a diet and cancer association, identification of at least 25 incident renal cell cancer cases, assessment of long-term dietary intake, and validation of the dietary assessment method or a closely related instrument (14). Studies including both men and women were treated as two separate cohorts (one of men and one of women) and the inclusion criteria were applied to each sex-specific cohort. When we analyzed β-carotene intake, we included only participants in the placebo group of the Alpha-Tocopherol, Beta-Carotene Cancer Prevention Study (15), and participants who did not receive β-carotene supplements in the Women’s Health Study (16). Each of the 13 studies included here was reviewed and approved by the institutional review board of the institution at which the study was conducted.
Case Ascertainment
Cases were ascertained by follow-up questionnaires and subsequent review of medical records (13, 16), linkage to cancer registries (8, 11, 12, 17–20) or both (15, 21, 22). Some studies also used linkage to mortality registries (8, 11, 13, 15–19, 21, 22). We defined renal cell cancer cases as those with histologically confirmed renal cell cancer (ICD-O-2 code = C64.9; ICD-9 = 189.0) using histological codes based on the International Classification of Diseases for Oncology (23), International Classification of Diseases (24) or the morphological classification provided by the study investigators.
Assessment of Dietary Intake
Each study assessed baseline dietary intake using a validated food-frequency questionnaire (FFQ) or diet history. Each study provided baseline fruit and vegetable intake data as either grams per day or the number of servings per day (intake was converted to grams per day based on the frequency reported and study-specific serving sizes). We examined the associations between total fruit (fruits and fruit juice), total vegetables (vegetables and vegetable juice), and total fruit and vegetables combined and renal cell cancer risk. We excluded mature beans and potatoes from the vegetable group because of their high protein content and high starch content, respectively (25). We also examined associations for botanically defined fruit and vegetable groups (26). Individual fruits and vegetables were examined if over half the studies assessed them as separate food items. Daily consumption of the major carotenoids and other nutrients was calculated by each study using food composition databases specific to its population. Intakes of each carotenoid and other nutrients were adjusted for total energy intake using the residual method (27).
Each study in this analysis conducted a validation study of their diet assessment method or a closely related instrument (14). However, the validity of fruit and vegetable consumption was assessed only in the Alpha-Tocopherol Beta-Carotene Cancer Prevention Study (correlation coefficients (r) = 0.69 for total fruits and 0.58 for total vegetables) (28), the Cancer Prevention Study II Nutrition Cohort (r = 0.62–0.75 for total fruits/fruit juice and 0.52–0.62 for total vegetables) (29), Health Professionals Follow-up Study (r = 0.71 for total fruits, and 0.19 for total vegetables)(30) and the Netherlands Cohort Study (r = 0.60 for total fruits, and 0.38 for total vegetables)(31). In the Nurses’ Health study (32), the average correlation coefficients comparing intakes estimated from the FFQ vs multiple 7-day diet records were 0.8 for intakes of individual fruits and 0.5 for intakes of individual vegetables. The validation results for carotene or β-carotene were reported in only a few of the validation studies (29, 33, 34).
Assessment of Nondietary Factors
Age, height, weight, and, among women, parity and age at first birth, were collected using self-administered questionnaires at baseline by all studies; body mass index (BMI, weight (kg) / height (m2)) was calculated from height and weight. Most studies assessed information on smoking habits (12 studies) and history of hypertension (9 studies). When we excluded data from the one study that did not collect information on smoking habits, the results were similar (data not shown).
Statistical Analysis
After applying the exclusion criteria that were specified by each study, we further excluded participants if they consumed an implausible energy intake (beyond 3 SDs from the study-specific loge-transformed mean energy intake) or had a history of cancer (excluding nonmelanoma skin cancer) at baseline. Each study was analyzed using the Cox proportional hazards model (35). Person-years of follow-up time were calculated from the date of the baseline questionnaire until the date of renal cell cancer diagnosis, death, loss to follow-up, if applicable, or end of follow-up, whichever came first. Age at baseline and the year the baseline questionnaire was returned were used as stratification variables, thereby creating a time metric that simultaneously accounted for age, calendar time and time since entry into the study.
In the multivariate analyses, we further adjusted for BMI (continuous), history of hypertension (yes/no), pack-years of smoking (continuous), total energy intake (continuous), alcohol intake (continuous), and, for women, parity and age at first birth (age at first birth < 25 and parity of 1 or 2; age at first birth ≥25 years and parity of 1 or 2, or nulliparous; age at first birth <25 years and parity of ≥3; and age at first birth ≥25 years and parity of ≥3). For each covariate, an indicator variable was used for missing responses, if needed, within each study.
For our primary analyses, we categorized fruit and vegetable intake using either study-specific quintiles or uniform absolute intake cutpoints across studies. To test for trend, participants were assigned the median value of their intake category and this variable was entered as a continuous term in the model, the coefficient for which was evaluated by the Wald test. We also conducted separate analyses in which we modeled intakes using continuous variables. After calculating study- and sex-specific RRs, we combined the loge RRs, weighted by the inverse of their variances, using a random effects model (36). We tested for heterogeneity between studies using the Q statistic (36). Two-sided 95% confidence intervals (CIs) were calculated.
To assess whether the association was linear, we examined non-parametric regression curves using restricted cubic splines (37, 38). To test for non-linearity, the model fit including the linear and cubic spline terms selected by a stepwise regression procedure was compared with the model fit with only the linear term using the likelihood ratio test, and by visual inspection. For these analyses, all studies were combined into a single data set (the aggregated dataset). To reduce the influence of extreme values, individuals reporting extremely high intakes (top 1% of participants in each study) were excluded from the spline analysis.
We examined whether associations varied by sex, median age at diagnosis (<68, ≥68 years), and smoking status (never, past, current smoker) using a mixed effects meta-regression model (14, 39). To evaluate whether BMI (<25, ≥25 kg/m2), history of hypertension (yes, no), alcohol intake (nondrinkers, drinkers), and multivitamin use (user, nonuser) modified the associations, we used a Wald test based on the pooled cross-product term as a continuous variable of the main exposure with the modifier variable modeled as a dichotomous variable.
All statistical tests were two-sided, and P values less than .05 were considered statistically significant.
RESULTS
During follow-up of 530,469 women and 244,483 men for periods of 7–20 years across studies, 1,478 incident cases of renal cell cancer (709 women and 769 men) were diagnosed (Table 1). Median intakes of total fruit and total vegetables (Table 1) and mean intakes of specific carotenoids varied more than 3-fold across studies (40)(carotenoids data not shown for the Melbourne Collaborative Cohort Study (41) and California Teachers Study (42)).
Table 1.
Baseline characteristics of the cohort studies included in the pooled analyses
| Study (sex*) | Country | Follow-up | Baseline cohort size† | Age range, years | No. of Cases | Total fruit, g/d | Total vegetables, g/d | ||
|---|---|---|---|---|---|---|---|---|---|
| No. of items | Median (10th–90th) | No. of items | Median (10th–90th) | ||||||
| Alpha-Tocopherol, Beta-Carotene Cancer Prevention Study (M) | Finland | 1985–1999 | 26,987 | 50–69 | 187 | 26 | 122 (28–299) | 38 | 94 (36–197) |
| Breast Cancer Detection Demonstration Project Follow-Up Study (W) | US | 1987–1999 | 42,007 | 40–93 | 49 | 5 | 173 (33–389) | 10 | 135 (51–288) |
| California Teachers Study (W) | US | 1995–2001 | 100,036 | 22–104 | 35 | 11 | 180 (52–380) | 16 | 150 (61–305) |
| Canadian National Breast Screening Study (W) | Canada | 1980–2000 | 49,613 | 40–59 | 81 | 6 | 314 (110–577) | 15 | 221 (101–438) |
| Cancer Prevention Study II Nutrition Cohort (W) | US | 1992–2001 | 74,138 | 50–74 | 86 | 7 | 195 (52–396) | 10 | 147 (61–302) |
| Cancer Prevention Study II Nutrition Cohort (M) | US | 1992–2001 | 66,166 | 50–74 | 220 | 7 | 182 (44–394) | 10 | 177 (76–351) |
| Health Professionals Follow-up Study (M) | US | 1986–2000 | 47,780 | 40–75 | 116 | 15 | 300 (97–621) | 28 | 233 (112–437) |
| Iowa Women’s Health Study (W) | US | 1986–2000 | 34,588 | 55–69 | 117 | 15 | 338 (130–625) | 31 | 195 (91–383) |
| Melbourne Collaborative Cohort Study (M) | Australia | 1990–2003 | 14,908 | 40–69 | 50 | 19 | 359 (103–830) | 24 | 196 (81–378) |
| Netherlands Cohort Study (W) | The Netherlands | 1986–1993 | 62,573 | 55–69 | 68 | 12 | 206 (82–388) | 25 | 164 (88–293) |
| Netherlands Cohort Study (M) | The Netherlands | 1986–1993 | 58,279 | 55–69 | 134 | 12 | 153 (45–331) | 25 | 156 (83–276) |
| New York State Cohort (M) | US | 1980–1987 | 30,363 | 15–107 | 62 | 8 | 258 (69–492) | 23 | 185 (75–340) |
| Nurses’ Health Study (W) | US | 1986–2000 | 68,523 | 40–65 | 86 | 21 | 329 (115–642) | 33 | 259 (129–470) |
| Swedish Mammography Cohort (W) | Sweden | 1987–2004 | 60,604 | 40–76 | 138 | 4 | 166 (46–374) | 5 | 77 (29–158) |
| Women’s Health Study (W) | US | 1993–2004 | 38,387 | 45–89 | 49 | 15 | 266 (86–539) | 25 | 236 (111–452) |
| Total | 774,952 | 1,478 | |||||||
W: women, M: men
Cohort sizes after applying study-specific exclusion criteria and then excluding participant with loge-transformed energy intake values beyond three standard deviations from the study-specific mean, with previous caner diagnoses (other than nonmelanoma skin cancer); the Canadian National Breast Screening Study and the Netherlands Cohort Study are analyzed as case-cohort studies so their baseline cohort size does not reflect the above exclusions.
We found a modest inverse association between total fruit and vegetable consumption and renal cell cancer risk when intake was categorized using either uniform absolute intake cutpoints (Table 2) or using study-specific quintiles (Table 3). The results based on the analyses that included fruit and vegetable juice were similar to those that excluded fruit and vegetable juice (data not shown). The associations did not vary between studies or by sex. Comparing total fruit and vegetable intake of ≥600 g/d with <200 g/d, the pooled age-adjusted RR was 0.71 (95% CI = 0.56–0.89; P value, test for trend = 0.001; Table 2). The pooled age- and energy- adjusted RR (0.67; 95% CI = 0.53–0.85; P value, test for trend < 0.001) and the pooled age-, energy-, and smoking- adjusted RR (0.71; 95% CI = 0.56–0.90; P value, test for trend = 0.003) were similar. The RRs did not change substantially after further adjustment for other renal cell cancer risk factors (Table 2). When we additionally adjusted for total fat and protein intake, the results did not appreciably change (data not shown). We conducted additional analyses to evaluate the impact of controlling for smoking habits using different parameterizations. The results (data not shown) were similar when we controlled for smoking habits using 1) smoking status only (never, past, current), and 2) smoking status, smoking duration among past smokers (<30 years, ≥30 years), and smoking dose among current smokers (<15 cigarettes/d, 15-<25 cigarettes/d, ≥25 cigarettes/d) to replace the categorization we used for the main multivariate models.
Table 2.
Pooled relative risks (RR) and 95% confidence intervals (95% CI) of renal cell cancer associated with categories of intakes of fruit and vegetables
| Intake (g/d) | P values, test for trend | P values, test for between-studies heterogeneity* | P values, test for between- studies heterogeneity due to sex* | ||||||
|---|---|---|---|---|---|---|---|---|---|
| Total fruit and vegetables | <200 | 200–<300 | 300–<400 | 400–<500 | 500–<600 | ≥ 600 | |||
| No. of cases (W, M) | (124, 162) | (114, 141) | (112, 157) | (101, 112) | (80, 82) | (178, 115) | |||
| Age-adjusted | 1.00 | 0.82 (0.69–0.98) | 0.88 (0.73–1.05) | 0.78 (0.63–0.96) | 0.83 (0.65–1.05) | 0.71 (0.56–0.89) | 0.001 | .85 | .90 |
| Multivariate † | 1.00 | 0.83 (0.70–1.00) | 0.90 (0.74–1.09) | 0.79 (0.64–0.98) | 0.83 (0.65–1.06) | 0.68 (0.54–0.87) | 0.001 | .86 | .97 |
| Total fruit | <100 | 100–<200 | 200–<300 | 300–<400 | ≥ 400 | ||||
| No. of cases (W, M) | (130, 208) | (173, 223) | (155, 150) | (109, 90) | (142, 98) | ||||
| Age-adjusted | 1.00 | 0.88 (0.76–1.02) | 0.84 (0.71–0.99) | 0.82 (0.67–1.01) | 0.80 (0.64–0.99) | .02 | .96 | .87 | |
| Multivariate † | 1.00 | 0.90 (0.77–1.04) | 0.87 (0.73–1.03) | 0.83 (0.68–1.02) | 0.79 (0.63–0.99) | .03 | .95 | .78 | |
| Total vegetables | <100 | 100–<200 | 200–<300 | 300–<400‡ | ≥ 400‡,§ | ||||
| No. of cases (W, M) | (189, 203) | (256, 305) | (143, 171) | (73, 55) | (46, 35) | ||||
| Age-adjusted | 1.00 | 0.91 (0.77–1.07) | 0.81 (0.68–0.97) | 0.79 (0.61–1.04) | 0.78 (0.53–1.15) | .15 | .12 | .75 | |
| Multivariate † | 1.00 | 0.93 (0.78–1.10) | 0.82 (0.68–0.98) | 0.76 (0.57–1.02) | 0.72 (0.48–1.08) | .07 | .12 | .58 | |
For the highest category.
Multivariable models were adjusted for history of hypertension (yes/no), body mass index (continuous), pack-years of smoking (continuous), combination of parity and age at first birth (age at first birth < 25 and parity of 1 or 2; age at first birth ≥ 25 years and parity of 1 or 2, or nulliparous; age at first birth <25 years and parity of ≥ 3; and age at first birth ≥ 25 years and parity of ≥ 3), alcohol intake (continuous), and total energy intake (continuous). Age and year of questionnaire return were adjusted as stratification variables.
The Netherlands Cohort Study-women did not include any cases with ≥300g/d of total vegetable intake. The participants in this category in these studies were included in the next highest category.
The Alpha-Tocopherol, Beta-Carotene Cancer Prevention Study, and the Swedish Mammography Cohort did not include any cases with ≥ 400g/d of total vegetable intake. The participants in the highest categories in these studies were included in the next highest category.
Table 3.
Pooled relative risks (RR) and 95% confidence intervals (95% CI) of renal cell cancer associated with quintiles of intakes of fruits and vegetables
| Quintile 1 | Quintile 2 | Quintile 3 | Quintile 4 | Quintile 5 | P values, test for trend | P values, test for between-studies heterogeneity* | P values, test for between-studies heterogeneity due to sex* | |
|---|---|---|---|---|---|---|---|---|
| Total fruits and vegetables | ||||||||
| Age-adjusted | 1.00 | 0.92 (0.75–1.11) | 0.92 (0.76–1.10) | 0.84 (0.70–1.00) | 0.78 (0.66–0.92) | .005 | .66 | .62 |
| Multivariate† | 1.00 | 0.92 (0.76–1.13) | 0.93 (0.77–1.11) | 0.84 (0.69–1.02) | 0.76 (0.64–0.91) | .002 | .65 | .38 |
| Total fruits | ||||||||
| Age-adjusted | 1.00 | 0.92 (0.79–1.08) | 0.94 (0.80–1.10) | 0.85 (0.72–1.00) | 0.79 (0.67–0.93) | .01 | .91 | .93 |
| Multivariate† | 1.00 | 0.94 (0.80–1.10) | 0.96 (0.82–1.13) | 0.87 (0.73–1.02) | 0.80 (0.67–0.95) | .01 | .86 | .90 |
| Total vegetables | ||||||||
| Age-adjusted | 1.00 | 0.91 (0.76–1.09) | 0.89 (0.73–1.08) | 0.92 (0.79–1.09) | 0.88 (0.71–1.09) | .24 | .08 | .40 |
| Multivariate† | 1.00 | 0.93 (0.77–1.12) | 0.90 (0.74–1.10) | 0.94 (0.80–1.11) | 0.87 (0.69–1.08) | .13 | .09 | .53 |
For the highest category.
Multivariable models were adjusted for history of hypertension (yes/no), body mass index (continuous), pack-years of smoking (continuous), combination of parity and age at first birth (age at first birth < 25 and parity of 1 or 2; age at first birth ≥ 25 years and parity of 1 or 2, or nulliparous; age at first birth <25 years and parity of ≥ 3; and age at first birth ≥ 25 years and parity of ≥ 3), alcohol intake (continuous), and total energy intake (continuous). Age and year of questionnaire return were adjusted as stratification variables.
Total fruit intake and total vegetable intake were each associated with a 21–28% lower risk of renal cell cancer comparing intakes of ≥400 g/d with <100 g/d (Table 2). The pooled multivariate RRs (95% CIs) were 0.81 (0.64–1.02) for total fruit intake of ≥400 g/d with <100 g/d when we additionally adjusted for total vegetable intake (continuous), and 0.75 (0.49–1.14) for total vegetable intake of ≥400 g/d with <100 g/d when we additionally adjusted for total fruit intake (continuous). We still found an inverse association for total fruit and vegetable consumption when we categorized participants into quintiles; the pooled multivariate RR (95% CI) was 0.76 (0.64–0.91; P value, test for trend = 0.002) comparing the highest and lowest quintiles. The result for total fruit intake in the quintile analyses was similar to that observed in the absolute cutpoint analyses (Table 3). Although we observed a weaker association for total vegetables in the quintile analyses compared with that from the absolute cutpoint analyses, the results for total vegetables in the absolute cutpoints analyses were similar to those reported using a wider contrast in total vegetable intake by comparing the highest and lowest deciles (pooled multivariate RR = 0.72; 95% CI = 0.54–0.95).
To avoid a potential influence of preclinical symptoms on diet, we conducted analyses in which cases diagnosed during the first 4 years of follow-up were excluded (444 cases were excluded). The results (data not shown) were similar to those observed when all cases were included.
The non-parametric regression curves and formal tests of non-linearity showed that the relations between intakes of total fruit and vegetables, total fruit, and total vegetables and renal cell cancer risk were consistent with linear associations (P values, test for curvature > 0.05 for each group). When intake was modeled as a continuous variable and after excluding participants reporting extremely high intakes (top 1% of participants in each study), the pooled multivariate RRs (95% CIs) for an increment of intake (1 SD) were 0.88 (0.82–0.95; Figure 1) for a 280 g/d increment of total fruit and vegetables, 0.89 (0.82–0.95) for a 200 g/d increment of total fruit, and 0.95 (0.87–1.03) for a 130 g/d increment of total vegetables.
Figure 1.
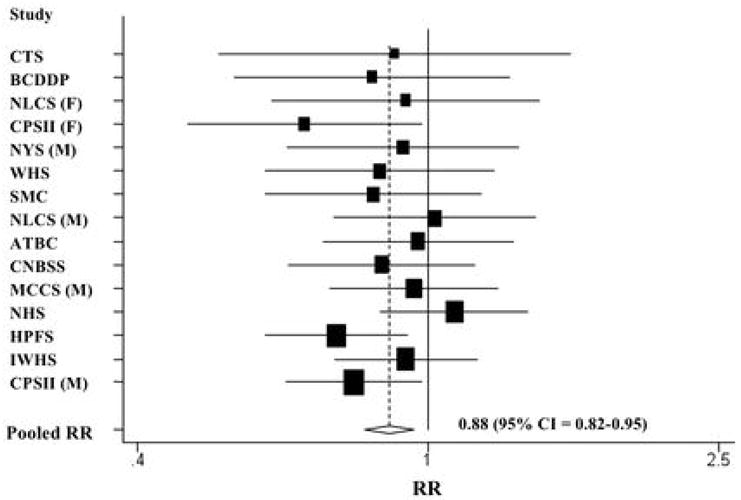
Study-specific and pooled multivariate RRs and 95% CIs of renal cell cancer for a 280 g/d increment of total fruit and vegetable intake. The RRs were adjusted for the same covariates listed in Table 2. The black squares indicate the study-specific relative risks; the horizontal lines represent the 95% CIs. The area of the black squares reflects the study-specific weights (inverse of the variance). The dashed line represents the pooled RR and the diamond represents the 95% CI for the pooled RR. CTS = California Teachers Study; BCDDP = Breast Cancer Detection Demonstration Project Follow-Up Study; NLCS = Netherlands Cohort Study; CPS II = Cancer Prevention Study II Nutrition Cohort; NYS = New York State Cohort; WHS = Women’s Health Study; SMC = Swedish Mammography Cohort; ATBC = Alpha-Tocopherol, Beta-Carotene Cancer Prevention Study; CNBSS = Canadian National Breast Screening Study; MCCS = Melbourne Collaborative Cohort Study; NHS = Nurses’ Health Study; HPFS = Health Professionals Follow-up Study; IWHS = Iowa Women’s Health Study; M = men; W = women.
We examined fruit and vegetable groups based on botanical taxonomy (26). The pooled multivariate RRs (95% CIs; per 1 SD) for an increment of intake were 0.94 (0.89–1.00; 30 g/d) for Compositae (e.g. lettuce, endive), 0.97 (0.91–1.03; 30 g/d) for Cruciferae (e.g. broccoli, cabbage), 1.03 (0.98–1.09; 40 g/d) for Cucurbitaceae (e.g. melons, squash), 1.01 (0.94–1.09; 30 g/d) for Leguminosae (e.g. beans, peas), 0.98 (0.93–1.04; 80 g/d) for Rosaceae (e.g. apples, peaches), 0.97 (0.92–1.03; 120 g/d) for Rutaceae (e.g. grapefruits, oranges), 1.01 (0.92–1.11; 90 g/d) for Solanacea (e.g. potatoes, tomatoes), and 0.95 (0.90–1.01; 20 g/d) for Umbelliferae (e.g. carrots, celery). Because of a previous report of an inverse association (43), we also examined the association for root vegetable intake (carrots and beets). The pooled multivariate RR in our study was 0.94 (0.89–0.99) for a 20 g/d increment in root vegetable intake.
We further examined associations with 7 specific fruits and 11 specific vegetables. We found statistically significant inverse associations for broccoli and carrots (Table 4). The pooled multivariate RRs (95% CIs; per ½ cup) were 0.60 (0.41–0.89) for a 78 g/d increment of broccoli and 0.82 (0.68–0.99) for a 57 g/d increment of carrots.
Table 4.
Pooled multivariable relative risks (RR) and 95% confidence intervals (95% CI) of renal cell cancer associated with intakes of individual fruits and vegetables*
| Food item (servings) | No. of Studies | No. of Cases | Reference | One serving (g/d) | RR (95% CI) for an increment of 1 serving/d | P values, test for between- studies heterogeneity† | P values, test for between-studies heterogeneity due to sex† | ||
|---|---|---|---|---|---|---|---|---|---|
| Women | Men | Both | |||||||
| Fruits | |||||||||
| Apples, pears, applesauce | 13 | 1467 | 1 or ½ cup | 138 | 0.88 (0.74–1.05) | 0.98 (0.83–1.16) | 0.93 (0.83–1.05) | .93 | .39 |
| Bananas ‡§ | 11 | 1102 | 1 | 114 | 0.84 (0.65–1.08) | 0.89 (0.66–1.20) | 0.87 (0.72–1.04) | .64 | .70 |
| Cantaloupe ||‡§**†† | 8 | 796 | ¼ melon | 134 | 1.41 (0.82–2.43) | 0.98 (0.35–2.77) | 1.31 (0.81–2.11) | .81 | .54 |
| Grapefruit ||‡†† | 10 | 1062 | ½ fruit | 120 | 0.96 (0.77–1.18) | 0.74 (0.54–1.02) | 0.88 (0.74–1.05) | .82 | .20 |
| Oranges ||‡†† | 10 | 1058 | 1 | 131 | 0.99 (0.75–1.30) | 0.85 (0.68–1.07) | 0.91 (0.76–1.08) | .92 | .41 |
| Peaches, apricots, plums‡§ ||#†† | 8 | 587 | 1 or ½ cup | 87 | 1.18 (0.93–1.50) | 0.79 (0.52–1.19) | 1.07 (0.87–1.31) | .53 | .10 |
| Strawberries‡§¶**†† | 8 | 830 | ½ cup | 75 | 1.13 (0.68–1.88) | 0.91 (0.51–1.61) | 1.03 (0.70–1.50) | .64 | .57 |
| Vegetables | |||||||||
| Broccoli #†† | 11 | 1136 | ½ cup | 78 | 0.70 (0.42–1.16) | 0.37 (0.19–0.74) | 0.60 (0.41–0.89) | .27 | .08 |
| Brussels sprouts‡§††‡‡§§ | 8 | 895 | ½ cup | 78 | 0.75 (0.29–1.95) | 0.94 (0.16–5.62) | 0.97 (0.46–2.03) | .66 | .40 |
| Cabbage¶¶§§ | 11 | 1324 | ½ cup | 68 | 1.02 (0.66–1.58) | 1.35 (0.92–1.97) | 1.20 (0.90–1.60) | .90 | .35 |
| Carrots | 13 | 1468 | ½ cup | 57 | 0.87 (0.69–1.11) | 0.70 (0.47–1.03) | 0.82 (0.68–0.99) | .47 | .41 |
| Cauliflower‡§¶††‡‡ | 8 | 863 | ½ cup | 62 | 0.68 (0.31–1.48) | 0.98 (0.47–2.03) | 0.87 (0.51–1.46) | .21 | .32 |
| Lettuce, salad | 13 | 1469 | 1 cup | 56 | 0.85 (0.72–1.01) | 0.92 (0.78–1.09) | 0.89 (0.79–1.00) | .85 | .51 |
| Peas, lima beans‡§#††§§ | 8 | 730 | ½ cup | 80 | 1.56 (0.66–3.69) | 0.49 (0.20–1.18) | 1.04 (0.52–2.09) | .05 | .04 |
| String beans‡§**††§§ | 8 | 870 | ½ cup | 68 | 1.30 (0.89–1.88) | 0.45 (0.04–4.66) | 1.19 (0.73–1.92) | .07 | .87 |
| Spinach§§ | 12 | 1409 | ½ cup | 73 | 0.78 (0.51–1.20) | 0.82 (0.29–2.31) | 0.84 (0.57–1.23) | .39 | .60 |
| Tomatoes | 13 | 1467 | 1 | 122 | 1.18 (0.96–1.46) | 1.06 (0.70–1.60) | 1.12 (0.92–1.37) | .27 | .48 |
| Yams ||‡§**††§§ | 7 | 752 | ½ cup | 128 | 0.51 (0.11–2.40) | 0.71 (0.16–3.16) | 0.60 (0.21–1.78) | .72 | .75 |
| Mature beans and lentils|| | 12 | 1286 | ½ cup | 131 | 0.93 (0.45–1.93) | 0.88 (0.49–1.57) | 0.93 (0.59–1.47) | .16 | .55 |
| Potatoes | 13 | 1477 | 1 | 202 | 1.13 (0.83–1.53) | 0.83 (0.53–1.29) | 0.98 (0.75–1.27) | .03 | .20 |
Individual fruits and vegetables were not presented if more than 7 studies did not assess them. One serving size is based on Pennington et al.27 Because apples, pears, and applesauce; oranges and tangerines; lettuce and salad; peas and lima beans; mature beans and lentils were asked on a single line on the FFQ in some studies, these foods were analyzed together.
Multivariable models were adjusted for history of hypertension (yes/no), body mass index (continuous), pack-years of smoking (continuous), combination of parity and age at first birth (age at first birth < 25 and parity of 1 or 2; age at first birth ≥ 25 years and parity of 1 or 2, or nulliparous; age at first birth <25 years and parity of ≥ 3; and age at first birth ≥ 25 years and parity of ≥ 3), alcohol intake (continuous), and total energy intake (continuous). Age and year of questionnaire return were adjusted as stratification variables.
For the highest category.
The Breast Cancer Detection Demonstration Project was excluded
The Cancer Prevention Study II Nutrition Cohort was excluded.
The Alpha-Tocopherol, Beta-Carotene Cancer Prevention Study was excluded.
The Canadian National Breast Screening Study was excluded. For cabbage and cauliflower, one question on consumption of cabbage and cauliflower was asked.
The Netherlands Cohort Study was excluded
The New York State Cohort Study was excluded.
The Swedish Mammography Cohort was excluded
The California Teachers Study was excluded because one question on consumption of cauliflower and brussels sprouts was asked.
The Melbourne Collaborative Cohort Study was excluded. For cabbage and brussels sprouts, one question on consumption of cabbage and brussels sprouts was asked. For string beans and peas, one question on consumption of green beans and peas was asked.
The associations between intakes of total fruit and vegetables, total fruit, and total vegetables and renal cell cancer risk were not modified by BMI, smoking habits, and history of hypertension (Table 5). Age at diagnosis, alcohol intake, or multivitamin use did not modify the associations (P values, test for interaction > 0.2; data not shown).
Table 5.
Pooled multivariate relative risks* (RR) and 95% confidence intervals (95% CI) of renal cell cancel for intakes of fruits and vegetables by other factors
| Variable (No. of cases) | Total Fruits and vegetables (per 280 g/d) | P values, test for interaction | Total Fruits (per 200g/d) | P values, test for interaction | Total Vegetables (per 130g/d) | P values, test for interaction |
|---|---|---|---|---|---|---|
| Body mass index (kg/m2) | ||||||
| < 25 (n=548) | 0.87 (0.77–0.98) | 0.60 | 0.88 (0.78–0.99) | 0.55 | 0.94 (0.84–1.05) | 0.95 |
| ≥25 (n=898) | 0.91 (0.83–1.00) | 0.93 (0.85–1.01) | 0.95 (0.87–1.03) | |||
| Smoking habit | ||||||
| Never smokers †,‡ (n=447) | 0.86 (0.75–0.98) | 0.69 | 0.83 (0.74–0.94) | 0.14 | 0.91 (0.81–1.02) | 0.34 |
| Past smokers †,‡ (n=458) | 0.91 (0.78–1.05) | 0.95 (0.84–1.08) | 0.92 (0.81–1.04) | |||
| Current smokers ‡ (n=392) | 0.93 (0.78–1.10) | 0.94 (0.80–1.11) | 1.06 (0.84–1.34) | |||
| History of hypertension § | ||||||
| No (n=696) | 0.87 (0.77–0.98) | 0.23 | 0.90 (0.81–1.00) | 0.45 | 0.90 (0.79–1.03) | 0.13 |
| Yes (n=434) | 0.92 (0.81–1.05) | 0.93 (0.82–1.05) | 0.98 (0.87–1.09) | |||
Multivariable models were adjusted for history of hypertension (yes/no), body mass index (continuous), pack-years of smoking (continuous), combination of parity and age at first birth (age at first birth < 25 and parity of 1 or 2; age at first birth ≥ 25 years and parity of 1 or 2, or nulliparous; age at first birth <25 years and parity of ≥ 3; and age at first birth ≥ 25 years and parity of ≥ 3), alcohol intake (continuous), and total energy intake (continuous). Age and year of questionnaire return were adjusted as stratification variables.
The Alpha-Tocopherol, Beta-Carotene Cancer Prevention Study was excluded because participants were current smokers
The Swedish Mammography Cohort was excluded because smoking status was not assessed.
The Breast Cancer Detection Demonstration Project, the Canadian National Breast Screening Study, the New York State Cohort Study, and the Swedish Mammography Cohort were excluded because history of hypertension was not assessed.
For the specific carotenoids evaluated, we observed a 18% lower risk of renal cell cancer comparing the highest and lowest quintiles of β-carotene intake (Table 6). Similar, but non-significant inverse associations were observed for α-carotene, β-cryptoxanthin, and lutein/zeaxanthin. The pooled multivariate RRs (95% CIs) comparing the highest and lowest quintiles were 0.87 (0.73–1.03) for α-carotene, 0.86 (0.73–1.01) for β-cryptoxanthin, and 0.82 (0.64–1.06) for lutein/zeaxanthin. No association was observed for lycopene intake (pooled multivariate RR=1.13; 95% CI = 0.95–1.34 comparing the highest and lowest quintiles). Non-parametric regression curves and formal tests of nonlinearity showed that the relations between intakes of each carotenoid and renal cell cancer risk were consistent with linear associations (P values, test for curvature > 0.05). When intake was modeled as a continuous variable, the pooled multivariate RRs (95% CIs; per 1 SD) for an increment of intake were 0.93 (0.88–0.99; 660 μg/d) for α-carotene, 0.91 (0.85–0.97; 2,700 μg/d) for β-carotene, 0.99 (0.96–1.02; 100 μg/d) for β-cryptoxanthin, 0.91 (0.85–0.97; 2,700 μg/d) for lutein/zeaxanthin, and 1.03 (0.98–1.09; 5,400 μg/d) for lycopene.
Table 6.
Pooled relative risks (RR) and 95% confidence intervals (95% CI) of renal cell cancer for carotenoid intakes
| Quintile 1 | Quintile 2 | Quintile 3 | Quintile 4 | Quintile 5 | P values, test for trend | P values, test for between-studies heterogeneity* | P values, test for between-studies heterogeneity due to sex* | |
|---|---|---|---|---|---|---|---|---|
| α-carotene | ||||||||
| Age-adjusted | 1.00 | 0.93 (0.79–1.09) | 0.92 (0.78–1.08) | 0.89 (0.75–1.04) | 0.86 (0.73–1.01) | .24 | .45 | .77 |
| Multivariate† | 1.00 | 0.92 (0.78–1.09) | 0.93 (0.79–1.09) | 0.89 (0.75–1.05) | 0.87 (0.73–1.03) | .30 | .44 | .79 |
| β-carotene‡ | ||||||||
| Age-adjusted | 1.00 | 0.91 (0.76–1.08) | 0.94 (0.80–1.12) | 0.83 (0.70–0.99) | 0.82 (0.69–0.98) | .01 | .72 | .95 |
| Multivariate† | 1.00 | 0.92 (0.77–1.09) | 0.96 (0.81–1.14) | 0.84 (0.70–1.00) | 0.82 (0.69–0.98) | .01 | .73 | .79 |
| β-cryptoxanthin | ||||||||
| Age-adjusted | 1.00 | 1.00 (0.86–1.18) | 0.90 (0.77–1.06) | 0.91 (0.77–1.07) | 0.85 (0.72–1.00) | .19 | .98 | .84 |
| Multivariate† | 1.00 | 1.02 (0.87–1.20) | 0.94 (0.79–1.10) | 0.93 (0.79–1.09) | 0.86 (0.73–1.01) | .18 | .97 | .63 |
| Lutein/zeaxanthin | ||||||||
| Age-adjusted | 1.00 | 0.94 (0.75–1.18) | 1.03 (0.87–1.21) | 1.06 (0.89–1.26) | 0.81 (0.63–1.05) | .04 | .01 | .40 |
| Multivariate† | 1.00 | 0.96 (0.76–1.21) | 1.06 (0.89–1.25) | 1.09 (0.92–1.30) | 0.82 (0.64–1.06) | .04 | .02 | .50 |
| Lycopene§ | ||||||||
| Age-adjusted | 1.00 | 0.96 (0.82–1.14) | 0.97 (0.79–1.19) | 1.01 (0.86–1.20) | 1.12 (0.95–1.32) | .39 | .49 | .57 |
| Multivariate† | 1.00 | 0.98 (0.83–1.16) | 0.99 (0.80–1.23) | 1.03 (0.88–1.22) | 1.13 (0.95–1.34) | .40 | .37 | .56 |
For the highest category.
Multivariable models were adjusted for history of hypertension (yes/no), body mass index (continuous), pack-years of smoking (continuous), combination of parity and age at first birth (age at first birth < 25 and parity of 1 or 2; age at first birth ≥ 25 years and parity of 1 or 2, or nulliparous; age at first birth <25 years and parity of ≥ 3; and age at first birth ≥ 25 years and parity of ≥ 3), alcohol intake (continuous), and total energy intake (continuous). Age and year of questionnaire return were adjusted as stratification variables.
We included only participants in the placebo group of the Alpha-Tocopherol, Beta-Carotene Cancer Prevention Study, and participants who did not receive β-carotene supplements in the Women’s Health Study.
In additional analysis, we included only studies that had assessed the consumption of tomato sauce, the primary source of bioavailable lycopene (n = 758 cases in the Breast Cancer Detection Demonstration Project, the California Teachers Study, the Cancer Prevention Study II Nutrition Cohort, Health Professionals Follow-up Study, Iowa Women’s Health Study, Nurses’ Health Study, and Women’s Health Study). We found a RR of 0.96 for the highest quintile vs. lowest quintile (95% CI = 0.77–1.21; P value, test for trend = 0.44).
The associations for each carotenoid were not modified by BMI, history of hypertension, age at diagnosis, alcohol intake, or multivitamin use (P values, test for interaction > 0.08; data not shown). The association for α-carotene was modified by smoking habits; the pooled multivariate RRs (95% CIs) for a 660 μg/d increment of α-carotene were 0.89 (0.79–1.00) for never smokers, 0.94 (0.81–1.10) for past smokers, and 1.06 (0.94–1.21) for current smokers (P value, test for interaction = 0.02). Smoking habits did not modify the associations for the other carotenoids evaluated (P values, test for interaction > 0.05; data not shown).
DISCUSSION
In our pooled analysis of 1,478 renal cell cancer cases from 13 prospective studies, we found that fruit and vegetable consumption was inversely associated with renal cell cancer risk. There was no statistically significant heterogeneity between studies or by sex in the associations for intakes of total fruit, total vegetables, or total fruit and vegetables. Among specific fruit and vegetable groups and individual fruits and vegetables, statistically significant inverse associations were observed only for intakes of root vegetables, broccoli, and carrots (the primary contributor to intake of root vegetables). The inverse association for root vegetable intake observed in a previous prospective study (43), suggests that the inverse association for carrots in our study may not be a chance finding. Intakes of α-carotene, β-carotene, and lutein/zeaxanthin were each associated with a lower risk of renal cell cancer. Intakes of β-cryptoxanthin and lycopene were not significantly associated with renal cell cancer risk.
Although the results for fruits and vegetables from case-control studies of renal cell cancer have been inconsistent (3–5, 44–50), the largest case-control studies (each included more than 500 renal cell cancer cases) have shown more consistent inverse associations for total fruit (5), total vegetables (5, 49, 50), and subgroups of vegetables (3, 4, 50). Two prospective studies (43, 51) (the Adventist Health Study and the European Prospective Investigation into Cancer and Nutrition, EPIC) were not included in our analysis, because the former did not meet our inclusion criteria of having at least 25 cases of renal cell cancer and the latter is ongoing concurrently with ours. In the EPIC study of 306 renal cell cancer cases identified during an average of 6.2 years of follow-up, the multivariate RRs (95% CIs) were 1.02 (0.93–1.11) for an 80 g/d increment of total fruit and vegetables, 1.03 (0.97–1.08) for a 40 g/d increment of total fruit, and 0.97 (0.85–1.11) for a 40 g/d increment of total vegetables (43). For comparison, using the same increments as the EPIC study, our pooled multivariate RRs (95 % CIs) were 0.97 (0.94–0.99) for total fruit and vegetables, 0.98 (0.96–0.99) for total fruit, and 0.98 (0.96–1.01) for total vegetables. Differences in the types of fruit commonly consumed by the study populations, measurement error structure in intake, the length of follow-up and/or the number of cases in these studies may have contributed to the different findings observed by the 2 studies for total fruit intake and total fruit and vegetable intake.
Several components of fruit and vegetables may play a role in the prevention of renal cell cancer. Carotenoids including α-carotene, β-carotene, and lutein/zeaxanthin are one group of compounds that could contribute to the inverse association observed for fruit and vegetable intake. Carotenoids inhibit oxidative damage to DNA, mutagenesis, tumor growth, malignant transformation, and enhance cell-cell communication, thereby protecting cells against cancer (52). Evidence for specific carotenoids and renal cell cancer risk is limited. Of the few case-control studies that have reported associations for β-carotene, all have found non-significant inverse associations (4–7). However, studies based on the earlier food composition data measured multiple carotenoids in β-carotene equivalents (53), rather than β-carotene itself. Statistically significant inverse associations were observed for α-carotene, β-cryptoxanthin and lutein by a US case-control study (3), but not by an Italian case-control study (7). No association was observed for lycopene by these two studies (3, 7).
This pooled analysis has limitations. As we used only baseline measures of food intake and other risk factors for renal cell cancer, we could not investigate the effects of changes in fruit, vegetable, and carotenoid consumption, or in other variables during follow-up, or consumption during earlier age periods or over the lifetime. Because the FFQs were designed in their study-specific populations, there were differences in the dietary assessment method across studies. To minimize the influence of these differences, we modeled fruit and vegetable intake using study-specific quantiles. However, this approach does not take into account true differences in intakes across studies. Therefore, we also performed analyses in which we categorized fruit and vegetable intake using uniform absolute intake cutpoints. Regardless of the approach used, the results were similar. Because most of studies did not assess intakes of fruit and vegetables in their validation studies, we were not able to correct the RRs for measurement error.
The inverse association that we observed is not likely to be fully explained by residual or unmeasured confounding. Unmeasured but known risk factors for renal cell cancer include family history of renal cell cancer and medications such as phenacetin. In order for these variables to lead to strong confounding, they would need to be both common and strongly associated with fruit and vegetable consumption. However, the prevalence of these factors has been reported to be low in populations (54–56) similar to those included in our study. Also, we found no appreciable change in the associations after adjusting for various measured risk factors and a slightly stronger inverse association among never smokers and participants who did not have a history of hypertension. These suggest that residual confounding by risk factors such as smoking and hypertension does not explain the inverse association observed here.
Our analysis has several strengths. Because of the prospective design of the studies and high rates of follow-up (14), recall and selection bias do not account for our findings. In addition, this is the largest prospective study of fruit and vegetable consumption and renal cell cancer to date. The large number of cases in our study allowed us to examine the wide range of fruit and vegetable consumption. Because we analyzed the primary data from each study, we were able to model the main exposures and confounding factors uniformly across studies to remove potential sources of heterogeneity.
In conclusion, our results provide evidence that the intakes of fruit and vegetables are associated with a reduction in renal cell cancer risk. Multiple bioactive compounds, including carotenoids, may contribute to this inverse association.
Acknowledgments
The Pooling Project is supported by the National Cancer Institute grants CA55075. The content is solely the responsibility of the authors and does not necessarily represent the official views of the National Cancer Institute or the National Institutes of Health. The authors thank Walter C. Willett, MD, at Harvard School of Public Health for critical revision of the manuscript for important intellectual content, and Ruifeng Li, MS, and Shiaw-Shyuan Yaun, MS, at Harvard School of Public Health for assistance in data management.
References
- 1.World Cancer Research Fund, and American Institute for Cancer Research. Food, Nutrition, Physical Activity, and the Prevention of Cancer: a Global Perspective. Washington, DC: American Institute for Cancer Research; 2007. [Google Scholar]
- 2.Lindblad P, Wolk A, Bergstrom R, Adami HO. Diet and risk of renal cell cancer: a population-based case-control study. Cancer Epidemiol Biomarkers Prev. 1997;6:215–23. [PubMed] [Google Scholar]
- 3.Yuan JM, Gago-Dominguez M, Castelao JE, Hankin JH, Ross RK, Yu MC. Cruciferous vegetables in relation to renal cell carcinoma. Int J Cancer. 1998;77:211–6. doi: 10.1002/(sici)1097-0215(19980717)77:2<211::aid-ijc7>3.0.co;2-t. [DOI] [PubMed] [Google Scholar]
- 4.Hu J, Mao Y, White K. Diet and vitamin or mineral supplements and risk of renal cell carcinoma in Canada. Cancer Causes Control. 2003;14:705–14. doi: 10.1023/a:1026310323882. [DOI] [PubMed] [Google Scholar]
- 5.Wolk A, Gridley G, Niwa S, et al. International renal cell cancer study. VII. Role of diet. Int J Cancer. 1996;65:67–73. doi: 10.1002/(SICI)1097-0215(19960103)65:1<67::AID-IJC12>3.0.CO;2-F. [DOI] [PubMed] [Google Scholar]
- 6.Maclure M, Willett W. A case-control study of diet and risk of renal adenocarcinoma. Epidemiol. 1990;1:430–40. doi: 10.1097/00001648-199011000-00004. [DOI] [PubMed] [Google Scholar]
- 7.Bosetti C, Scotti L, Maso LD, et al. Micronutrients and the risk of renal cell cancer: A case-control study from Italy. Int J Cancer. 2007;120:892–6. doi: 10.1002/ijc.22374. [DOI] [PubMed] [Google Scholar]
- 8.Nicodemus KK, Sweeney C, Folsom AR. Evaluation of dietary, medical and lifestyle risk factors for incident kidney cancer in postmenopausal women. Int J Cancer. 2004;108:115–21. doi: 10.1002/ijc.11532. [DOI] [PubMed] [Google Scholar]
- 9.Bosetti C, Rossi M, McLaughlin JK, et al. Flavonoids and the risk of renal cell carcinoma. Cancer Epidemiol Biomarkers Prev. 2007;16:98–101. doi: 10.1158/1055-9965.EPI-06-0769. [DOI] [PubMed] [Google Scholar]
- 10.Hirvonen T, Virtamo J, Korhonen P, Albanes D, Pietinen P. Flavonol and flavone intake and the risk of cancer in male smokers (Finland) Cancer Causes Control. 2001;12:789–96. doi: 10.1023/a:1012232008016. [DOI] [PubMed] [Google Scholar]
- 11.Rashidkhani B, Lindblad P, Wolk A. Fruits, vegetables and risk of renal cell carcinoma: A prospective study of Swedish women. Int J Cancer. 2005;113:451–5. doi: 10.1002/ijc.20577. [DOI] [PubMed] [Google Scholar]
- 12.van Dijk BA, Schouten LJ, Kiemeney LA, Goldbohm RA, van den Brandt PA. Vegetable and fruit consumption and risk of renal cell carcinoma: results from the Netherlands cohort study. Int J Cancer. 2005;117:648–54. doi: 10.1002/ijc.21203. [DOI] [PubMed] [Google Scholar]
- 13.Lee JE, Giovannucci E, Smith-Warner SA, Spiegelman D, Willett WC, Curhan GC. Intakes of Fruits, Vegetables, Vitamins A, C, and E, and Carotenoids and Risk of Renal Cell Cancer. Cancer Epidemiol Biomarkers Prev. 2006;15:2445–52. doi: 10.1158/1055-9965.EPI-06-0553. [DOI] [PubMed] [Google Scholar]
- 14.Smith-Warner SA, Spiegelman D, Ritz J, et al. Methods for Pooling Results of Epidemiologic Studies. Am J Epidemiol. 2006;163:1053–64. doi: 10.1093/aje/kwj127. [DOI] [PubMed] [Google Scholar]
- 15.Mahabir S, Leitzmann MF, Virtanen MJ, et al. Prospective study of alcohol drinking and renal cell cancer risk in a cohort of finnish male smokers. Cancer Epidemiol Biomarkers Prev. 2005;14:170–5. [PubMed] [Google Scholar]
- 16.Lin J, Zhang SM, Cook NR, et al. Dietary intakes of fruit, vegetables, and fiber, and risk of colorectal cancer in a prospective cohort of women (United States) Cancer Causes Control. 2005;16:225–33. doi: 10.1007/s10552-004-4025-1. [DOI] [PubMed] [Google Scholar]
- 17.Bernstein L, Allen M, Anton-Culver H, et al. High breast cancer incidence rates among California teachers: results from the California Teachers Study (United States) Cancer Causes Control. 2002;13:625–35. doi: 10.1023/a:1019552126105. [DOI] [PubMed] [Google Scholar]
- 18.Bandera EV, Freudenheim JL, Marshall JR, et al. Impact of losses to follow-up on diet/alcohol and lung cancer analyses in the New York State Cohort. Nutr Cancer. 2002;42:41–7. doi: 10.1207/S15327914NC421_6. [DOI] [PubMed] [Google Scholar]
- 19.Giles GG, English DR. The Melbourne Collaborative Cohort Study. IARC Sci Publ. 2002;156:69–70. [PubMed] [Google Scholar]
- 20.Rohan TE, Jain M, Howe GR, Miller AB. A cohort study of dietary carotenoids and lung cancer risk in women (Canada) Cancer Causes Control. 2002;13:231–7. doi: 10.1023/a:1015048619413. [DOI] [PubMed] [Google Scholar]
- 21.Calle EE, Rodriguez C, Jacobs EJ, et al. The American Cancer Society Cancer Prevention Study II Nutrition Cohort: rationale, study design, and baseline characteristics. Cancer. 2002;94:500–11. doi: 10.1002/cncr.10197. [DOI] [PubMed] [Google Scholar]
- 22.Flood A, Velie EM, Chaterjee N, et al. Fruit and vegetable intakes and the risk of colorectal cancer in the Breast Cancer Detection Demonstration Project follow-up cohort. Am J Clin Nutr. 2002;75:936–43. doi: 10.1093/ajcn/75.5.936. [DOI] [PubMed] [Google Scholar]
- 23.Percy C, Van Holten V, Muir C. International Classification of Diseases for Oncology. Geneva, Switzerland: World Health Organization; 1990. [Google Scholar]
- 24.Puckett CD. The Educational Annotation of ICD-9-CM. Reno, NV: Channel Publishing, Ltd; 1986. [Google Scholar]
- 25.Pennington JAT. Bowes and Church’s Food Values of Portions Commonly Used. New York: Lippincott-Raven; 1998. [Google Scholar]
- 26.Smith SA, Campbell DR, Elmer PJ, Martini MC, Slavin JL, Potter JD. The University of Minnesota Cancer Prevention Research Unit vegetable and fruit classification scheme (United States) Cancer Causes Control. 1995;6:292–302. doi: 10.1007/BF00051404. [DOI] [PubMed] [Google Scholar]
- 27.Willett W, Stampfer M. Implications of total energy intake for epidemiologic analysis. In: Willett W, editor. Nutritional Epidemiology. New York: Oxford University Press; 1998. pp. 273–301. [Google Scholar]
- 28.Pietinen P, Hartman AM, Haapa E, et al. Reproducibility and validity of dietary assessment instruments. I. A self-administered food use questionnaire with a portion size picture booklet. Am J Epidemiol. 1988;128:655–66. doi: 10.1093/oxfordjournals.aje.a115013. [DOI] [PubMed] [Google Scholar]
- 29.Flagg EW, Coates RJ, Calle EE, Potischman N, Thun MJ. Validation of the American Cancer Society Cancer Prevention Study II Nutrition Survey Cohort food frequency questionnaire. Epidemiology. 2000;11:462–8. doi: 10.1097/00001648-200007000-00017. [DOI] [PubMed] [Google Scholar]
- 30.Newby PK, Hu FB, Rimm EB, et al. Reproducibility and validity of the Diet Quality Index Revised as assessed by use of a food-frequency questionnaire. Am J Clin Nutr. 2003;78:941–9. doi: 10.1093/ajcn/78.5.941. [DOI] [PubMed] [Google Scholar]
- 31.Goldbohm RA, van den Brandt PA, Brants HA, et al. Validation of a dietary questionnaire used in a large-scale prospective cohort study on diet and cancer. European Journal of Clinical Nutrition. 1994;48:253–65. [PubMed] [Google Scholar]
- 32.Feskanich D, Rimm EB, Giovannucci EL, et al. Reproducibility and validity of food intake measurements from a semiquantitative food frequency questionnaire. J Am Diet Assoc. 1993;93:790–6. doi: 10.1016/0002-8223(93)91754-e. [DOI] [PubMed] [Google Scholar]
- 33.Feskanich D, Marshall J, Rimm EB, Litin LB, Willett WC. Simulated validation of a brief food frequency questionnaire. Annals of Epidemiology. 1994;4:181–7. doi: 10.1016/1047-2797(94)90095-7. [DOI] [PubMed] [Google Scholar]
- 34.Rimm EB, Giovannucci EL, Stampfer MJ, Colditz GA, Litin LB, Willett WC. Reproducibility and validity of a expanded self-administered semiquantitative food frequency questionnaire among male health professionals. Am J Epidemiol. 1992;135:1114–26. doi: 10.1093/oxfordjournals.aje.a116211. [DOI] [PubMed] [Google Scholar]
- 35.Cox DR. Regression models and life-tables. J Royal Stat Soc. 1972;34:187–220. [Google Scholar]
- 36.DerSimonian R, Laird N. Meta-analysis in clinical trials. Controlled Clin Trials. 1986;7:177–88. doi: 10.1016/0197-2456(86)90046-2. [DOI] [PubMed] [Google Scholar]
- 37.Smith PL. Splines as a useful and convenient statistical tool. The American Statistician. 1979;33:57–62. [Google Scholar]
- 38.Durrleman S, Simon R. Flexible regression models with cubic splines. Stat Med. 1989;8:551–61. doi: 10.1002/sim.4780080504. [DOI] [PubMed] [Google Scholar]
- 39.Stram DO. Meta-analysis of published data using a linear mixed-effects model. Biometrics. 1996;52:536–44. [PubMed] [Google Scholar]
- 40.Mannisto S, Yaun SS, Hunter DJ, et al. Dietary carotenoids and risk of colorectal cancer in a pooled analysis of 11 cohort studies. Am J Epidemiol. 2007;165:246–55. doi: 10.1093/aje/kwk009. [DOI] [PubMed] [Google Scholar]
- 41.Hodge AM, English DR, McCredie MR, et al. Foods, nutrients and prostate cancer. Cancer Causes Control. 2004;15:11–20. doi: 10.1023/B:CACO.0000016568.25127.10. [DOI] [PubMed] [Google Scholar]
- 42.Horn-Ross PL, Hoggatt KJ, West DW, et al. Recent diet and breast cancer risk: the California Teachers Study (USA) Cancer Causes Control. 2002;13:407–15. doi: 10.1023/a:1015786030864. [DOI] [PubMed] [Google Scholar]
- 43.Weikert S, Boeing H, Pischon T, et al. Fruits and vegetables and renal cell carcinoma: Findings from the European prospective investigation into cancer and nutrition (EPIC) Int J Cancer. 2006;118:3133–9. doi: 10.1002/ijc.21765. [DOI] [PubMed] [Google Scholar]
- 44.McLaughlin JK, Gao YT, Gao RN, et al. Risk factors for renal-cell cancer in Shanghai, China. Int J Cancer. 1992;52:562–5. doi: 10.1002/ijc.2910520411. [DOI] [PubMed] [Google Scholar]
- 45.Negri E, La Vecchia C, Franceschi S, D’Avanzo B, Parazzini F. Vegetable and fruit consumption and cancer risk. Int J Cancer. 1991;48:350–4. doi: 10.1002/ijc.2910480307. [DOI] [PubMed] [Google Scholar]
- 46.De Stefani E, Fierro L, Mendilaharsu M, et al. Meat intake, ‘mate’ drinking and renal cell cancer in Uruguay: a case- control study. Br J Cancer. 1998;78:1239–43. doi: 10.1038/bjc.1998.661. [DOI] [PMC free article] [PubMed] [Google Scholar]
- 47.Yu MC, Mack TM, Hanisch R, Cicioni C, Henderson BE. Cigarette smoking, obesity, diuretic use, and coffee consumption as risk factors for renal cell carcinoma. J Natl Cancer Inst. 1986;77:351–6. [PubMed] [Google Scholar]
- 48.Talamini R, Baron AE, Barra S, et al. A case-control study of risk factor for renal cell cancer in northern Italy. Cancer Causes Control. 1990;1:125–31. doi: 10.1007/BF00053163. [DOI] [PubMed] [Google Scholar]
- 49.Bravi F, Bosetti C, Scotti L, et al. Food groups and renal cell carcinoma: a case-control study from Italy. Int J Cancer. 2007;120:681–5. doi: 10.1002/ijc.22225. [DOI] [PubMed] [Google Scholar]
- 50.Hsu CC, Chow WH, Boffetta P, et al. Dietary Risk Factors for Kidney Cancer in Eastern and Central Europe. Am J Epidemiol. 2007;166:62–70. doi: 10.1093/aje/kwm043. [DOI] [PubMed] [Google Scholar]
- 51.Fraser GE, Phillips RL, Beeson WL. Hypertension, antihypertensive medication and risk of renal carcinoma in California Seventh-Day Adventists. Int J Epidemiol. 1990;19:832–8. doi: 10.1093/ije/19.4.832. [DOI] [PubMed] [Google Scholar]
- 52.Krinsky NI. Carotenoids and Cancer: Basic Research Studies. In: Frei B, editor. Natural Antioxidants in Human Health and Disease. San Diego, CA: Academic Press; 1994. pp. 239–61. [Google Scholar]
- 53.Mangels AR, Holden JM, Beecher GR, Forman MR, Lanza E. Carotenoid content of fruits and vegetables: an evaluation of analytic data. J Am Diet Assoc. 1993;93:284–96. doi: 10.1016/0002-8223(93)91553-3. [DOI] [PubMed] [Google Scholar]
- 54.Kreiger N, Marrett LD, Dodds L, Hilditch S, Darlington GA. Risk factors for renal cell carcinoma: results of a population-based case-control study. Cancer Causes Control. 1993;4:101–10. doi: 10.1007/BF00053150. [DOI] [PubMed] [Google Scholar]
- 55.Negri E, Foschi R, Talamini R, et al. Family history of cancer and the risk of renal cell cancer. Cancer Epidemiol Biomarkers Prev. 2006;15:2441–4. doi: 10.1158/1055-9965.EPI-06-0382. [DOI] [PubMed] [Google Scholar]
- 56.Lipworth L, Tarone RE, McLaughlin JK. The epidemiology of renal cell carcinoma. J Urol. 2006;176:2353–8. doi: 10.1016/j.juro.2006.07.130. [DOI] [PubMed] [Google Scholar]