

SYNOPSIS
Investigation of the interplay between the cerebral circulation and brain cellular function is fundamental to understanding both the pathophysiology and treatment of stroke. Currently, PET is the only technique that provides accurate, quantitative in vivo regional measurements of both cerebral circulation and cellular metabolism in human subjects. We review normal human cerebral blood flow and metabolism and human PET studies of ischemic stroke, carotid artery disease, vascular dementia, intracerebral hemorrhage and aneurysmal subarachnoid hemorrhage and discuss how these studies have added to our understanding of the pathophysiology of human cerebrovascular disease.
Keywords: positron emission tomography, cerebrovascular disease, vascular dementia, cerebral blood flow, cerebral metabolism, cerebral hemodynamics
INTRODUCTION
Cerebrovascular disease results from a derangement of the normal relationship between the cerebral vasculature and the brain parenchyma. Thus, investigation of the interplay between the cerebral circulation and brain cellular function is fundamental to understanding both the pathophysiology and treatment of stroke. Currently, PET is the only technique that provides accurate, quantitative in vivo regional measurements of both cerebral circulation and cellular metabolism in human subjects. It is therefore well-suited for the study of human cerebrovascular disease, but its application to this end is not easy. An on-site cyclotron and radiochemistry facility is necessary due to the short half-lives of the commonly used radionuclides 15O (2 minutes) and 11C (20 minutes). Quantitative physiological measurements require complex postprocessing and multiple arterial blood samples, although for some specific applications simple count-based images can be used.(1;2) Patients with acute stroke may be medically unstable, requiring a nurse or physician in attendance. For these reasons, PET is still a research tool for cerebrovascular disease. It has provided us with valuable new knowledge and insight into both ischemic and hemorrhagic stroke regarding pathophysiology, therapy and prognosis but has not entered the mainstream of clinical practice. In the future, the results of the Carotid Occlusion Surgery Study (www.cosstrial.org), an ongoing clinical trial in which PET is being used to determine eligibility, may demonstrate the clinical value of PET for the routine management of cerebrovascular disease.
NORMAL CEREBRAL HEMODYNAMICS AND ENERGY METABOLISM
Energy in the brain is used for the maintenance of membrane potentials, for the biosynthesis and transport of neurotransmitters, and for the biosynthesis and transport of cellular elements. Under normal circumstances, the brain relies on a continuous supply of oxygen and glucose from the blood for its functional and structural integrity.(3) Since storage of substrates for energy metabolism in the brain is minimal, it is exquisitely sensitive to even brief disturbances in this supply. Complete interruption of the cerebral circulation in cardiac arrest causes loss of consciousness within 10 seconds.(4)
Healthy young adults have an average whole brain cerebral blood flow (CBF) of approximately 46 mL 100g−1 min−1, cerebral metabolic rate of oxygen (CMRO2) of 3.0 mL 100g−1 min−1 (134 μmol 100g−1 min−1), and cerebral metabolic rate of glucose (CMRglc) of 25 μmol 100g−1 min−1.(5–8) The CMRO2/CMRglc molar ratio calculated from arterio-jugular venous differences is 5.4 rather than 6.0 as expected for complete oxidation because of the production of a small amount of lactate by glycolysis.(5;7;9) CBF in gray matter (80 mL 100g−1 min−1) is approximately four times higher than in white matter (20 mL 100g−1 min−1), but differences of this magnitude are not seen with PET due to partial volume effects.(10) Under normal physiological conditions, regional CBF is closely matched to the resting regional metabolic rate of the tissue.(11;12) As with CBF, CMRO2 and CMRglc are higher in gray than white matter. Because of this relationship between regional flow and metabolism, the fraction of available glucose and oxygen extracted by the brain from the blood is uniform throughout the brain (Figure 1). The oxygen extraction fraction (OEF) is normally 30–40%, indicating that oxygen supply is 2–3 times greater than oxygen demand. The glucose extraction fraction (GEF) is normally about 10%.(12;13)
Figure 1.

Normal cerebral blood flow and metabolism. PET scans from a normal 70 year old woman. Cerebral blood flow (CBF, mL 100g−1 min−1), cerebral metabolic rate of oxygen (CMRO2, mL 100g−1 min−1) and cerebral metabolic rate of glucose (CMRglc; micromol 100g−1 min−1) all show higher values in cortex that in white matter. Oxygen extraction fraction (OEF) and glucose extraction fraction (GEF) are relatively uniform throughout the brain. Adapted from Powers WJ, Zazulia AR. The use of positron emission tomography in cerebrovascular disease. Neuroimaging Clin N Am 2003; 13: 741–758.
Many studies report that CBF declines from the third decade onward.(14–17) The change in metabolic rate for oxygen and glucose with age is less clear, with several studies showing a decrease(14;16;18–20) and others showing no change.(21–23) Studies that have corrected for brain atrophy show lesser or absent changes in CBF, CMRO2 and CMRglc with increasing age. (19;24–26) Our own PET data corrected for brain atrophy from 23 normal subjects, ages 23–71 years, shows no significant change in CBF or CMRO2, but a decline in CMRglc of 4–5% per decade.
CEREBROVASCULAR CONTROL
Regional CBF is determined by the local cerebral perfusion pressure (CPP) and the local cerebrovascular resistance (CVR).
CPP is equal to the difference between the mean arterial pressure (MAP) driving blood into the brain and the venous backpressure. Venous backpressure is negligible unless there is elevated intracranial pressure (ICP) or obstruction of venous outflow, such as cerebral venous thrombosis. Under normal conditions of constant MAP and CPP, any local changes in CBF must occur as a result of changes in CVR. CVR is determined by blood viscosity, vessel length, and vessel radius. Of these factors, changes in the radius of resistance vessels (primarily arterioles) are the primary determinants of CBF in most situations with normal CPP.
The cerebrovascular bed is not a static system. Resistance vessels dilate and constrict in response to a variety of stimuli. When there is a primary reduction in the metabolic rate of brain cells (e.g. by hypothermia or barbiturates), vessels constrict to produce a comparable decline in CBF and thus little or no change in OEF or GEF.(27–29) With increased neuronal activity, vessels dilate producing an increase in regional CBF that is accompanied by a similar in magnitude increase in regional CMRglc and little or no increase in regional CMRO2.(30–32) Acute changes in arterial pCO2 cause proportional changes in CBF. A decrease in arterial pCO2 from hyperventilation leads to a decrease in CBF (30–35% at 25 mm Hg) and an increase in arterial pCO2 leads to an increase in CBF (about 75% at 50 mm Hg).(33–37) The mechanism for the change in CBF is a change in CVR produced by vasodilation with increased pCO2 and vasoconstriction with decreased pCO2.(34) When the perturbation in arterial pCO2 is maintained for a prolonged time, CBF gradually returns toward normal values.(37) With passive hyperventilation, no reduction in CMRO2 or high energy phosphate levels accompanies the reduction in CBF.(38;39) However, with active hyperventilation, a slight increase in CMRO2 has been reported.(33;34). The effects of arterial pO2 on the cerebral circulation are different from those of pCO2. CBF does not increase until arterial pO2 is reduced below about 30–50 mm Hg,(40;41) indicating that variations in pO2 are unlikely to constitute an important mechanism for regulating CBF at physiological levels of pO2. Because of the sigmoid shape of the oxygen dissociation curve, a significant reduction in hemoglobin saturation and hence in arterial oxygen content (CaO2) does not occur until arterial pO2 falls to about 50–60 mm Hg.(40;42) The similarity between this number and the threshold for hypoxia-induced reduction in CBF suggests that it is primarily CaO2 and not pO2 that determines CBF. Reductions in CaO2 due to hypoxemia or anemia cause vasodilation and compensatory increases in CBF.(5;34;40;43) Likewise, the increase in CaO2 with polycythemia is associated with a decrease in CBF.(44) In neither of these cases does cerebral metabolism change.(40;44) With chronic changes in CaO2, there is a significant reciprocal inverse relationship between CaO2 and CBF throughout the range of oxygen content levels such that oxygen delivery (CBF x CaO2) remains constant.(43) Acute changes in CaO2 due to reduction in hemoglobin or pO2 produce less of an increase in CBF than do chronic changes.(45;46) Hematocrit is an important determinant of viscosity and thus viscosity often varies with CaO2. Although an inverse relationship between viscosity and CBF has also been reported,(43;47) it is unlikely that viscosity is an independent determinant of CBF under most circumstances. In anemic, paraproteinemic subjects in whom reduced CaO2 is dissociated from changes in viscosity, there is no correlation between viscosity and CBF, but there is a highly significant inverse relationship between CaO2 and CBF.(48) In hematologically normal subjects, reduction of viscosity by plasma exchange without a concomitant change in hemoglobin concentration or CaO2 does not increase CBF.(49) Finally, reducing CaO2 via carbon monoxide inhalation without changing arterial pO2 or viscosity has been shown to increase CBF.(50) From these findings, it can be concluded that increases in blood viscosity induce compensatory vasodilation to maintain cerebral oxygen delivery. Thus, increases in CBF brought about by hemodilution, if they are simply reciprocal responses to changes in arterial oxygen content, will not increase cerebral oxygen delivery and may even decrease it.(51) This compensatory mechanism may be exhausted when pre-existing vasodilation impairs the ability of vessels to dilate further to changes in viscosity.(52) All of these responses of the cerebral vasculature have been determined at normal CPP. When CPP varies, a different set of cerebrovascular and brain metabolic responses occur.
Changes in CPP over a wide range from 70 to 150 mm Hg have little effect on CBF. Known as autoregulation, this compensatory mechanism is mediated by changes in CVR. When CPP decreases, vasodilation of the small arteries or arterioles reduces CVR. When CPP increases, vasoconstriction of the small arteries or arterioles increases CVR (53;54) This mechanism is effective at maintaining CBF in normal human subjects until MAP falls below the lower autoregulatory limit.(55;56) Chronic hypertension shifts both the lower and upper limits of autoregulation to higher levels. In chronically hypertensive subjects, the lower autoregulatory limit is 100–120 mm Hg MAP.(55;57) This limit is variably and unpredictably affected by chronic antihypertensive drug treatment. Thus, acute reductions in MAP or CPP that would be safe in normotensive subjects may precipitate cerebral ischemia in patients with chronic hypertension. As CPP falls below the autoregulatory limit and the maximal vasodilatory capacity of the cerebral circulation has been exceeded, there is a steep decline in CBF. A progressive increase in the amount of oxygen extracted from the blood by the brain by a factor of two or more to levels sometimes approaching 100% now maintains oxygen metabolism (Figure 2). (58;59) When maximally increased OEF is no longer adequate to supply the energy needs of the brain, further reductions in CBF disrupt normal cellular metabolism and produce clinical evidence of brain dysfunction.
Figure 2.

Compensatory responses to reduced cerebral perfusion pressure (CPP). As CPP falls, cerebral blood flow (CBF) is initially maintained at almost baseline levels by arteriolar dilation. When vasodilatory capacity has been exceeded, cerebral autoregulation fails and CBF begins to decrease rapidly. A progressive increase in oxygen extraction fraction (OEF) preserves (CMRO2). The response of cerebral blood volume (CBV) to reduced CPP is variable, ranging from a steady rise (of as much as 150%) to only a modest increase beginning at the point of autoregulatory failure. Adapted from Powers WJ, Zazulia AR. The use of positron emission tomography in cerebrovascular disease. Neuroimaging Clin N Am 2003; 13: 741–758.
When the cerebral blood vessels are already dilated in response to some other stimulus, they are less responsive to further vasodilation induced by reduced CPP. Therefore, the autoregulatory response is attenuated or lost in the setting of pre-existing hypercapnia, anemia, or severe hypoxemia.(60;61)
The cerebral blood volume (CBV) is the amount of blood circulating in the brain vessels at any time. CBV is composed of arterial, capillary, and venous segments. Veins account for some 80–85% of CBV, arteries 10–15%, and capillaries less than 5%.(62;63) Of these, arteries are the most responsive to autoregulatory changes in CPP. Veins respond less and capillaries even less.(64;65) Although reductions in CPP produce visible dilation of pial vessels, data regarding the response of CBV to reduced CPP are conflicting.(53;66–68) (Figure 1.) With experimental reductions in CPP, it is sometimes possible to measure an increase in CBV that is presumed to be due to autoregulatory vasodilation.(69–71) However, this increase in CBV to reduced CPP is not always evident.(59) Failure to demonstrate increased CBV in the setting of reduced CPP has been ascribed to various possible mechanisms in various situations, including differential vasodilatory capacity of different vascular beds, passive collapse of vessels due to low intraluminal pressures, small vessel vasospasm, and re-setting of vascular tone in response to a compensatory down-regulation of CMRO2.(72) The CBF/CBV ratio (or its reciprocal, the mean vascular transit time, MVTT) has been proposed to be a more sensitive indicator of reduced CPP than CBV alone.(59;73) Although it may be more sensitive, it is not reliable because it may decrease in low flow conditions with normal perfusion pressure, such as hypocapnia.(74;75)
HEMODYNAMIC EFFECTS OF ARTERIAL OCCLUSIVE DISEASE
Carotid endarterectomy is empirically proven by randomized clinical trials to reduce subsequent stroke risk in patients with high-grade extracranial carotid stenosis; therefore differentiating the relative importance of hemodynamic versus embolic mechanisms in these patients has little clinical value.(76;77) The same cannot be said for symptomatic carotid occlusion, for which no surgical treatment has proven to be effective in reducing the 5–10% annual risk of subsequent ipsilateral ischemic stroke on medical therapy.(2;78–80) A substantial amount of PET research has been devoted to assessing the hemodynamic effect of arterial occlusive disease with the goal of defining a subgroup of patients with hemodynamic compromise who might benefit from revascularization procedures.
The hemodynamic effect of carotid artery occlusion on the cerebral circulation depends on the adequacy of the collateral circulation. Vascular imaging techniques such as angiography or Doppler ultrasonography can identify the presence of these collateral vessels, but not necessarily the adequacy of the blood supply they provide.(81)
Measurement of CBF alone also is inadequate for this purpose. Normal CBF may be found when CPP is reduced but flow is maintained by autoregulatory vasodilation of distal resistance vessels. Second, CBF may be low when perfusion pressure is normal, such as when the metabolic demands of the tissue are reduced due to pre-existing ischemic damage or the destruction of normal afferent or efferent fibers by a remote lesion.(58;82–84) Current methods for assessment of local cerebral hemodynamics depend on the compensatory responses observed during global reductions in CPP due to systemic hypotension and increased ICP, as described above. Similar responses are assumed to occur with local reductions in CPP due to focal arterial stenosis.
Three strategies are commonly used with PET to determine the hemodynamic effect of carotid artery occlusion on the cerebral circulation. The first relies on measurement of CBF at baseline and after application of a vasodilatory stimulus, such as CO2 inhalation, acetazolamide administration, or physiological increase in neuronal activity (e.g., hand movement). Impairment of the normal increase in regional CBF to vasodilatory stimuli is assumed to reflect existing autoregulatory vasodilation due to reduced CPP. The second strategy entails the quantitative measurement of regional CBV either alone or in combination with measurement of CBF at rest to detect the presence of autoregulatory vasodilation. Increases in CBV or the CBV/CBF ratio relative to the range observed in normal control subjects is assumed to indicate hemodynamic compromise, but, as noted above, the changes in CBV that can be measured with experimental reductions in CPP are variable and inconsistent. As a result, the sensitivity and specificity of these measurements in detecting reduced CPP is unknown. The third strategy involves direct measurement of regional OEF as an indicator of local autoregulatory failure.
Based on the known physiological responses of CBF, CBV, and OEF to reductions in global CPP, a three-stage sequential classification system for local cerebral hemodynamic status due to chronic carotid occlusion has been proposed.(85) Stage 0 is the condition of normal CPP due to collateral circulation that completely compensates for the occluded artery. CBF and CMRO2 are closely matched such that OEF is normal. CBV is not elevated and the CBF response to vasodilatory stimuli is normal. Stage I hemodynamic compromise reflects a condition of reduced CPP where CBF is maintained by autoregulatory vasodilation of arterioles. Consequently, CBV is increased and the CBF response to vasodilatory stimuli is decreased, but OEF remains normal. In Stage II hemodynamic failure, CPP is reduced below the lower limit of autoregulation. There is increased OEF since CBF has declined with respect to CMRO2. CMRO2 is preserved at a level that reflects the underlying energy demands of the tissue, but may be lower than normal due to the effects of previous ischemic damage.(58;82;83) This stage has also been termed “misery perfusion” by Baron et al. (Figure 3) (86;87)
Figure 3.
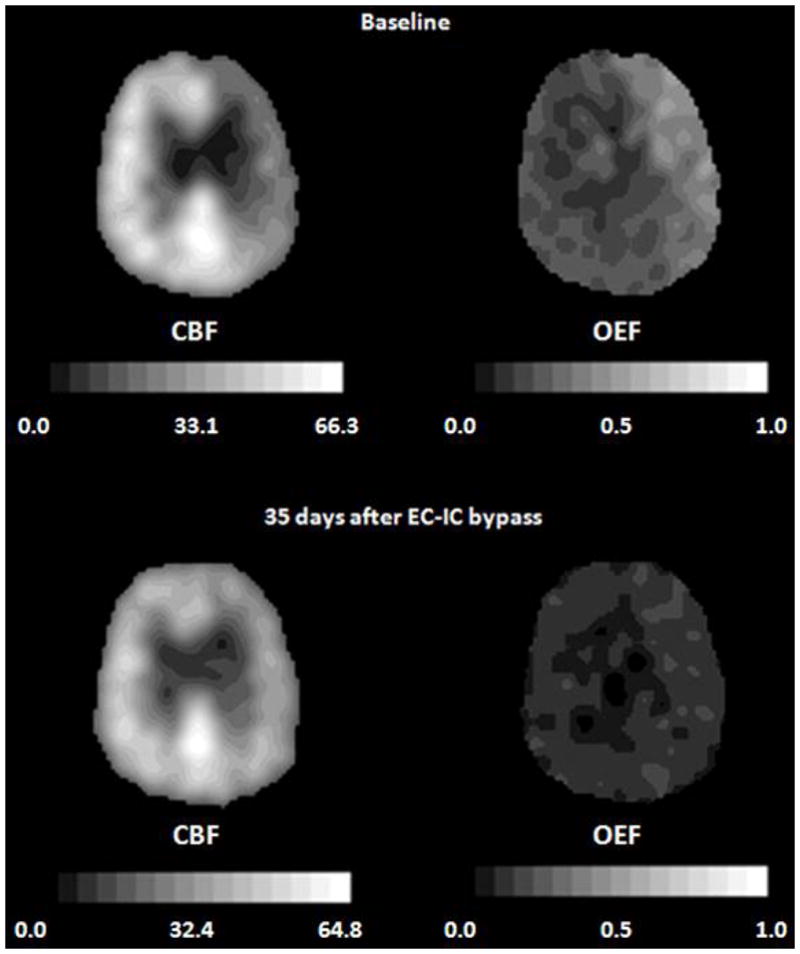
Improvement of oxygen extraction fraction (OEF) after extracranial-intracranial (EC-IC) bypass surgery in a 69-year-old man with symptomatic occlusion of the right carotid artery. The baseline PET images (top row) demonstrate reduced cerebral blood flow (CBF, mL 100g−1 min−1), and increased OEF in the right hemisphere. A second study performed 35 days after EC-IC bypass shows that ipsilateral CBF has improved and OEF has normalized (bottom row). In all images, the right side of the brain is on the reader’s right. Adapted from Powers WJ, Zazulia AR. The use of positron emission tomography in cerebrovascular disease. Neuroimaging Clin N Am 2003; 13: 741–758.
Two independent PET studies have demonstrated that Stage II hemodynamic failure is a powerful independent predictor of subsequent ipsilateral ischemic stroke. Yamauchi et al (88) found a significantly higher 1-year incidence of ipsilateral stroke in patients with symptomatic internal carotid artery (ICA) or middle cerebral artery (MCA) occlusive disease having increased OEF (4/7) than in those having normal OEF (2/33). In 3 of 4 patients with increased OEF and subsequent stroke, infarction occurred in a watershed territory corresponding to the area of increased OEF.(89) In the St. Louis Carotid Occlusion Study (STLCOS), a blinded prospective study of 81 patients with symptomatic carotid occlusion, Grubb et al similarly found that increased OEF distal to the occlusion was an independent predictor of subsequent ipsilateral ischemic stroke. Ipsilateral stroke occurred in 11/39 patients with increased OEF and in 2/42 patients with normal OEF, respectively. When other factors were controlled for, patients with symptomatic carotid artery occlusion with increased OEF had a risk of ipsilateral ischemic stroke seven times greater than those with normal OEF. (90) These investigations establish the prognostic value of OEF in patients with symptomatic carotid occlusion but not its role in choosing therapy. Even though previous PET studies demonstrated improvement in OEF following extracranial-intracanial (EC-IC) bypass, the benefit of this surgery in reducing the risk of stroke remains to be determined by a properly designed clinical trial (Figure 3).(91–93) The Carotid Occlusion Surgery Study is currently underway to assess the efficacy of EC-IC bypass in reducing the risk of subsequent stroke in patients with symptomatic carotid occlusion who have increased OEF measured by PET (94).
A PET study of patients with never-symptomatic carotid occlusion reported a lower incidence of elevated OEF (4 of 30) than is seen in symptomatic patients (39 of 81). Since no ipsilateral strokes occurred in any of the 30 subjects, no conclusions could be drawn with regard to the ability of increased OEF to predict ipsilateral stroke risk in this population.(95)
Although the three-stage classification scheme is conceptually useful, it is too simplistic. As discussed above, increases in CBV are not reliable indices of reduced CPP. CBF responses to different vasodilatory agents may be impaired or normal in the same patient.(96–98) A normal vasodilatory response may occur in the setting of increased CBV.(99;100) Finally, according to the three-stage system, all patients with increased OEF should have increased CBV and poor response to vasoactive stimuli. However, this increase in CBV is not always evident nor is the impaired response to vasodilatory stimuli.(72;101)
In the original descriptions of the three-stage classification of cerebral hemodynamics, the effects of further reductions in CPP and CBF when OEF is maximal (beyond Stage II) were described, but acknowledged to be based on inadequate data: CMRO2 will decrease, normal cellular function and metabolism will be disrupted and cell death may occur. In this proposed scheme, OEF remained maximal as CBF and CMRO2 both declined.(58;85) Nemoto and colleagues have postulated that patients who initially have CPP below the autoregulatory limit with increased OEF (Stage II hemodynamic failure) may suffer subsequent ischemic neuronal damage that reduces CMRO2 and normalizes OEF, but without any improvement in CPP. They refer to this as Stage III.(102)The plausibility of this scenario is supported by PET studies that show evidence for selective neuronal necrosis in brain regions with low CMRO2 and normal OEF and the progressive development of selective neuronal necrosis in areas with initially high OEF.(82;103). Nemoto and colleagues propose that, while these patients would look like Stage I hemodynamic compromise (impaired response to vasodilatory stimuli, normal OEF), their stroke risk would in fact be similar to that of stage II patients due to the persistently low CPP. (102) Thus, according to this construct, there should be a group of patients with normal OEF and impaired vasoreactivity who are at high risk for stroke. This does not appear to be the case. In the STLCOS, none of the 13 ipsilateral strokes that occurred in follow-up of 3.1 years occurred in patients with increased CBV and normal OEF.(72) The two patients with normal OEF who had ipsilateral strokes were among the 8 patients with the highest OEF values in the normal OEF group of 41 subjects. Furthermore, in this cohort of patients, OEF was predictive of subsequent ipsilateral stroke as a continuous variable, indicating that the higher the OEF the higher the risk of stroke.(104)
EVOLUTION OF ACUTE INFARCTION
The evolution of changes in flow and metabolism early after acute ischemic stroke has been established from PET studies of MCA occlusion in large mammals. Approximately one hour after occlusion, CBF was decreased and OEF was increased in the territory of the occluded MCA. CMRO2 was reduced somewhat initially in the deep regions of the territory, but fell further over the subsequent 2–3 hours. CBF remained relatively stable during this time period, falling only slightly.(105–109) Reflecting the stably reduced CBF and further declining CMRO2, the initially markedly increased OEF progressively decreased. By 24 hours, CBF in the center of the MCA territory reached its nadir at less than 20% of baseline values and CMRO2 reached 25% of baseline values (Figure 4). Also at this time point, increased OEF was seen to develop outside the area of primary perfusion disturbance in the tissue adjacent to the infarct core.(109) The volume of severely hypometabolic tissue remained stable between 1 and 7 hours post-occlusion, but increased by 24 hours and increased even further an average of 17 days after occlusion.(110) The fate of high OEF regions in the core and surrounding regions is variable; some portions may go on to infarct and other portions may survive.(105)
Figure 4.

Pathophysiological changes in cerebral infarction. At the onset of ischemia, the initial fall in regional cerebral blood flow (CBF) is mirrored by a rise in regional oxygen extraction fraction (OEF). Since the increase in OEF is not sufficient to supply the energy needs of the brain, the regional cerebral metabolic rate of oxygen (CMRO2) falls to the level of oxygen delivery. With time, CMRO2 falls further even though there is only a slight further decrease in CBF, resulting in a decrease in OEF. Reperfusion via recanalization of the occluded artery or recruitment of collateral pathways results in an increase in CBF (“luxury perfusion”) and a concomitant fall in OEF below baseline with no change in CMRO2. With evolution to the stage of chronic infarction, CBF progressively declines and OEF increases, but often remains below baseline values. Adapted from Powers WJ, Zazulia AR. The use of positron emission tomography in cerebrovascular disease. Neuroimaging Clin N Am 2003; 13: 741–758.
Human data obtained at 2 to 24 hours after ictus show an area of reduced CBF, reduced CMRO2, and high OEF.(111;112) Over the subsequent days, CBF usually increases. Spontaneous reperfusion will occur in about three-quarters of patients. It may take place within a few hours of infarction,(113) but peaks at day 14.(114) This rise in CBF occurs without a concomitant rise in CMRO2; rather, CMRO2 generally falls further. Consequently, a decrease in regional OEF below normal values mirrors the rise in CBF. This state, termed “luxury perfusion,”(115) indicates that the normal coupling of CBF to oxygen metabolism in the resting brain is deranged (Figure 5). Luxury perfusion may be absolute with CBF values greater than normal. Alternatively, luxury perfusion may be relative with low or normal CBF that is still in excess of that required to produce a normal OEF for the reduced CMRO2.(116) Luxury perfusion is evident by 48 hours in one-third of patients(117;118) and peaks at 1 to 2 weeks, paralleling the time course of spontaneous reperfusion.(116) Following this subacute period, CBF progressively declines and OEF normalizes such that the chronic stable infarct demonstrates flow and metabolism that are close to zero with OEF at or below baseline values (Figure 6).(119) In the rim of tissue surrounding the infarct core, areas demonstrating reduced CBF and increased OEF with variable CMRO2 can often be identified within hours after ictus and may persist for up to 16 hours. As with the animal data, the fate of high OEF regions in the core and surrounding regions is variable; some will infarct and some will not.(120;121)
Figure 5.

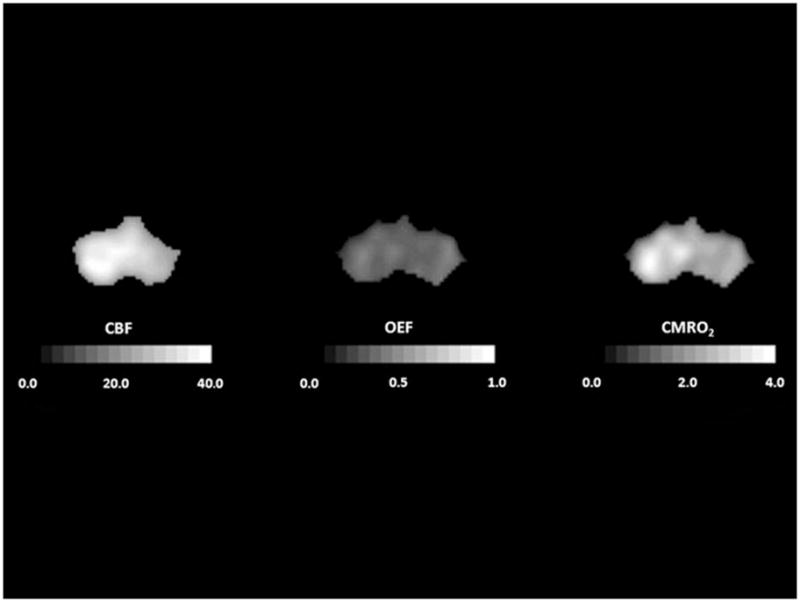
Luxury perfusion seven days after a hemispheric infarction. Cerebral blood flow (CBF, mL 100g−1 min−1) is elevated in combination with reduced cerebral metabolic rate of oxygen (CMRO2, mL 100g−1 min−1) and OEF. Adapted from Powers WJ, Zazulia AR. The use of positron emission tomography in cerebrovascular disease. Neuroimaging Clin N Am 2003; 13: 741–758.
Figure 6.

PET five months after hemispheric infarction. Cerebral blood flow (CBF, mL 100g−1 min−1) and cerebral metabolic rate of oxygen (CMRO2, mL 100g−1 min−1) are severely reduced and oxygen extraction fraction (OEF) is below normal.
The peripheral benzodiazepine receptor ligand 11C-PK 11195 primarily binds to cerebral microglia/macrophages.(122;123) It can be used to image the inflammatory responses that occur following acute cerebral infarction.(124) In studies of human ischemic stroke, increased 11C-PK 11195 uptake begins after 3 days and persists for months. It is seen in the region of the primary lesion and later spreads to distant sites in the brain.(125;126)
IDENTIFICATION OF PREVENTABLE INFARCTION
Studies in experimental animals have elucidated the capacity of neurons to tolerate transient cerebral ischemia. At CBF below 20 mL 100g−1 min−1, neuronal electrical activity is at first impaired and then abolished. Neurological deficits appear. If CBF remains below 20 mL 100g−1 min−1 the cells may go on to die. The ability of brain cells to tolerate CBF below 20 mL 100g−1 min−1 depends on both the magnitude and duration of the CBF reduction. CBF of 5–10 mL 100g−1 min−1 may be tolerated for a period of less than one hour whereas CBF of 10–15 mL 100g−1 min−1 may not produce cell death for 2–3 hours. Some neurons may tolerate the same reduction in CBF for a period of time that is lethal to other cells. White matter is more tolerant than gray matter.(127–133) In a baboon model of transient MCA occlusion, evidence of reversibility as manifested by immediate improvement of hemiparesis was observed in 14/14 with occlusion less than one hour, 8/11 with occlusion of 2–4 hours, 1/3 with occlusion of eight hours and 1/6 with occlusion of 16–24 hours.(132;134–136)
The demonstration of improved recovery from stroke with early intravenous thrombolytic therapy provided the human counterpart for these experimental studies.(137;138) Although currently limited in practice to a time window of 4.5 hours, the variability observed in both animal experiments and clinical practice has led to a great deal of interest in developing a PET method to identify those patients with preventable infarction, i.e. vulnerable brain cells that are still alive, but whose natural history is to go on and die. A simple construct to test the ability of PET to accurately identify preventable infarction has recently been proposed (Table 1).(139) It requires three PET signals that spatially match the three pathophysiological tissue types in the brain with acute cerebral ischemia – already dead or irreversibly damaged (signal A), preventable infarction (signal B), and not at risk (signal C). Three distinct approaches based on three different PET radiopharmaceuticals have been investigated: 18F-fluoromisonidazole, 11C-flumazenil, and combined measurements of CBF and CMRO2.
Table 1.
Criteria to Establish Accurate PET Imaging of Preventable Infarction
| Imaging Signal A | Imaging Signal B | Imaging Signal C | |
|---|---|---|---|
| Untreated Tissue | All Dies | All Dies | All Survives |
| Treated Tissue | All Dies | All Survives | All Survives |
18F-fluoromisonidazole (18F-FMISO) is a nitroimidazole compound that is selectively trapped within hypoxic but living cells.(140) Synthesis takes at least an hour and scanning cannot be performed until 2 hours after injection to provide adequate time for washout of unbound tracer.(140;141) Uptake of 18F-FMISO PET was detected in the periphery and surrounding tissue of infarcts in 69% of patients studied within 48 hours and in no patient studied 6 to 11 days after stroke onset, including those who had positive early studies (142). Uptake of 18F-FMISO has been demonstrated to shift from the eventual infarct core (in patients studied <6 hours after stroke onset) to the periphery and surrounding tissue (in patients studied 6 to 48 hours after stroke onset). Over time, the amount of hypoxic tissue declines. When imaged within 6 hours of stroke onset, about 90% of the region of 18F-FMISO is included in the eventual infarct whereas this percentage falls to 50% by 16 hours.(141;143) Clinical correlations exist between the volume of initially affected tissue and initial severity of the neurological deficit and between the proportion of initially affected tissue progressing to infarction and neurological deterioration during the first week after stroke.(143) During 2 hour transient MCA occlusion in the rat, the area of 18F-FMISO uptake is much larger than the area of subsequent infarction, but a small area of infarction equal to 10–15% of the area of uptake still occurs.(144) Since a variable portion of the tissue detected by 18F-FMISO uptake does not go on to infarct if untreated (over 50% more than 16 hours after stroke onset), 18F-FMISO does not accurately identify preventable infarction. The best interpretation for these data is that the degree of hypoxia necessary for 18F-FMISO binding is less than the degree that leads to cell death.
11C-flumazenil (11C-FMZ) is a central benzodiazepine receptor radioligand that binds to gamma-aminobutyric acid (GABA) receptors on synapses of cortical neurons.(145) Since GABA receptors are sensitive to ischemia (146), reduction of 11C-FMZ uptake has been used to provide an early indication of neuronal damage.(146) A major limitation of the 11C-FMZ technique is that the low or negligible densities of central benzodiazepine receptors in subcortical gray and white matter restrict its ability to detect tissue destruction in these regions.(147) Synthesis takes at least one hour and scanning takes one hour. In clinical 11C-FMZ PET studies performed within 16 hours of stroke onset, decreased 11C-FMZ binding was seen in areas of markedly decreased CMRO2 despite a wide range of OEF values. 11C-FMZ binding predicted final tissue status on late CT with a sensitivity of 84% and a specificity of 85%.(148) However, acute studies in the cat demonstrated that decreased 11C-FMZ binding consistently underestimated the volume of subsequent tissue infarction.(149) In both tPA-treated and untreated patients, 11C-FMZ binding > 5.5 times contralateral white matter (CWM) is 95% predictive of late tissue survival, 11C-FMZ binding < 3.4 times CWM is 95% predictive of late tissue death and 3.4 – 5.5 times CWM is indeterminate. Combining with CBF measurements to improve the predictive value shows that 11C-FMZ binding > 3.4 times CWM and CBF < 50% of contralateral hemisphere identifies tissue all of which will survive with thrombolysis < 3 hrs, but that 80% will also survive if untreated.(2;148;150). Thus, 11C-FMZ performs better than 18F-FMISO, but still falls short at accurately identifying preventable infarction. Thresholds for 95% prediction of tissue death and survival can be derived as can accurate predictions of tissue survival with treatment. However, the fate of tissue with 11C-FMZ binding between 3.4 – 5.5 times CWM is indeterminate. Most of the tissue with low CBF and high 11C-FMZ binding that survives if treated will also survive when untreated.
Defining cells that are already dead or irreversibly damaged involves determination of thresholds for CBF and/or CMRO2 below which spontaneous tissue survivability does not occur. Measurements of CBF alone perform poorly because of the importance of both magnitude and duration in determining cell death, the variable response of different cells and the occurrence of high CBF in dead tissue (see above). (121;151;152) Thresholds for cell death based on early measurement of CMRO2 have been shown to be more reliable. CMRO2 thresholds for infarction have been reported from 0.87–1.7 mL 100g−1 min−1.(110;151;153;154) Identification of areas of preventable infarction by measurements of CBF and metabolism is much more difficult. Because tissue regions demonstrating increased OEF represent areas with reduced blood supply relative to oxygen demand but still with metabolically active cells, OEF has received much attention as the factor capable of predicting tissue viability, but it has been shown to be a poor predictor of tissue outcome.(105;121;152;155) The combination of CMRO2 > 40–60% of normal and CBF < 40–60% of normal has been shown to accurately identify areas of the brain that will go on to infarct if untreated and live if successfully reperfused. Usually, when both CBF and CMRO2 are above these levels the tissue survives and when both are below these levels the tissue dies. (105–107;110;151;152;154–156) These data represent a mix from humans and non-human primates with minimal human reperfusion data. All these attempts to determine thresholds suffer from a variety of technical problems including small numbers of subjects, poor spatial resolution, lack of co-registration to CT, and poor counting statistics. Further human reperfusion studies are needed to demonstrate reliability of these criteria for identifying preventable infarction based on combined CBF and CMRO2 in clinically heterogeneous patient populations.
CAROTID ARTERY ATHEROSCLEROSIS
Imaging of carotid atherosclerosis with 18F-fluorodeoxyglucose (18F-FDG) has demonstrated that plaques show varying levels of 18F-FDG uptake. (157;158) The degree of uptake corresponds to pathological evidence of active inflammation by macrophage infiltration.(159–161) The clinical relevance of these findings is still under investigation.(159;160;162)
REMOTE METABOLIC EFFECTS OF CEREBRAL INFARCTION
A common finding from PET studies of stroke is the presence of reduced blood flow and metabolism in brain regions distant from the site of infarction that appear normal on CT or MRI. Remote hypometabolism has been demonstrated for both oxygen consumption(116;163–165) and glucose utilization.(166;167) Metabolic values at these distant sites always remain greater than those within the ischemic core.(112;166;167) CBF is reduced slightly more than metabolism, resulting in a slight increase in OEF.(168;169) Distinguished from “misery perfusion,” this situation has been interpreted to represent primary metabolic depression with secondary reduction in perfusion.
The best-described remote metabolic effect of ischemia is contralateral cerebellar hypometabolism (“crossed cerebellar diaschisis”), which occurs in about 50% of patients with hemispheric lesions (Figure 7).(165;170) Several factors have been reported to influence its occurrence, though data are not consistent across studies. Such hypometabolism may be more profound with greater volumes of hemispheric hypoperfusion, (171) deep MCA infarcts,(165) those involving the frontal(164) or parietal lobes,(116) and those encompassing more than one lobe.(165;167;172) Although Lenzi et al(116) found that “crossed cerebellar diaschisis was not evident in cases in which the dimensions of the infarct were small,” Martin and Raichle(164) reported no relationship to infarct size. Cerebellar hypometabolism has been shown to correlate with the presence of,(119) but likely not the severity of, hemiparesis.(164) It also occurs in some patients having no motor deficit.(165;167) Reduction of CMRglc is greater than that of CMRO2 in chronic stroke (4 to 46 months), indicating an uncoupling of oxygen consumption and glucose utilization.(173)
Figure 7.
Crossed cerebellar diaschisis 5 months after a left frontal infarct. Tomographic slices through the posterior fossa demonstrate reduced cerebral blood flow (CBF, mL 100g−1 min−1) and cerebral metabolic rate of oxygen (CMRO2, mL 100g−1 min−1) in the right cerebellum. Oxygen extraction fraction (OEF) looks relatively uniform although it is usually found to be slightly elevated. In all images, the right side of the brain is on the reader’s right.
Reduction in blood flow and metabolism in the hemisphere contralateral to cerebral infarction has also been described for both the homologous cortical area and for the whole hemisphere.(116;174;175) Wise et al(176) found that while patients with recent infarction had lower contralateral CMRO2 compared to normal control subjects, this difference vanished when the comparison group consisted of subjects with extracranial cerebrovascular disease but without previous cerebral infarction. Non-human primate models of cerebral ischemia have not revealed evidence for contralateral hemispheric hypometabolism either acutely(108) or at delayed measurement (> 2 weeks).(155)
Ipsilateral cerebral hypometabolism has been observed in the cortex overlying subcortical stroke and in the basal ganglia, thalamus, and distant sites in the cortex after cortical stroke,(166;174;177;178) likely occurring in a delayed fashion (beyond 18 hours after clinical onset).(179) This “intrahemispheric remote hypometabolism” is most frequently described with thalamic lesions.(166;180;181)
These areas of remote hypometabolism are typically ascribed to a decrease in neuronal activity caused by interruption of afferent or efferent fiber pathways by the ischemic lesion, a phenomenon often termed diaschisis.(163) This term is not strictly accurate though, because diaschisis refers to an acute and reversible functional depression at sites distant from but connected with the site of injury,(182) whereas the remote effects of ischemia are often stable for months(164;183) and may be permanent. Trans-synaptic neuronal degeneration has been proposed as an alternate explanation for the remote hypometabolism(165) and is supported by the fact that contralateral CMRO2 often declines between acute and chronic studies,(184) but this is unlikely to account for all cases since hypometabolism can be seen within hours of stroke.(170;171) In the hemispheres distal to occluded carotid arteries, regions of reduced metabolism show evidence of reduced central benzodiazepine receptors consistent with selective neuronal damage.(82;185)
The clinical correlate of these remote changes is unclear. Single case reports have suggested an association with focal neurological deficits, including ataxia,(186;187) aphasia,(188;189) neglect,(190) and hemianopia,(174) but larger series of infarcts at various locations have revealed no such relationships.(84;165) In one study, stepwise regression analysis revealed that language performance mainly depended on parieto-temporal metabolism irrespective of infarct location.(191) Similarly, the relationship between remote metabolic effects seen acutely after stroke and eventual clinical outcome is uncertain. Widespread metabolic disruption was a poor indicator of neurological outcome (disability at 2 weeks to 3 months) regardless of CT findings in one study.(192) In another, metabolism in structurally normal ipsilateral mesial-prefrontal tissue at 5 to 18 hours after MCA stroke was predictive of neurological status at 3 weeks.(179) Furthermore, glucose metabolism in the left hemisphere 2 to 3 weeks after left MCA stroke predicted both short-term (4 months) and long-term (2 year) recovery from aphasia.(193;194) The degree of acute crossed cerebellar hypometabolism did not correlate with the degree of later recovery in one study whereas in another it did.(170;171)
VASCULAR DEMENTIA
Vascular dementia remains an elusive entity. There are no agreed upon clinical diagnostic criteria and the correspondence between the clinical diagnosis and pathology is poor. (195–197). The situation is further complicated by the common pathological occurrence of both Alzheimer’s disease and cerebrovascular disease and their synergy in producing clinical dementia.(198) These cautions must be born in mind in interpreting PET studies of vascular dementia, none of which have been based on pathological diagnoses. These studies have primarily evaluated changes in CBF and CMRO2 and, in some cases, used OEF to distinguish between ongoing active ischemia (high OEF) and permanent ischemic damage (normal or low OEF). Frackowiak and colleagues reported reduced CBF and CMRO2 and normal OEF in nine subjects with vascular dementia and concluded that there was no evidence to support the existence of a chronic ischemic brain syndrome.(199) Similar findings were reported for patients with dementia associated with large cerebral infarcts.(200) Most of the other PET studies of vascular dementia have concentrated on patients with leukoaraiosis, the deep white matter abnormalities seen as hyperintensities on T2-MRI and hypodensities on CT.(201;202) These abnormalities are associated with age-related cognitive decline.(202;203) Patients with leukoaraiosis have decreases CBF and CMRO2 in both abnormal white matter and overlying gray matter with the degree of reduction paralleling the severity of the white matter abnormalities and the degree of dementia. Both increased and normal OEF have been reported, leaving the issue of chronic ischemia unresolved.(200;204–207)Ihara and colleagues have reported decreased cortical binding of 11C-FMZ in patients with leukoaraiosis and dementia suggesting that the white matter damage causes cortical neuronal injury.(207)
INTRACEREBRAL HEMORRHAGE
Investigations of CBF and metabolic rate in intracerebral hemorrhage (ICH) have been less extensive than those in ischemic stroke. These have focused on the zone of tissue immediately surrounding the clot. Reduced CBF, determined by autoradiography or SPECT, has been demonstrated in this area in experimental models of ICH(208;209) and in patients with ICH,(210) but not always.(211;212) This reduction in CBF is often attributed to cerebral ischemia due to mechanical compression of the microvasculature surrounding the clot.(208;213) As in ischemic stroke, PET and SPECT studies of ICH suffer from the effect of partial volume averaging, which may cause regions of normal flow to appear reduced depending upon image resolution and the proximity to non-perfused tissue.(214;215) Unlike in ischemic stroke, a validated method exists permitting the correction for partial volume effects in ICH.(216) Using this method, a zone of hypoperfusion is still evident surrounding acute ICH.(216;217) In 19 patients studied 5 to 22 hours after symptom onset, Zazulia et al found that peri-clot CMRO2 was reduced to a greater degree than CBF, resulting in decreased OEF rather than the increased OEF that occurs in ischemia (Figure 8). (217) This pattern was suggestive of a primary metabolic depression, consistent with a subsequent report of peri-hematomal mitochondrial dysfunction. (218). In 14 hypertensive patients with small to medium sized acute hemorrhages studied within 24 hours of onset, lowering mean arterial pressure by 17% from 143 ± 10 to 119 ± 11 mm Hg did not produce any significant change in CBF in the peri-hematomal region or in the brain as a whole.(219)
Figure 8.
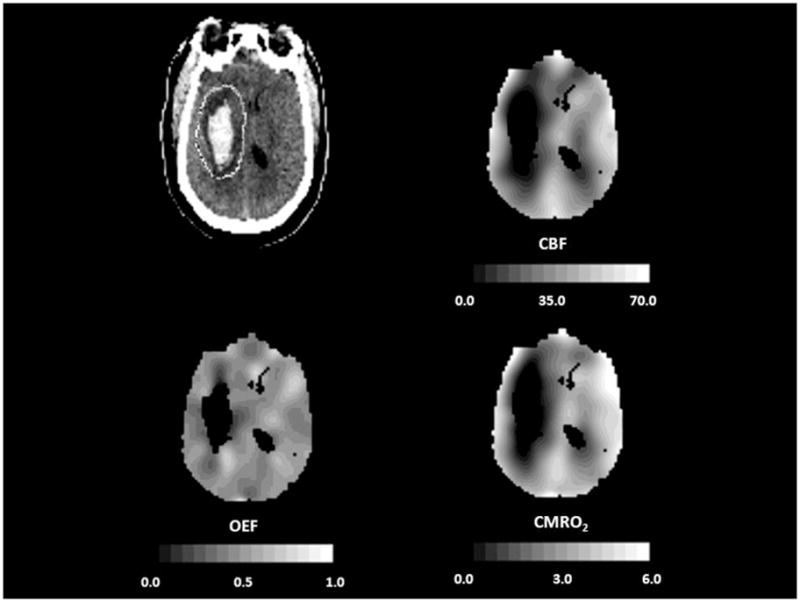
PET images corrected for partial volume effects from a 44-year old man with a putaminal hemorrhage studied 21 hours after onset. Peri-hematomal cerebral blood flow (CBF, mL 100g−1 min−1), cerebral metabolic rate of oxygen (CMRO2, mL 100g−1 min−1) and oxygen extraction fraction (OEF) are all reduced compared to the contralateral hemisphere, indicating primary metabolic depression. Adapted from Powers WJ, Zazulia AR. The use of positron emission tomography in cerebrovascular disease. Neuroimaging Clin N Am 2003; 13: 741–758.
Transient focal increases in glucose metabolism in the peri-hematomal region that occur 2–4 days after ICH have been described in 6 of 13 patients studied in the first week following ICH. These were resolving or had returned to baseline on repeat scans at 5–8 days (Figure 9). (220) These focal increases are strikingly similar to foci of hyperglycolysis observed following traumatic brain injury.(221;222) While the pathophysiological basis for these metabolic changes remains to be determined, they may be indicative of ongoing injury that is amenable to intervention that will improve outcome.(223) Remote hypometabolism in structurally intact brain regions, similar to that found with cerebral infarcts, is also seen in patients with ICH.(224;225)
Figure 9.
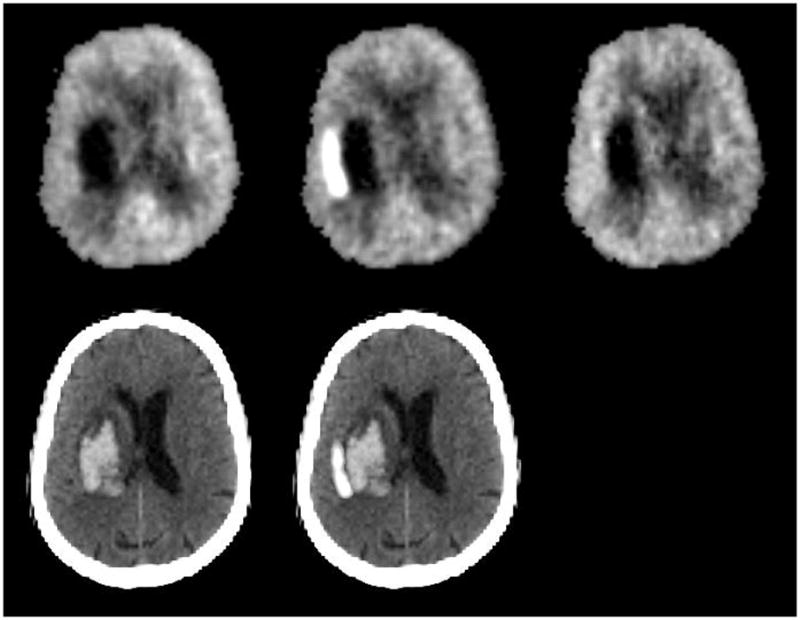
18F-fluorordeoxyglucose PET images from a 72-year-old woman with left putaminal hemorrhage studied 26 hours (top left), 2.2 days (top center), and 4.9 days (top right) after onset. Images are normalized to mean activity in the initial scan. Bottom row shows initial CT (left) and the subtraction image of the first two PET studies superimposed on the CT, demonstrating the region of increased glucose metabolism adjacent to the hematoma.
ANEURYSMAL SUBARACHNOID HEMORRHAGE
Several PET studies performed within the first few days after aneurysm rupture have investigated the effects of subarachnoid hemorrhage (SAH) before vasospasm occurs. In one series of patients who had not undergone surgery and who did not have evidence for vasospasm, hydrocephalus, or ICH, there was a significant reduction in global CMRO2 and CBF with normal OEF that did not correlate to the use of sedative drugs when they were studied 1 to 4 days after aneurysmal SAH.(226) This was interpreted by the authors as indicating that the initial aneurysm rupture produced a primary reduction in metabolism at this stage and the reduction in CBF occurred secondary to reduced metabolic demands. Another case series of 7 unsedated patients studied within the first 48 hours showed non-significant trends for a reduction in CBF and CMRO2 and an increase in OEF. The authors did not posit a causal relationship. (227)
Vasospasm, defined as segmental or diffuse narrowing of the large arteries at the base of the brain, can be detected angiographically in up to 70% of patients beginning at 4–12 days after aneurysm rupture.(228–230) Depression of CBF and CMRO2 has been reported by several investigators with OEF variably described as normal or elevated.(231–237) Reduced metabolism with normal OEF has been interpreted as evidence for non-ischemic primary metabolic depression with vasospasm as a secondary response to reduced metabolic demand. However, since OEF returns to normal within several hours or at most a few days after cerebral infarction, the findings of normal OEF with reduced CBF and CMRO2 cannot be used to discard ischemic infarction as a cause for reduced metabolism in SAH-induced vasospasm. Consistent with subacute cerebral infarction in which OEF had returned to normal, some investigators who have demonstrated reduced CBF and CMRO2 with no change in OEF report subsequent cerebral infarction or moderate to severe disability in the majority of the patients. (234;235) To investigate whether large artery vasospasm causes ischemia without the confounding effects of subacute infarction, Carpenter and colleagues studied a group of patients with vasospasm who did not develop subsequent infarction.(226) CBF was decreased, CMRO2 was normal, and OEF was increased, consistent with ischemia (Figure 10).(226) With resolution of vasospasm, CBF increased.(236)
Figure 10.

PET study of a 54-year old woman who developed left hemiparesis due to vasospasm 9 days after subarachnoid hemorrhage. Right hemispheric cerebral blood flow (CBF, mL 100g−1 min−1) is reduced more than the cerebral metabolic rate of oxygen (CMRO2, mL 100g−1 min−1) and oxygen extraction fraction (OEF) is increased, indicative of ischemia. In all images, the right side of the brain is on the reader’s right. Adapted from Powers WJ, Zazulia AR. The use of positron emission tomography in cerebrovascular disease. Neuroimaging Clin N Am 2003; 13: 741–758.
Studies of CBV in patients with SAH likewise have yielded conflicting results. In a non-PET study using oxygen-15 radiotracers, Grubb and co-workers(233) reported a statistically significant increase in CBV in Hunt and Hess grade III–IV patients with angiographic vasospasm when compared to normal volunteers. OEF values were not reported, but examination of the CBF and CMRO2 data indicates that OEF was probably not increased in the patients with vasospasm as compared to those without. In a PET study of SAH, Hino and associates reported a significant increase in CBV in regions of symptomatic angiographic vasospasm.(234) They did not, however, observe an elevation in regional OEF. In another PET study, patients with carotid artery occlusion were compared to those with SAH.(238) Regional OEF was higher both during vasospasm and distal to carotid occlusion than in SAH without vasospasm or in normal volunteers. Regional CBV was reduced compared to normal in regions with and without spasm, whereas it was increased ipsilateral to carotid occlusion. These findings of reduced CBV during vasospasm under similar conditions of tissue ischemia (increased OEF) that produce increased CBV in patients with carotid occlusion were interpreted as evidence that parenchymal vessels distal to arteries with angiographic spasm following SAH do not demonstrate normal autoregulatory vasodilation. The reason for the discrepancies among these studies in the measurement of CBV during vasospasm is not clear but it may reflect the variability of CBV changes during reduced CPP noted earlier.(72)
Surgical retraction may have profound effects on cerebral metabolism. A small PET study before and after right fronto-temporal craniotomies for clipping of ruptured anterior circulation aneurysms showed a 45% reduction in regional CMRO2 and 32% reduction in regional OEF without significant change in CBF in the region of retraction, but no change in the opposite hemisphere.(239) These changes indicate a primary reduction in metabolism and uncoupling of flow and metabolism (luxury perfusion). They are not suggestive of vasospasm since vasospasm produces diffuse changes respecting large vascular territories whereas these changes were focal in the area of retractor blade placement. Another study showed similar reductions in CMRglc in the area of retraction.(240)
CONCLUSIONS
Measurements of CBF and CMR in ischemia and infarction have provided valuable insight into the pathophysiology of cerebrovascular disease. Much has been learned about the compensatory responses of the brain to reductions in perfusion pressure and in the evolution of changes in blood flow and metabolism that occur when these mechanisms fail. Knowledge of these changes can help guide therapy when multiple factors such as ischemia, hypoxemia, hypocarbia, or hypotension may be affecting cerebral blood flow. Understanding the hemodynamic effects of arterial stenosis or occlusion on the downstream perfusion pressure has been instrumental in designing new trials for treatment.(94) In acute ischemic stroke, measurements of CBF and metabolism have been used to define the “ischemic penumbra” and to predict both tissue and clinical outcome, although the clinical utility of these markers of ischemia in distinguishing viable from irreversibly damaged tissue in the acute period still requires further study.
Blood flow and metabolic studies in ICH have documented the integrity of autoregulation and suggested that hematomas exert a primary depression of metabolism rather than inducing ischemia in the surrounding tissue. This has important implications for future consideration of therapeutic interventions in this disease. Studies in SAH have differentiated the primary effects of the hemorrhage on cerebral hemodynamics and metabolism from those of vasospasm and surgical retraction. In addition, vasospasm-induced ischemia has been demonstrated to be reversible.
In summary, defining the pathophysiological changes in CBF and metabolism in human cerebrovascular disease has provided and will continue to provide the basic foundation for development and testing of new treatment strategies.
Acknowledgments
This work was supported by USPHS grants NS06833, NS35966, NS044885 and NS42167 and the H. Houston Merritt Distinuished Professorship at the University of North Carolina School of Medicine
Footnotes
NOTE: None of the PET radiopharmaceuticals mentioned in this article is FDA-approved for use in patients with cerebrovascular disease.
Publisher's Disclaimer: This is a PDF file of an unedited manuscript that has been accepted for publication. As a service to our customers we are providing this early version of the manuscript. The manuscript will undergo copyediting, typesetting, and review of the resulting proof before it is published in its final citable form. Please note that during the production process errors may be discovered which could affect the content, and all legal disclaimers that apply to the journal pertain.
REFERENCE LIST
- 1.Derdeyn CP, Videen TO, Simmons NR, Yundt KD, Fritsch SM, Grubb RL, et al. Count-based PET method for predicting ischemic stroke in patients with symptomatic carotid arterial occlusion. Radiology. 1999;212(2):499–506. doi: 10.1148/radiology.212.2.r99au27499. [DOI] [PubMed] [Google Scholar]
- 2.Heiss WD, Kracht L, Grond M, Rudolf J, Bauer B, Wienhard K, et al. Early [(11)C]Flumazenil/H(2)O positron emission tomography predicts irreversible ischemic cortical damage in stroke patients receiving acute thrombolytic therapy. Stroke. 2000;31(2):366–369. doi: 10.1161/01.str.31.2.366. [DOI] [PubMed] [Google Scholar]
- 3.Siesjo BK. Brain Energy Metabolism. New York: John Wiley and Sons; 1978. [Google Scholar]
- 4.Rossen R, Kabat H, Anderson JP. Acute arrest of cerebral circulation in man. Arch Neurol Psychiatry. 1943;50:510–528. [Google Scholar]
- 5.Cohen PJ, Alexander SC, Smith TC, Reivich M, Wollman H. Effects of hypoxia and normocarbia on cerebral blood flow and metabolism in conscious man. J Appl Physiol. 1967;23(2):183–189. doi: 10.1152/jappl.1967.23.2.183. [DOI] [PubMed] [Google Scholar]
- 6.Madsen PL, Holm S, Herning M, Lassen NA. Average blood flow and oxygen uptake in the human brain during resting wakefulness: A critical appraisal of the Kety-Schmidt technique. J Cereb Blood Flow Metab. 1993;13:646–655. doi: 10.1038/jcbfm.1993.83. [DOI] [PubMed] [Google Scholar]
- 7.Gottstein U, Bernsmeier A, Sedlmeyer I. Der Kohlenhydratstoffweehsel des menschlichen Gehirns bei Schlafmittelvergiftung. Klin Wschr. 1963;41:943–948. doi: 10.1007/BF01478536. [DOI] [PubMed] [Google Scholar]
- 8.Scheinberg P, Stead EA. The cerebral blood flow in male subjects as measured by the nitrous oxide technique: normal values for blood flow, oxygen utilization, glucose utilization and peripheral resistance, with observations on the effect of tilting and anxiety. J Clin Invest. 1949;28:1163–1171. doi: 10.1172/JCI102150. [DOI] [PMC free article] [PubMed] [Google Scholar]
- 9.Glenn TC, Kelly DF, Boscardin WJ, McArthur DL, Vespa P, Oertel M, et al. Energy dysfunction as a predictor of outcome after moderate or severe head injury: indices of oxygen, glucose, and lactate metabolism. J Cereb Blood Flow Metab. 2003;23(10):1239–1250. doi: 10.1097/01.WCB.0000089833.23606.7F. [DOI] [PubMed] [Google Scholar]
- 10.McHenry LC, Jr, Merory J, Bass E, Stump DA, Williams R, Witcofski R, et al. Xenon-133 inhalation method for regional cerebral blood flow measurements: normal values and test-retest results. Stroke. 1978;9(4):396–399. doi: 10.1161/01.str.9.4.396. [DOI] [PubMed] [Google Scholar]
- 11.Sette G, Baron JC, Mazoyer B, Levasseur M, Pappata S, Crouzel C. Local brain haemodynamics and oxygen metabolism in cerebrovascular disease. Positron emission tomography. Brain. 1989;112 (Pt 4):931–951. doi: 10.1093/brain/112.4.931. [DOI] [PubMed] [Google Scholar]
- 12.Baron JC, Rougemont D, Soussaline F, Bustany P, Crouzel C, Bousser MG, et al. Local interrelationships of cerebral oxygen consumption and glucose utilization in normal subjects and in ischemic stroke patients: a positron tomography study. J Cereb Blood Flow Metab. 1984;4(2):140–149. doi: 10.1038/jcbfm.1984.22. [DOI] [PubMed] [Google Scholar]
- 13.Lebrun-Grandie P, Baron JC, Soussaline F, Loch’h C, Sastre J, Bousser MG. Coupling between regional blood flow and oxygen utilization in the normal human brain. A study with positron tomography and oxygen 15. Arch Neurol. 1983;40(4):230–236. doi: 10.1001/archneur.1983.04050040060010. [DOI] [PubMed] [Google Scholar]
- 14.Leenders KL, Perani D, Lammertsma AA, Heather JD, Buckingham P, Healy MJ, et al. Cerebral blood flow, blood volume and oxygen utilization. Normal values and effect of age. Brain. 1990;113 (Pt 1):27–47. doi: 10.1093/brain/113.1.27. [DOI] [PubMed] [Google Scholar]
- 15.Kety SS. Human cerebral blood flow and oxygen consumption as related to aging. J Chron Dis. 1956;3:478–486. doi: 10.1016/0021-9681(56)90146-1. [DOI] [PubMed] [Google Scholar]
- 16.Pantano P, Baron JC, Lebrun-Grandie P, Duquesnoy N, Bousser MG, Comar D. Regional cerebral blood flow and oxygen consumption in human aging. Stroke. 1984;15(4):635–641. doi: 10.1161/01.str.15.4.635. [DOI] [PubMed] [Google Scholar]
- 17.Dastur DK. Cerebral blood flow and metabolism in normal human aging, pathological aging, and senile dementia. J Cereb Blood Flow Metab. 1985;5(1):1–9. doi: 10.1038/jcbfm.1985.1. [DOI] [PubMed] [Google Scholar]
- 18.Kuhl DE, Metter EJ, Riege WH, Hawkins RA. The effect of normal aging on patterns of local cerebral glucose utilization. Ann Neurol. 1984;15 (Suppl):S133–S137. doi: 10.1002/ana.410150726. [DOI] [PubMed] [Google Scholar]
- 19.Marchal G, Rioux P, Petit-Taboue MC, Sette G, Travere JM, Le Poec C, et al. Regional cerebral oxygen consumption, blood flow, and blood volume in healthy human aging. Arch Neurol. 1992;49(10):1013–1020. doi: 10.1001/archneur.1992.00530340029014. [DOI] [PubMed] [Google Scholar]
- 20.Yamaguchi T, Kanno I, Uemura K, Shishido F, Inugami A, Ogawa T, et al. Reduction in regional cerebral metabolic rate of oxygen during human aging. Stroke. 1986;17(6):1220–1228. doi: 10.1161/01.str.17.6.1220. [DOI] [PubMed] [Google Scholar]
- 21.de Leon MJ, George AE, Ferris SH, Christman DR, Fowler JS, Gentes CI, et al. Positron emission tomography and computed tomography assessments of the aging human brain. J Comput Assist Tomogr. 1984;8(1):88–94. doi: 10.1097/00004728-198402000-00017. [DOI] [PubMed] [Google Scholar]
- 22.Duara R, Margolin RA, Robertson-Tchabo EA, London ED, Schwartz M, Renfrew JW, et al. Cerebral glucose utilization, as measured with positron emission tomography in 21 resting healthy men between the ages of 21 and 83 years. Brain. 1983;106 (Pt 3):761–775. doi: 10.1093/brain/106.3.761. [DOI] [PubMed] [Google Scholar]
- 23.Duara R, Grady C, Haxby J, Ingvar D, Sokoloff L, Margolin RA, et al. Human brain glucose utilization and cognitive function in relation to age. Ann Neurol. 1984;16(6):703–713. doi: 10.1002/ana.410160613. [DOI] [PubMed] [Google Scholar]
- 24.Yoshii F, Barker WW, Chang JY, Loewenstein D, Apicella A, Smith D, et al. Sensitivity of cerebral glucose metabolism to age, gender, brain volume, brain atrophy, and cerebrovascular risk factors. J Cereb Blood Flow Metab. 1988;8(5):654–661. doi: 10.1038/jcbfm.1988.112. [DOI] [PubMed] [Google Scholar]
- 25.Meltzer CC, Cantwell MN, Greer PJ, Ben Eliezer D, Smith G, Frank G, et al. Does cerebral blood flow decline in healthy aging? A PET study with partial-volume correction. J Nucl Med. 2000;41(11):1842–1848. [PubMed] [Google Scholar]
- 26.Ibanez V, Pietrini P, Furey ML, Alexander GE, Millet P, Bokde AL, et al. Resting state brain glucose metabolism is not reduced in normotensive healthy men during aging, after correction for brain atrophy. Brain Res Bull. 2004;63(2):147–154. doi: 10.1016/j.brainresbull.2004.02.003. [DOI] [PubMed] [Google Scholar]
- 27.Astrup J, Sorensen PM, Sorensen HR. Oxygen and glucose consumption related to Na+-K+ transport in canine brain. Stroke. 1981;12(6):726–730. doi: 10.1161/01.str.12.6.726. [DOI] [PubMed] [Google Scholar]
- 28.Bering EAJ, Taren JA, McMurrrey JD, Bernhard WF. Studies on hypothermia in monkeys. II. The effect of hypothermia on the general physiology and cerebral metabolism of monkeys in the hypothermic state. Surg Gynecol Obstet. 1956;102:134–138. [PubMed] [Google Scholar]
- 29.Nilsson L, Siesjo BK. The effect of phenobarbitone anaesthesia on blood flow and oxygen consumption in the rat brain. Acta Anaesthesiol Scand Suppl. 1975;57:18–24. doi: 10.1111/j.1399-6576.1975.tb05408.x. [DOI] [PubMed] [Google Scholar]
- 30.Sokoloff L. Relationships among local functional activity, energy metabolism, and blood flow in the central nervous system. Fed Proc. 1981;40(8):2311–2316. [PubMed] [Google Scholar]
- 31.Fox PT, Raichle ME. Focal physiological uncoupling of cerebral blood flow and oxidative metabolism during somatosensory stimulation in human subjects. Proc Natl Acad Sci U S A. 1986;83(4):1140–1144. doi: 10.1073/pnas.83.4.1140. [DOI] [PMC free article] [PubMed] [Google Scholar]
- 32.Fox PT, Raichle ME, Mintun MA, Dence C. Nonoxidative glucose consumption during focal physiologic neural activity. Science. 1988;241(4864):462–464. doi: 10.1126/science.3260686. [DOI] [PubMed] [Google Scholar]
- 33.Kety SS, Schmidt CF. The effects of active and passive hyperventilation on cerebral blood flow, cerebral oxygen consumption, cardiac output, and blood pressure of normal young men. J Clin Invest. 1946;25:107–119. [PubMed] [Google Scholar]
- 34.Kety SS, Schmidt CF. The effects of altered arterial tensions of carbon dioxide and oxygen on cerebral blood flow and cerebral oxygen consumption of normal young men. J Clin Invest. 1948;27:484–492. doi: 10.1172/JCI101995. [DOI] [PMC free article] [PubMed] [Google Scholar]
- 35.Wollman H, Smith TC, Stephen GW, Colton ET, III, Gleaton HE, Alexander SC. Effects of extremes of respiratory and metabolic alkalosis on cerebral blood flow in man. J Appl Physiol. 1968;24(1):60–65. doi: 10.1152/jappl.1968.24.1.60. [DOI] [PubMed] [Google Scholar]
- 36.Fencl V, Vale JR, Broch JA. Respiration and cerebral blood flow in metabolic acidosis and alkalosis in humans. J Appl Physiol. 1969;27(1):67–76. doi: 10.1152/jappl.1969.27.1.67. [DOI] [PubMed] [Google Scholar]
- 37.Raichle ME, Posner JB, Plum F. Cerebral blood flow during and after hyperventilation. Arch Neurol. 1970;23(5):394–403. doi: 10.1001/archneur.1970.00480290014002. [DOI] [PubMed] [Google Scholar]
- 38.Alexander SC, Smith TC, Strobel G, Stephen GW, Wollman H. Cerebral carbohydrate metabolism of man during respiratory and metabolic alkalosis. J Appl Physiol. 1968;24(1):66–72. doi: 10.1152/jappl.1968.24.1.66. [DOI] [PubMed] [Google Scholar]
- 39.van Rijen PC, Luyten PR, van der Sprenkel JW, Kraaier V, van Huffelen AC, Tulleken CA, et al. 1H and 31P NMR measurement of cerebral lactate, high-energy phosphate levels, and pH in humans during voluntary hyperventilation: associated EEG, capnographic, and Doppler findings. Magn Reson Med. 1989;10(2):182–193. doi: 10.1002/mrm.1910100204. [DOI] [PubMed] [Google Scholar]
- 40.Shimojyo S, Scheinberg P, Kogure K, Reinmuth OM. The effects of graded hypoxia upon transient cerebral blood flow and oxygen consumption. Neurology. 1968;18(2):127–133. doi: 10.1212/wnl.18.2.127. [DOI] [PubMed] [Google Scholar]
- 41.Buck A, Schirlo C, Jasinksy V, Weber B, Burger C, von Schulthess GK, et al. Changes of cerebral blood flow during short-term exposure to normobaric hypoxia. J Cereb Blood Flow Metab. 1998;18(8):906–910. doi: 10.1097/00004647-199808000-00011. [DOI] [PubMed] [Google Scholar]
- 42.Lassen NA. Cerebral blood flow and oxygen consumption in man. Physiol Rev. 1959;39:183–238. doi: 10.1152/physrev.1959.39.2.183. [DOI] [PubMed] [Google Scholar]
- 43.Brown MM, Wade JP, Marshall J. Fundamental importance of arterial oxygen content in the regulation of cerebral blood flow in man. Brain. 1985;108 (Pt 1):81–93. doi: 10.1093/brain/108.1.81. [DOI] [PubMed] [Google Scholar]
- 44.Lambertsen CJ, Kough RH, Cooper DY, Emmel GL, Loeschcke HH, Schmidt CF. Oxygen toxicity. Effects in man of oxygen inhalation at 1 and 3.5 atmospheres upon blood gas transport, cerebral circulation and cerebral metabolism. J Appl Physiol. 1953;5:471–486. doi: 10.1152/jappl.1953.5.9.471. [DOI] [PubMed] [Google Scholar]
- 45.Todd MM, Wu B, Maktabi M, Hindman BJ, Warner DS. Cerebral blood flow and oxygen delivery during hypoxemia and hemodilution: role of arterial oxygen content. Am J Physiol. 1994;267(5 Pt 2):H2025–H2031. doi: 10.1152/ajpheart.1994.267.5.H2025. [DOI] [PubMed] [Google Scholar]
- 46.Mintun MA, Lundstrom BN, Snyder AZ, Vlassenko AG, Shulman GL, Raichle ME. Blood flow and oxygen delivery to human brain during functional activity: theoretical modeling and experimental data. Proc Natl Acad Sci U S A. 2001;98(12):6859–6864. doi: 10.1073/pnas.111164398. [DOI] [PMC free article] [PubMed] [Google Scholar]
- 47.Thomas DJ, Marshall J, Russell RW, Wetherley-Mein G, du Boulay GH, Pearson TC, et al. Effect of haematocrit on cerebral blood-flow in man. Lancet. 1977;2(8045):941–943. doi: 10.1016/s0140-6736(77)90885-6. [DOI] [PubMed] [Google Scholar]
- 48.Brown MM, Marshall J. Regulation of cerebral blood flow in response to changes in blood viscosity. Lancet. 1985;1(8429):604–609. doi: 10.1016/s0140-6736(85)92145-2. [DOI] [PubMed] [Google Scholar]
- 49.Brown MM, Marshall J. Effect of plasma exchange on blood viscosity and cerebral blood flow. Br Med J (Clin Res Ed) 1982;284(6331):1733–1736. doi: 10.1136/bmj.284.6331.1733. [DOI] [PMC free article] [PubMed] [Google Scholar]
- 50.Paulson OB, Parving HH, Olesen J, Skinhoj E. Influence of carbon monoxide and of hemodilution on cerebral blood flow and blood gases in man. J Appl Physiol. 1973;35(1):111–116. doi: 10.1152/jappl.1973.35.1.111. [DOI] [PubMed] [Google Scholar]
- 51.Hino A, Ueda S, Mizukawa N, Imahori Y, Tenjin H. Effect of hemodilution on cerebral hemodynamics and oxygen metabolism. Stroke. 1992;23(3):423–426. doi: 10.1161/01.str.23.3.423. [DOI] [PubMed] [Google Scholar]
- 52.Rebel A, Lenz C, Krieter H, Waschke KF, Van Ackern K, Kuschinsky W. Oxygen delivery at high blood viscosity and decreased arterial oxygen content to brains of conscious rats. Am J Physiol Heart Circ Physiol. 2001;280(6):H2591–H2597. doi: 10.1152/ajpheart.2001.280.6.H2591. [DOI] [PubMed] [Google Scholar]
- 53.MacKenzie ET, Farrar JK, Fitch W, Graham DI, Gregory PC, Harper AM. Effects of hemorrhagic hypotension on the cerebral circulation. I. Cerebral blood flow and pial arteriolar caliber. Stroke. 1979;10(6):711–718. doi: 10.1161/01.str.10.6.711. [DOI] [PubMed] [Google Scholar]
- 54.Symon L, Pasztor E, Dorsch NW, Branston NM. Physiological responses of local areas of the cerebral circulation in experimental primates determined by the method of hydrogen clearance. Stroke. 1973;4(4):632–642. doi: 10.1161/01.str.4.4.632. [DOI] [PubMed] [Google Scholar]
- 55.Strandgaard S. Autoregulation of cerebral blood flow in hypertensive patients. The modifying influence of prolonged antihypertensive treatment on the tolerance to acute, drug-induced hypotension. Circulation. 1976;53(4):720–727. doi: 10.1161/01.cir.53.4.720. [DOI] [PubMed] [Google Scholar]
- 56.Schmidt JF, Waldemar G, Vorstrup S, Andersen AR, Gjerris F, Paulson OB. Computerized analysis of cerebral blood flow autoregulation in humans: validation of a method for pharmacologic studies. J Cardiovasc Pharmacol. 1990;15(6):983–988. doi: 10.1097/00005344-199006000-00017. [DOI] [PubMed] [Google Scholar]
- 57.Strandgaard S, Olesen J, Skinhoj E, Lassen NA. Autoregulation of brain circulation in severe arterial hypertension. Br Med J. 1973;1(852):507–510. doi: 10.1136/bmj.1.5852.507. [DOI] [PMC free article] [PubMed] [Google Scholar]
- 58.Powers WJ. Cerebral hemodynamics in ischemic cerebrovascular disease. Ann Neurol. 1991;29(3):231–240. doi: 10.1002/ana.410290302. [DOI] [PubMed] [Google Scholar]
- 59.Schumann P, Touzani O, Young AR, Morello R, Baron JC, MacKenzie ET. Evaluation of the ratio of cerebral blood flow to cerebral blood volume as an index of local cerebral perfusion pressure. Brain. 1998;121 (Pt 7):1369–1379. doi: 10.1093/brain/121.7.1369. [DOI] [PubMed] [Google Scholar]
- 60.Maruyama M, Shimoji K, Ichikawa T, Hashiba M, Naito E. The effects of extreme hemodilutions on the autoregulation of cerebral blood flow, electroencephalogram and cerebral metabolic rate of oxygen in the dog. Stroke. 1985;16(4):675–679. doi: 10.1161/01.str.16.4.675. [DOI] [PubMed] [Google Scholar]
- 61.Haggendal E, Johansson B. Effect of arterial carbon dioxide tension and oxygen saturation on cerebral blood flow autoregulation in dogs. Acta Physiol Scand. 1965;66:27–53. doi: 10.1111/j.1748-1716.1965.tb03234.x. [DOI] [PubMed] [Google Scholar]
- 62.Wiedeman MP. Dimensions of blood vessels from distributing artery to collecting vein. Cicrulation Research. 1963;12:375–378. doi: 10.1161/01.res.12.4.375. [DOI] [PubMed] [Google Scholar]
- 63.Hilal SK. Cerebral hemodynamics assessed by angiography. In: Newton TH, Potts DG, editors. St. Louis: C.V. Mosby Company; 1974. [Google Scholar]
- 64.Auer LM, Ishiyama N, Pucher R. Cerebrovascular response to intracranial hypertension. Acta Neurochir (Wien) 1987;84(3–4):124–128. doi: 10.1007/BF01418837. [DOI] [PubMed] [Google Scholar]
- 65.Kato Y, Auer LM. Cerebrovascular response to elevation of ventricular pressure. Acta Neurochir (Wien) 1989;98(3–4):184–188. doi: 10.1007/BF01407346. [DOI] [PubMed] [Google Scholar]
- 66.Fog M. Cerebral circulation. The reaction of pial arteries to a fall in blood pressure. Arch Neurol Psychiatry. 1937;37:351–364. [Google Scholar]
- 67.Wolfe HG, Forbes HS. The cerebral circulation V. Observations of the pial circulation during changes in intracranial pressure. Arch Neurol Psychiatry. 1928;20:1035–1047. [Google Scholar]
- 68.Kato Y, Mokry M, Pucher R, Auer LM. Cerebrovascular response to changes of cerebral venous pressure and cerebrospinal fluid pressure. Acta Neurochir (Wien ) 1991;109(1–2):52–56. doi: 10.1007/BF01405698. [DOI] [PubMed] [Google Scholar]
- 69.Grubb RL, Jr, Phelps ME, Raichle ME, Ter Pogossian MM. The effects of arterial blood pressure on the regional cerebral blood volume by X-ray fluorescence. Stroke. 1973;4(3):390–399. doi: 10.1161/01.str.4.3.390. [DOI] [PubMed] [Google Scholar]
- 70.Grubb RL, Jr, Raichle ME, Phelps ME, Ratcheson RA. Effects of increased intracranial pressure on cerebral blood volume, blood flow, and oxygen utilization in monkeys. J Neurosurg. 1975;43(4):385–398. doi: 10.3171/jns.1975.43.4.0385. [DOI] [PubMed] [Google Scholar]
- 71.Ferrari M, Wilson DA, Hanley DF, Traystman RJ. Effects of graded hypotension on cerebral blood flow, blood volume, and mean transit time in dogs. Am J Physiol. 1992;262(6 Pt 2):H1908–H1914. doi: 10.1152/ajpheart.1992.262.6.H1908. [DOI] [PubMed] [Google Scholar]
- 72.Derdeyn CP, Videen TO, Yundt KD, Fritsch SM, Carpenter DA, Grubb RL, Jr, et al. Variability of cerebral blood volume and oxygen extraction: stages of cerebral hemodynamic impairment revisited. Brain. 2002;125:595–607. doi: 10.1093/brain/awf047. [DOI] [PubMed] [Google Scholar]
- 73.Gibbs JM, Wise RJ, Leenders KL, Jones T. Evaluation of cerebral perfusion reserve in patients with carotid- artery occlusion. Lancet. 1984;1(8372):310–314. doi: 10.1016/s0140-6736(84)90361-1. [DOI] [PubMed] [Google Scholar]
- 74.Powers WJ. Is the ratio of cerebral blood volume to cerebral blood flow a reliable indicator of cerebral perfusion pressure. J Cereb Blood Flow Metab. 1993;13 (suppl 1):S325. [Google Scholar]
- 75.Grubb RL, Jr, Raichle ME, Eichling JO, Ter Pogossian MM. The effects of changes in PaCO2 on cerebral blood volume, blood flow, and vascular mean transit time. Stroke. 1974;5(5):630–639. doi: 10.1161/01.str.5.5.630. [DOI] [PubMed] [Google Scholar]
- 76.Executive Committee for the Asymptomatic Carotid Atherosclerosis Study. Endarterectomy for asymptomatic carotid artery stenosis. Executive Committee for the Asymptomatic Carotid Atherosclerosis Study. JAMA. 1995;273(18):1421–1428. [PubMed] [Google Scholar]
- 77.Rothwell PM, Eliasziw M, Gutnikov SA, Fox AJ, Taylor DW, Mayberg MR, et al. Analysis of pooled data from the randomised controlled trials of endarterectomy for symptomatic carotid stenosis. Lancet. 2003;361(9352):107–116. doi: 10.1016/s0140-6736(03)12228-3. [DOI] [PubMed] [Google Scholar]
- 78.Hankey GJ, Warlow CP. Prognosis of symptomatic carotid artery occlusion. Cerebrovascular Disease. 1991;1:245–256. [Google Scholar]
- 79.Klijn CJ, van Buren PA, Kappelle LJ, Tulleken CA, Eikelboom BC, Algra A, et al. Outcome in patients with symptomatic occlusion of the internal carotid artery. Eur J Vasc Endovasc Surg. 2000;19(6):579–586. doi: 10.1053/ejvs.2000.1129. [DOI] [PubMed] [Google Scholar]
- 80.Klijn CJM, Kappelle LJ, Tulleken CAF, van Gijn J. Symptomatic carotid artery occlusion: A reappraisal of hemodynamic factors. Stroke. 1997;28:2084–2093. doi: 10.1161/01.str.28.10.2084. [DOI] [PubMed] [Google Scholar]
- 81.Derdeyn CP, Shaibani A, Moran CJ, Cross DT, III, Grubb RL, Jr, Powers WJ. Lack of correlation between pattern of collateralization and misery perfusion in patients with carotid occlusion. Stroke. 1999;30(5):1025–1032. doi: 10.1161/01.str.30.5.1025. [DOI] [PubMed] [Google Scholar]
- 82.Kuroda S, Shiga T, Ishikawa T, Houkin K, Narita T, Katoh C, et al. Reduced blood flow and preserved vasoreactivity characterize oxygen hypometabolism due to incomplete infarction in occlusive carotid artery diseases. J Nucl Med. 2004;45(6):943–949. [PubMed] [Google Scholar]
- 83.Kuroda S, Shiga T, Houkin K, Ishikawa T, Katoh C, Tamaki N, et al. Cerebral oxygen metabolism and neuronal integrity in patients with impaired vasoreactivity attributable to occlusive carotid artery disease. Stroke. 2006;37(2):393–398. doi: 10.1161/01.STR.0000198878.66000.4e. [DOI] [PubMed] [Google Scholar]
- 84.Feeney DM, Baron JC. Diaschisis. Stroke. 1986;17(5):817–830. doi: 10.1161/01.str.17.5.817. [DOI] [PubMed] [Google Scholar]
- 85.Powers WJ, Press GA, Grubb RL, Jr, Gado M, Raichle ME. The effect of hemodynamically significant carotid artery disease on the hemodynamic status of the cerebral circulation. Ann Intern Med. 1987;106(1):27–34. doi: 10.7326/0003-4819-106-1-27. [DOI] [PubMed] [Google Scholar]
- 86.Baron JC, Bousser MG, Comar D, Kellershohn C. Human hemispheric infarction studied by positron emission tomography and the 15O continuous inhalation technique. In: Caille JM, Salamon G, editors. Computerized tomography. New York: Springer-Verlag; 1980. pp. 231–237. [Google Scholar]
- 87.Baron JC, Bousser MG, Rey A, Guillard A, Comar D, Castaigne P. Reversal of focal “misery-perfusion syndrome” by extra-intracranial arterial bypass in hemodynamic cerebral ischemia. A case study with 15O positron emission tomography. Stroke. 1981;12(4):454–459. doi: 10.1161/01.str.12.4.454. [DOI] [PubMed] [Google Scholar]
- 88.Yamauchi H, Fukuyama H, Nagahama Y, Nabatame H, Nakamura K, Yamamoto Y, et al. Evidence of misery perfusion and risk for recurrent stroke in major cerebral arterial occlusive diseases from PET. J Neurol Neurosurg Psychiatry. 1996;61(1):18–25. doi: 10.1136/jnnp.61.1.18. [DOI] [PMC free article] [PubMed] [Google Scholar]
- 89.Yamauchi H, Fukuyama H, Nagahama Y, Nabatame H, Ueno M, Nishizawa S, et al. Significance of increased oxygen extraction fraction in five-year prognosis of major cerebral arterial occlusive diseases. J Nucl Med. 1999;40(12):1992–1998. [PubMed] [Google Scholar]
- 90.Grubb RL, Jr, Derdeyn CP, Fritsch SM, Carpenter DA, Yundt KD, Videen TO, et al. Importance of hemodynamic factors in the prognosis of symptomatic carotid occlusion. JAMA. 1998;280(12):1055–1060. doi: 10.1001/jama.280.12.1055. [DOI] [PubMed] [Google Scholar]
- 91.Powers WJ, Martin WR, Herscovitch P, Raichle ME, Grubb RL., Jr Extracranial-intracranial bypass surgery: hemodynamic and metabolic effects. Neurology. 1984;34(9):1168–1174. doi: 10.1212/wnl.34.9.1168. [DOI] [PubMed] [Google Scholar]
- 92.Gibbs JM, Wise RJ, Thomas DJ, Mansfield AO, Russell RW. Cerebral haemodynamic changes after extracranial-intracranial bypass surgery. J Neurol Neurosurg Psychiatry. 1987;50(2):140–150. doi: 10.1136/jnnp.50.2.140. [DOI] [PMC free article] [PubMed] [Google Scholar]
- 93.Samson Y, Baron JC, Bousser MG, Rey A, Derlon JM, David P, et al. Effects of extra-intracranial arterial bypass on cerebral blood flow and oxygen metabolism in humans. Stroke. 1985;16(4):609–616. doi: 10.1161/01.str.16.4.609. [DOI] [PubMed] [Google Scholar]
- 94.Adams HP, Jr, Powers WJ, Grubb RL, Jr, Clarke WR, Woolson RF. Preview of a new trial of extracranial-to-intracranial arterial anastomosis: the carotid occlusion surgery study. Neurosurg Clin N Am. 2001;12(3):613–624. [PubMed] [Google Scholar]
- 95.Powers WJ, Derdeyn CP, Fritsch SM, Carpenter DA, Yundt KD, Videen TO, et al. Benign prognosis of never-symptomatic carotid occlusion. Neurology. 2000;54(4):878–882. doi: 10.1212/wnl.54.4.878. [DOI] [PubMed] [Google Scholar]
- 96.Kazumata K, Tanaka N, Ishikawa T, Kuroda S, Houkin K, Mitsumori K. Dissociation of vasoreactivity to acetazolamide and hypercapnia. Comparative study in patients with chronic occlusive major cerebral artery disease. Stroke. 1996;27(11):2052–2058. doi: 10.1161/01.str.27.11.2052. [DOI] [PubMed] [Google Scholar]
- 97.Inao S, Tadokoro M, Nishino M, Mizutani N, Terada K, Bundo M, et al. Neural activation of the brain with hemodynamic insufficiency. J Cereb Blood Flow Metab. 1998;18(9):960–967. doi: 10.1097/00004647-199809000-00005. [DOI] [PubMed] [Google Scholar]
- 98.Pindzola RR, Balzer JR, Nemoto EM, Goldstein S, Yonas H. Cerebrovascular reserve in patients with carotid occlusive disease assessed by stable xenon-enhanced ct cerebral blood flow and transcranial Doppler. Stroke. 2001;32(8):1811–1817. doi: 10.1161/01.str.32.8.1811. [DOI] [PubMed] [Google Scholar]
- 99.Hirano T, Minematsu K, Hasegawa Y, Tanaka Y, Hayashida K, Yamaguchi T. Acetazolamide reactivity on 123I-IMP single photon emission computed tomography in patients with major cerebral artery occlusive disease: correlation with positron emission tomography parameters. J Cereb Blood Flow Metab. 1994;14(5):763–770. doi: 10.1038/jcbfm.1994.97. [DOI] [PubMed] [Google Scholar]
- 100.Nariai T, Suzuki R, Hirakawa K, Maehara T, Ishii K, Senda M. Vascular reserve in chronic cerebral ischemia measured by the acetazolamide challenge test: comparison with positron emission tomography. AJNR Am J Neuroradiol. 1995;16(3):563–570. [PMC free article] [PubMed] [Google Scholar]
- 101.Okazawa H, Tsuchida T, Kobayashi M, Arai Y, Pagani M, Isozaki M, et al. Can the detection of misery perfusion in chronic cerebrovascular disease be based on reductions in baseline CBF and vasoreactivity? Eur J Nucl Med Mol Imaging. 2007;34(1):121–129. doi: 10.1007/s00259-006-0192-5. [DOI] [PubMed] [Google Scholar]
- 102.Nemoto EM, Yonas H, Kuwabara H, Pindzola RR, Sashin D, Meltzer CC, et al. Identification of hemodynamic compromise by cerebrovascular reserve and oxygen extraction fraction in occlusive vascular disease. J Cereb Blood Flow Metab. 2004;24(10):1081–1089. doi: 10.1097/01.WCB.0000125887.48838.37. [DOI] [PubMed] [Google Scholar]
- 103.Yamauchi H, Kudoh T, Kishibe Y, Iwasaki J, Kagawa S. Selective neuronal damage and chronic hemodynamic cerebral ischemia. Ann Neurol. 2007;61(5):454–465. doi: 10.1002/ana.21104. [DOI] [PubMed] [Google Scholar]
- 104.Derdeyn CP, Videen TO, Grubb RL, Jr, Powers WJ. Comparison of PET oxygen extraction fraction methods for the prediction of stroke risk. J Nucl Med. 2001;42(8):1195–1197. [PubMed] [Google Scholar]
- 105.Giffard C, Young AR, Kerrouche N, Derlon JM, Baron JC. Outcome of acutely ischemic brain tissue in prolonged middle cerebral artery occlusion: a serial positron emission tomography investigation in the baboon. J Cereb Blood Flow Metab. 2004;24(5):495–508. doi: 10.1097/00004647-200405000-00003. [DOI] [PubMed] [Google Scholar]
- 106.Kuge Y, Yokota C, Tagaya M, Hasegawa Y, Nishimura A, Kito G, et al. Serial changes in cerebral blood flow and flow-metabolism uncoupling in primates with acute thromboembolic stroke. J Cereb Blood Flow Metab. 2001;21(3):202–210. doi: 10.1097/00004647-200103000-00003. [DOI] [PubMed] [Google Scholar]
- 107.Sakoh M, Ostergaard L, Rohl L, Smith DF, Simonsen CZ, Sorensen JC, et al. Relationship between residual cerebral blood flow and oxygen metabolism as predictive of ischemic tissue viability: sequential multitracer positron emission tomography scanning of middle cerebral artery occlusion during the critical first 6 hours after stroke in pigs. J Neurosurg. 2000;93(4):647–657. doi: 10.3171/jns.2000.93.4.0647. [DOI] [PubMed] [Google Scholar]
- 108.Pappata S, Fiorelli M, Rommel T, Hartmann A, Dettmers C, Yamaguchi T, et al. PET study of changes in local brain hemodynamics and oxygen metabolism after unilateral middle cerebral artery occlusion in baboons. J Cereb Blood Flow Metab. 1993;13(3):416–424. doi: 10.1038/jcbfm.1993.56. [DOI] [PubMed] [Google Scholar]
- 109.Heiss WD, Graf R, Wienhard K, Lottgen J, Saito R, Fujita T, et al. Dynamic penumbra demonstrated by sequential multitracer PET after middle cerebral artery occlusion in cats. J Cereb Blood Flow Metab. 1994;14(6):892–902. doi: 10.1038/jcbfm.1994.120. [DOI] [PubMed] [Google Scholar]
- 110.Touzani O, Young AR, Derlon JM, Beaudouin V, Marchal G, Rioux P, et al. Sequential studies of severely hypometabolic tissue volumes after permanent middle cerebral artery occlusion. A positron emission tomographic investigation in anesthetized baboons. Stroke. 1995;26(11):2112–2119. doi: 10.1161/01.str.26.11.2112. [DOI] [PubMed] [Google Scholar]
- 111.Ackerman RH, Lev MH, Mackay BC, Katz PM, Babikian VL, Alpert NM, et al. PET studies in acute stroke: Findings and relevance to therapy. J Cereb Blood Flow Metab. 1989;9 (suppl 1):S359. [Google Scholar]
- 112.Heiss WD, Huber M, Fink GR, Herholz K, Pietrzyk U, Wagner R, et al. Progressive derangement of periinfarct viable tissue in ischemic stroke. J Cereb Blood Flow Metab. 1992;12(2):193–203. doi: 10.1038/jcbfm.1992.29. [DOI] [PubMed] [Google Scholar]
- 113.Molina CA, Montaner J, Abilleira S, Ibarra B, Romero F, Arenillas JF, et al. Timing of spontaneous recanalization and risk of hemorrhagic transformation in acute cardioembolic stroke. Stroke. 2001;32(5):1079–1084. doi: 10.1161/01.str.32.5.1079. [DOI] [PubMed] [Google Scholar]
- 114.Jorgensen HS, Sperling B, Nakayama H, Raaschou HO, Olsen TS. Spontaneous reperfusion of cerebral infarcts in patients with acute stroke. Incidence, time course, and clinical outcome in the Copenhagen Stroke Study. Arch Neurol. 1994;51(9):865–873. doi: 10.1001/archneur.1994.00540210037011. [DOI] [PubMed] [Google Scholar]
- 115.Lassen NA. The luxury-perfusion syndrome and its possible relation to acute metabolic acidosis localised within the brain. Lancet. 1966;2(7473):1113–1115. doi: 10.1016/s0140-6736(66)92199-4. [DOI] [PubMed] [Google Scholar]
- 116.Lenzi GL, Frackowiak RS, Jones T. Cerebral oxygen metabolism and blood flow in human cerebral ischemic infarction. J Cereb Blood Flow Metab. 1982;2(3):321–335. doi: 10.1038/jcbfm.1982.33. [DOI] [PubMed] [Google Scholar]
- 117.Hakim AM, Pokrupa RP, Villanueva J, Diksic M, Evans AC, Thompson CJ, et al. The effect of spontaneous reperfusion on metabolic function in early human cerebral infarcts. Ann Neurol. 1987;21(3):279–289. doi: 10.1002/ana.410210310. [DOI] [PubMed] [Google Scholar]
- 118.Marchal G, Serrati C, Rioux P, Petit-Taboue MC, Viader F, de la Sayette V, et al. PET imaging of cerebral perfusion and oxygen consumption in acute ischaemic stroke: relation to outcome. Lancet. 1993;341(8850):925–927. doi: 10.1016/0140-6736(93)91214-7. [DOI] [PubMed] [Google Scholar]
- 119.Baron JC, Bousser MG, Comar D, Soussaline F, Castaigne P. Noninvasive tomographic study of cerebral blood flow and oxygen metabolism in vivo. Potentials, limitations, and clinical applications in cerebral ischemic disorders. Eur Neurol. 1981;20(3):273–284. doi: 10.1159/000115247. [DOI] [PubMed] [Google Scholar]
- 120.Furlan M, Marchal G, Viader F, Derlon JM, Baron JC. Spontaneous neurological recovery after stroke and the fate of the ischemic penumbra. Ann Neurol. 1996;40(2):216–226. doi: 10.1002/ana.410400213. [DOI] [PubMed] [Google Scholar]
- 121.Shimosegawa E, Hatazawa J, Ibaraki M, Toyoshima H, Suzuki A. Metabolic penumbra of acute brain infarction: a correlation with infarct growth. Ann Neurol. 2005;57(4):495–504. doi: 10.1002/ana.20427. [DOI] [PubMed] [Google Scholar]
- 122.Rojas S, Martin A, Arranz MJ, Pareto D, Purroy J, Verdaguer E, et al. Imaging brain inflammation with [(11)C]PK11195 by PET and induction of the peripheral-type benzodiazepine receptor after transient focal ischemia in rats. J Cereb Blood Flow Metab. 2007;27(12):1975–1986. doi: 10.1038/sj.jcbfm.9600500. [DOI] [PubMed] [Google Scholar]
- 123.Schroeter M, Dennin MA, Walberer M, Backes H, Neumaier B, Fink GR, et al. Neuroinflammation extends brain tissue at risk to vital peri-infarct tissue: a double tracer [11C]PK1. J Cereb Blood Flow Metab. 2009;29(6):1216–1225. doi: 10.1038/jcbfm.2009.36. [DOI] [PubMed] [Google Scholar]
- 124.Myers R, Manjil LG, Cullen BM, Price GW, Frackowiak RS, Cremer JE. Macrophage and astrocyte populations in relation to [3H]PK 11195 binding in rat cerebral cortex following a local ischaemic lesion. J Cereb Blood Flow Metab. 1991;11(2):314–322. doi: 10.1038/jcbfm.1991.64. [DOI] [PubMed] [Google Scholar]
- 125.Gerhard A, Schwarz J, Myers R, Wise R, Banati RB. Evolution of microglial activation in patients after ischemic stroke: a [11C](R)-PK11195 PET study. Neuroimage. 2005;24(2):591–595. doi: 10.1016/j.neuroimage.2004.09.034. [DOI] [PubMed] [Google Scholar]
- 126.Price CJ, Wang D, Menon DK, Guadagno JV, Cleij M, Fryer T, et al. Intrinsic activated microglia map to the peri-infarct zone in the subacute phase of ischemic stroke. Stroke. 2006;37(7):1749–1753. doi: 10.1161/01.STR.0000226980.95389.0b. [DOI] [PubMed] [Google Scholar]
- 127.Heiss WD, Rosner G. Functional recovery of cortical neurons as related to degree and duration of ischemia. Ann Neurol. 1983;14(3):294–301. doi: 10.1002/ana.410140307. [DOI] [PubMed] [Google Scholar]
- 128.Marks MP, O’Donahue J, Fabricant JI, Frankel KA, Phillips MH, DeLaPaz RL, et al. Cerebral blood flow evaluation of arteriovenous malformations with stable xenon CT. Am J Neuroradiol. 1988;9(6):1169–1175. [PMC free article] [PubMed] [Google Scholar]
- 129.Hossmann KA. Pathophysiology and therapy of experimental stroke. Cell Mol Neurobiol. 2006;26(7–8):1057–1083. doi: 10.1007/s10571-006-9008-1. [DOI] [PMC free article] [PubMed] [Google Scholar]
- 130.Crockard HA, Gadian DG, Frackowiak RS, Proctor E, Allen K, Williams SR, et al. Acute cerebral ischaemia: concurrent changes in cerebral blood flow, energy metabolites, pH, and lactate measured with hydrogen clearance and 31P and 1H nuclear magnetic resonance spectroscopy. II. Changes during ischaemia. J Cereb Blood Flow Metab. 1987;7(4):394–402. doi: 10.1038/jcbfm.1987.82. [DOI] [PubMed] [Google Scholar]
- 131.Astrup J, Symon L, Branston NM, Lassen NA. Cortical evoked potential and extracellular K+ and H+ at critical levels of brain ischemia. Stroke. 1977;8(1):51–57. doi: 10.1161/01.str.8.1.51. [DOI] [PubMed] [Google Scholar]
- 132.Marcoux FW, Morawetz RB, Crowell RM, DeGirolami U, Halsey JH., Jr Differential regional vulnerability in transient focal cerebral ischemia. Stroke. 1982;13(3):339–346. doi: 10.1161/01.str.13.3.339. [DOI] [PubMed] [Google Scholar]
- 133.Sundt TM, Jr, Sharbrough FW, Piepgras DG, Kearns TP, Messick JM, Jr, O’Fallon WM. Correlation of cerebral blood flow and electroencephalographic changes during carotid endarterectomy: with results of surgery and hemodynamics of cerebral ischemia. Mayo Clin Proc. 1981;56(9):533–543. [PubMed] [Google Scholar]
- 134.Jones TH, Morawetz RB, Crowell RM, Marcoux FW, FitzGibbon SJ, DeGirolami U, et al. Thresholds of focal cerebral ischemia in awake monkeys. J Neurosurg. 1981;54(6):773–782. doi: 10.3171/jns.1981.54.6.0773. [DOI] [PubMed] [Google Scholar]
- 135.Morawetz RB, Crowell RH, DeGirolami U, Marcoux FW, Jones TH, Halsey JH. Regional cerebral blood flow thresholds during cerebral ischemia. Fed Proc. 1979;38(11):2493–2494. [PubMed] [Google Scholar]
- 136.Crowell RM, Marcoux FW, DeGirolami U. Variability and reversibility of focal cerebral ischemia in unanesthetized monkeys. Neurology. 1981;31(10):1295–1302. doi: 10.1212/wnl.31.10.1295. [DOI] [PubMed] [Google Scholar]
- 137.Tissue plasminogen activator for acute ischemic stroke. The National Institute of Neurological Disorders and Stroke rt-PA Stroke Study Group. N Engl J Med. 1995;333(24):1581–1587. doi: 10.1056/NEJM199512143332401. [DOI] [PubMed] [Google Scholar]
- 138.Hacke W, Kaste M, Bluhmki E, Brozman M, Davalos A, Guidetti D, et al. Thrombolysis with alteplase 3 to 4.5 hours after acute ischemic stroke. N Engl J Med. 2008;359(13):1317–1329. doi: 10.1056/NEJMoa0804656. [DOI] [PubMed] [Google Scholar]
- 139.Powers WJ. Imaging preventable infarction in patients with acute ischemic stroke. AJNR Am J Neuroradiol. 2008 doi: 10.3174/ajnr.A1330. in press. [DOI] [PMC free article] [PubMed] [Google Scholar]
- 140.Nunn A, Linder K, Strauss HW. Nitroimidazoles and imaging hypoxia. Eur J Nucl Med. 1995;22(3):265–280. doi: 10.1007/BF01081524. [DOI] [PubMed] [Google Scholar]
- 141.Markus R, Reutens DC, Kazui S, Read S, Wright P, Chambers BR, et al. Topography and temporal evolution of hypoxic viable tissue identified by 18F-fluoromisonidazole positron emission tomography in humans after ischemic stroke. Stroke. 2003;34(11):2646–2652. doi: 10.1161/01.STR.0000094422.74023.FF. [DOI] [PubMed] [Google Scholar]
- 142.Read SJ, Hirano T, Abbott DF, Sachinidis JI, Tochon-Danguy HJ, Chan JG, et al. Identifying hypoxic tissue after acute ischemic stroke using PET and 18F-fluoromisonidazole. Neurology. 1998;51(6):1617–1621. doi: 10.1212/wnl.51.6.1617. [DOI] [PubMed] [Google Scholar]
- 143.Read SJ, Hirano T, Abbott DF, Markus R, Sachinidis JI, Tochon-Danguy HJ, et al. The fate of hypoxic tissue on 18F-fluoromisonidazole positron emission tomography after ischemic stroke. Ann Neurol. 2000;48(2):228–235. [PubMed] [Google Scholar]
- 144.Saita K, Chen M, Spratt NJ, Porritt MJ, Liberatore GT, Read SJ, et al. Imaging the ischemic penumbra with 18F-fluoromisonidazole in a rat model of ischemic stroke. Stroke. 2004;35(4):975–980. doi: 10.1161/01.STR.0000121647.01941.ba. [DOI] [PubMed] [Google Scholar]
- 145.Hantraye P, Kaijima M, Prenant C, Guibert B, Sastre J, Crouzel M, et al. Central type benzodiazepine binding sites: a positron emission tomography study in the baboon’s brain. Neurosci Lett. 1984;48(2):115–120. doi: 10.1016/0304-3940(84)90005-3. [DOI] [PubMed] [Google Scholar]
- 146.Schwartz RD, Yu X, Wagner J, Ehrmann M, Mileson BE. Cellular regulation of the benzodiazepine/GABA receptor: arachidonic acid, calcium, and cerebral ischemia. Neuropsychopharmacology. 1992;6(2):119–125. [PubMed] [Google Scholar]
- 147.Abadie P, Baron JC, Bisserbe JC, Boulenger JP, Rioux P, Travere JM, et al. Central benzodiazepine receptors in human brain: estimation of regional Bmax and KD values with positron emission tomography. Eur J Pharmacol. 1992;213(1):107–115. doi: 10.1016/0014-2999(92)90239-z. [DOI] [PubMed] [Google Scholar]
- 148.Heiss WD, Grond M, Thiel A, Ghaemi M, Sobesky J, Rudolf J, et al. Permanent cortical damage detected by flumazenil positron emission tomography in acute stroke. Stroke. 1998;29(2):454–461. doi: 10.1161/01.str.29.2.454. [DOI] [PubMed] [Google Scholar]
- 149.Heiss WD, Graf R, Fujita T, Ohta K, Bauer B, Lottgen J, et al. Early detection of irreversibly damaged ischemic tissue by flumazenil positron emission tomography in cats. Stroke. 1997;28(10):2045–2051. doi: 10.1161/01.str.28.10.2045. [DOI] [PubMed] [Google Scholar]
- 150.Heiss WD, Kracht LW, Thiel A, Grond M, Pawlik G. Penumbral probability thresholds of cortical flumazenil binding and blood flow predicting tissue outcome in patients with cerebral ischemia. Brain. 2001;124:20–29. doi: 10.1093/brain/124.1.20. [DOI] [PubMed] [Google Scholar]
- 151.Powers WJ, Grubb RL, Jr, Darriet D, Raichle ME. Cerebral blood flow and cerebral metabolic rate of oxygen requirements for cerebral function and viability in humans. J Cereb Blood Flow Metab. 1985;5(4):600–608. doi: 10.1038/jcbfm.1985.89. [DOI] [PubMed] [Google Scholar]
- 152.Frykholm P, Andersson JL, Valtysson J, Silander HC, Hillered L, Persson L, et al. A metabolic threshold of irreversible ischemia demonstrated by PET in a middle cerebral artery occlusion-reperfusion primate model. Acta Neurol Scand. 2000;102(1):18–26. doi: 10.1034/j.1600-0404.2000.102001018.x. [DOI] [PubMed] [Google Scholar]
- 153.Baron JC, Rougemont D, Bousser MG, Lebrun-Grandie P, Iba-Zizen MT, Chiras C. Local CBF, oxygen extraction fraction (OEF), and CMRO2: Prognostic value in recent supratentorial infarction in humans. J Cereb Blood Flow Metab. 1983;3 (suppl 1):S1–S2. [Google Scholar]
- 154.Marchal G, Benali K, Iglesias S, Viader F, Derlon JM, Baron JC. Voxel-based mapping of irreversible ischaemic damage with PET in acute stroke. Brain. 1999;122 (Pt 12):2387–2400. doi: 10.1093/brain/122.12.2387. [DOI] [PubMed] [Google Scholar]
- 155.Young AR, Sette G, Touzani O, Rioux P, Derlon JM, MacKenzie ET, et al. Relationships between high oxygen extraction fraction in the acute stage and final infarction in reversible middle cerebral artery occlusion: an investigation in anesthetized baboons with positron emission tomography. J Cereb Blood Flow Metab. 1996;16(6):1176–1188. doi: 10.1097/00004647-199611000-00012. [DOI] [PubMed] [Google Scholar]
- 156.Marchal G, Beaudouin V, Rioux P, de la Sayette V, Le Doze F, Viader F, et al. Prolonged persistence of substantial volumes of potentially viable brain tissue after stroke: a correlative PET-CT study with voxel-based data analysis. Stroke. 1996;27(4):599–606. doi: 10.1161/01.str.27.4.599. [DOI] [PubMed] [Google Scholar]
- 157.Yun M, Yeh D, Araujo LI, Jang S, Newberg A, Alavi A. F-18 FDG uptake in the large arteries: a new observation. Clin Nucl Med. 2001;26(4):314–319. doi: 10.1097/00003072-200104000-00007. [DOI] [PubMed] [Google Scholar]
- 158.Rudd JH, Warburton EA, Fryer TD, Jones HA, Clark JC, Antoun N, et al. Imaging atherosclerotic plaque inflammation with [18F]-fluorodeoxyglucose positron emission tomography. Circulation. 2002;105(23):2708–2711. doi: 10.1161/01.cir.0000020548.60110.76. [DOI] [PubMed] [Google Scholar]
- 159.Tawakol A, Migrino RQ, Bashian GG, Bedri S, Vermylen D, Cury RC, et al. In vivo 18F-fluorodeoxyglucose positron emission tomography imaging provides a noninvasive measure of carotid plaque inflammation in patients. J Am Coll Cardiol. 2006;48(9):1818–1824. doi: 10.1016/j.jacc.2006.05.076. [DOI] [PubMed] [Google Scholar]
- 160.Font MA, Fernandez A, Carvajal A, Gamez C, Badimon L, Slevin M, et al. Imaging of early inflammation in low-to-moderate carotid stenosis by 18-FDG-PET. Front Biosci. 2009;14:3352–3360. doi: 10.2741/3457. [DOI] [PubMed] [Google Scholar]
- 161.Graebe M, Pedersen SF, Borgwardt L, Hojgaard L, Sillesen H, Kjaer A. Molecular pathology in vulnerable carotid plaques: correlation with [18]-fluorodeoxyglucose positron emission tomography (FDG-PET) Eur J Vasc Endovasc Surg. 2009;37(6):714–721. doi: 10.1016/j.ejvs.2008.11.018. [DOI] [PubMed] [Google Scholar]
- 162.Davies JR, Rudd JH, Fryer TD, Graves MJ, Clark JC, Kirkpatrick PJ, et al. Identification of culprit lesions after transient ischemic attack by combined 18F fluorodeoxyglucose positron-emission tomography and high-resolution magnetic resonance imaging. Stroke. 2005;36(12):2642–2647. doi: 10.1161/01.STR.0000190896.67743.b1. [DOI] [PubMed] [Google Scholar]
- 163.Baron JC, Bousser MG, Comar D, Castaigne P. ‘Crossed cerebellar diaschisis’ in human supratentorial brain infarction. Trans Am Neurol Assoc. 1980;105:459–461. [PubMed] [Google Scholar]
- 164.Martin WR, Raichle ME. Cerebellar blood flow and metabolism in cerebral hemisphere infarction. Ann Neurol. 1983;14(2):168–176. doi: 10.1002/ana.410140203. [DOI] [PubMed] [Google Scholar]
- 165.Pantano P, Baron JC, Samson Y, Bousser MG, Derouesne C, Comar D. Crossed cerebellar diaschisis. Further studies. Brain. 1986;109 (Pt 4):677–694. doi: 10.1093/brain/109.4.677. [DOI] [PubMed] [Google Scholar]
- 166.Kuhl DE, Phelps ME, Kowell AP, Metter EJ, Selin C, Winter J. Effects of stroke on local cerebral metabolism and perfusion: mapping by emission computed tomography of 18FDG and 13NH3. Ann Neurol. 1980;8(1):47–60. doi: 10.1002/ana.410080108. [DOI] [PubMed] [Google Scholar]
- 167.Kushner M, Alavi A, Reivich M, Dann R, Burke A, Robinson G. Contralateral cerebellar hypometabolism following cerebral insult: a positron emission tomographic study. Ann Neurol. 1984;15(5):425–434. doi: 10.1002/ana.410150505. [DOI] [PubMed] [Google Scholar]
- 168.Ito H, Kanno I, Shimosegawa E, Tamura H, Okane K, Hatazawa J. Hemodynamic changes during neural deactivation in human brain: a positron emission tomography study of crossed cerebellar diaschisis. Ann Nucl Med. 2002;16(4):249–254. doi: 10.1007/BF03000103. [DOI] [PubMed] [Google Scholar]
- 169.Yamauchi H, Fukuyama H, Kimura J. Hemodynamic and metabolic changes in crossed cerebellar hypoperfusion. Stroke. 1992;23(6):855–860. doi: 10.1161/01.str.23.6.855. [DOI] [PubMed] [Google Scholar]
- 170.Serrati C, Marchal G, Rioux P, Viader F, Petit-Taboue MC, Lochon P, et al. Contralateral cerebellar hypometabolism: a predictor for stroke outcome? J Neurol Neurosurg Psychiatry. 1994;57(2):174–179. doi: 10.1136/jnnp.57.2.174. [DOI] [PMC free article] [PubMed] [Google Scholar]
- 171.Sobesky J, Thiel A, Ghaemi M, Hilker RH, Rudolf J, Jacobs AH, et al. Crossed cerebellar diaschisis in acute human stroke: a PET study of serial changes and response to supratentorial reperfusion. J Cereb Blood Flow Metab. 2005;25(12):1685–1691. doi: 10.1038/sj.jcbfm.9600162. [DOI] [PubMed] [Google Scholar]
- 172.Kim SE, Choi CW, Yoon BW, Chung JK, Roh JH, Lee MC, et al. Crossed-cerebellar diaschisis in cerebral infarction: technetium-99m- HMPAO SPECT and MRI. J Nucl Med. 1997;38(1):14–19. [PubMed] [Google Scholar]
- 173.Yamauchi H, Fukuyama H, Nagahama Y, Nishizawa S, Konishi J. Uncoupling of oxygen and glucose metabolism in persistent crossed cerebellar diaschisis. Stroke. 1999;30(7):1424–1428. doi: 10.1161/01.str.30.7.1424. [DOI] [PubMed] [Google Scholar]
- 174.Celesia GG, Polcyn RE, Holden JE, Nickles RJ, Koeppe RA, Gatley SJ. Determination of regional cerebral blood flow in patients with cerebral infarction. Use of fluoromethane labeled with fluorine 18 and positron emission tomography. Arch Neurol. 1984;41(3):262–267. doi: 10.1001/archneur.1984.04050150040013. [DOI] [PubMed] [Google Scholar]
- 175.Dobkin JA, Levine RL, Lagreze HL, Dulli DA, Nickles RJ, Rowe BR. Evidence for transhemispheric diaschisis in unilateral stroke. Arch Neurol. 1989;46(12):1333–1336. doi: 10.1001/archneur.1989.00520480077023. [DOI] [PubMed] [Google Scholar]
- 176.Wise R, Gibbs J, Frackowiak R, Marshall J, Jones T. No evidence for transhemispheric diaschisis after human cerebral infarction. Stroke. 1986;17(5):853–861. doi: 10.1161/01.str.17.5.853. [DOI] [PubMed] [Google Scholar]
- 177.Baron JC, Lebrun-Grandie P, Collard P, Crouzel C, Mestelan G, Bousser MG. Noninvasive measurement of blood flow, oxygen consumption, and glucose utilization in the same brain regions in man by positron emission tomography: concise communication. J Nucl Med. 1982;23(5):391–399. [PubMed] [Google Scholar]
- 178.Heiss WD, Pawlik G, Wagner R, Ilsen HW, Herholz K, Wienhard K. Functional hypometabolism of noninfarcted brain regions in ischemic stroke. J Cereb Blood Flow Metab. 1983;3 (suppl 1):S582–S583. [Google Scholar]
- 179.Iglesias S, Marchal G, Viader F, Baron JC. Delayed intrahemispheric remote hypometabolism. Correlations with early recovery after stroke. Cerebrovasc Dis. 2000;10(5):391–402. doi: 10.1159/000016096. [DOI] [PubMed] [Google Scholar]
- 180.Wise RJ, Bernardi S, Frackowiak RS, Legg NJ, Jones T. Serial observations on the pathophysiology of acute stroke. The transition from ischaemia to infarction as reflected in regional oxygen extraction. Brain. 1983;106 (Pt 1):197–222. doi: 10.1093/brain/106.1.197. [DOI] [PubMed] [Google Scholar]
- 181.Szelies B, Herholz K, Pawlik G, Karbe H, Hebold I, Heiss WD. Widespread functional effects of discrete thalamic infarction. Arch Neurol. 1991;48(2):178–182. doi: 10.1001/archneur.1991.00530140072019. [DOI] [PubMed] [Google Scholar]
- 182.Von Monakow C. Diaschisis. In: Pribram KA, editor. Brain and behavior I: mood, states and mind. Baltimore: Penguin Books; 1969. pp. 27–36. [Google Scholar]
- 183.Lenzi GL, Frackowiak RS, Jones T, Heather JD, Lammertsma AA, Rhodes CG, et al. CMRO2 and CBF by the oxygen-15 inhalation technique. Results in normal volunteers and cerebrovascular patients. Eur Neurol. 1981;20(3):285–290. doi: 10.1159/000115248. [DOI] [PubMed] [Google Scholar]
- 184.Iglesias S, Marchal G, Rioux P, Beaudouin V, Hauttement AJ, de la Sayette V, et al. Do changes in oxygen metabolism in the unaffected cerebral hemisphere underlie early neurological recovery after stroke? A positron emission tomography study. Stroke. 1996;27(7):1192–1199. doi: 10.1161/01.str.27.7.1192. [DOI] [PubMed] [Google Scholar]
- 185.Dong Y, Fukuyama H, Nabatame H, Yamauchi H, Shibasaki H, Yonekura Y. Assessment of benzodiazepine receptors using iodine-123-labeled iomazenil single-photon emission computed tomography in patients with ischemic cerebrovascular disease. A comparison with PET study. Stroke. 1997;28(9):1776–1782. doi: 10.1161/01.str.28.9.1776. [DOI] [PubMed] [Google Scholar]
- 186.Sakai F, Aoki S, Kan S, Igarashi H, Kanda T, Tazaki Y. Ataxic hemiparesis with reductions of ipsilateral cerebellar blood flow. Stroke. 1986;17(5):1016–1018. doi: 10.1161/01.str.17.5.1016. [DOI] [PubMed] [Google Scholar]
- 187.Giroud M, Creisson E, Fayolle H, Gras P, Vion P, Brunotte F, et al. Homolateral ataxia and crural paresis: a crossed cerebral-cerebellar diaschisis. J Neurol Neurosurg Psychiatry. 1994;57(2):221–222. doi: 10.1136/jnnp.57.2.221. [DOI] [PMC free article] [PubMed] [Google Scholar]
- 188.Metter EJ, Kempler D, Jackson C, Hanson WR, Mazziotta JC, Phelps ME. Cerebral glucose metabolism in Wernicke’s, Broca’s, and conduction aphasia. Arch Neurol. 1989;46(1):27–34. doi: 10.1001/archneur.1989.00520370029014. [DOI] [PubMed] [Google Scholar]
- 189.Karbe H, Herholz K, Szelies B, Pawlik G, Wienhard K, Heiss WD. Regional metabolic correlates of Token test results in cortical and subcortical left hemispheric infarction. Neurology. 1989;39(8):1083–1088. doi: 10.1212/wnl.39.8.1083. [DOI] [PubMed] [Google Scholar]
- 190.Perani D, Vallar G, Cappa S, Messa C, Fazio F. Aphasia and neglect after subcortical stroke. A clinical/cerebral perfusion correlation study. Brain. 1987;110 (Pt 5):1211–1229. doi: 10.1093/brain/110.5.1211. [DOI] [PubMed] [Google Scholar]
- 191.Karbe H, Szelies B, Herholz K, Heiss WD. Impairment of language is related to left parieto-temporal glucose metabolism in aphasic stroke patients. J Neurol. 1990;237(1):19–23. doi: 10.1007/BF00319662. [DOI] [PubMed] [Google Scholar]
- 192.Kushner M, Reivich M, Fieschi C, Silver F, Chawluk J, Rosen M, et al. Metabolic and clinical correlates of acute ischemic infarction. Neurology. 1987;37(7):1103–1110. doi: 10.1212/wnl.37.7.1103. [DOI] [PubMed] [Google Scholar]
- 193.Heiss WD, Kessler J, Karbe H, Fink GR, Pawlik G. Cerebral glucose metabolism as a predictor of recovery from aphasia in ischemic stroke. Arch Neurol. 1993;50(9):958–964. doi: 10.1001/archneur.1993.00540090059011. [DOI] [PubMed] [Google Scholar]
- 194.Karbe H, Kessler J, Herholz K, Fink GR, Heiss WD. Long-term prognosis of poststroke aphasia studied with positron emission tomography. Arch Neurol. 1995;52(2):186–190. doi: 10.1001/archneur.1995.00540260092022. [DOI] [PubMed] [Google Scholar]
- 195.Chui HC, Mack W, Jackson JE, Mungas D, Reed BR, Tinklenberg J, et al. Clinical criteria for the diagnosis of vascular dementia: a multicenter study of comparability and interrater reliability. Arch Neurol. 2000;57(2):191–196. doi: 10.1001/archneur.57.2.191. [DOI] [PubMed] [Google Scholar]
- 196.Brunnstrom H, Englund E. Clinicopathological concordance in dementia diagnostics. Am J Geriatr Psychiatry. 2009;17(8):664–670. doi: 10.1097/jgp.0b013e3181a6516e. [DOI] [PubMed] [Google Scholar]
- 197.Lopez OL, Kuller LH, Becker JT, Jagust WJ, DeKosky ST, Fitzpatrick A, et al. Classification of vascular dementia in the Cardiovascular Health Study Cognition Study. Neurology. 2005;64(9):1539–1547. doi: 10.1212/01.WNL.0000159860.19413.C4. [DOI] [PubMed] [Google Scholar]
- 198.Smith CD, Snowdon DA, Wang H, Markesbery WR. White matter volumes and periventricular white matter hyperintensities in aging and dementia. Neurology. 2000;54(4):838–842. doi: 10.1212/wnl.54.4.838. [DOI] [PubMed] [Google Scholar]
- 199.Frackowiak RS, Pozzilli C, Legg NJ, du Boulay GH, Marshall J, Lenzi GL, et al. Regional cerebral oxygen supply and utilization in dementia. A clinical and physiological study with oxygen-15 and positron tomography. Brain. 1981;104(Pt 4):753–778. doi: 10.1093/brain/104.4.753. [DOI] [PubMed] [Google Scholar]
- 200.De Reuck J, Decoo D, Marchau M, Santens P, Lemahieu I, Strijckmans K. Positron emission tomography in vascular dementia. J Neurol Sci. 1998;154(1):55–61. doi: 10.1016/s0022-510x(97)00213-x. [DOI] [PubMed] [Google Scholar]
- 201.Hachinski VC, Potter P, Merskey H. Leuko-araiosis. Arch Neurol. 1987;44(1):21–23. doi: 10.1001/archneur.1987.00520130013009. [DOI] [PubMed] [Google Scholar]
- 202.Schmidt R, Petrovic K, Ropele S, Enzinger C, Fazekas F. Progression of leukoaraiosis and cognition. Stroke. 2007;38(9):2619–2625. doi: 10.1161/STROKEAHA.107.489112. [DOI] [PubMed] [Google Scholar]
- 203.Pantoni L, Poggesi A, Inzitari D. The relation between white-matter lesions and cognition. Curr Opin Neurol. 2007;20(4):390–397. doi: 10.1097/WCO.0b013e328172d661. [DOI] [PubMed] [Google Scholar]
- 204.Tohgi H, Yonezawa H, Takahashi S, Sato N, Kato E, Kudo M, et al. Cerebral blood flow and oxygen metabolism in senile dementia of Alzheimer’s type and vascular dementia with deep white matter changes. Neuroradiology. 1998;40(3):131–137. doi: 10.1007/s002340050553. [DOI] [PubMed] [Google Scholar]
- 205.Meguro K, Hatazawa J, Yamaguchi T, Itoh M, Matsuzawa T, Ono S, et al. Cerebral circulation and oxygen metabolism associated with subclinical periventricular hyperintensity as shown by magnetic resonance imaging. Ann Neurol. 1990;28(3):378–383. doi: 10.1002/ana.410280313. [DOI] [PubMed] [Google Scholar]
- 206.De Reuck J, Decoo D, Strijckmans K, Lemahieu I. Does the severity of leukoaraiosis contribute to senile dementia? A comparative computerized and positron emission tomographic study. Eur Neurol. 1992;32(4):199–205. doi: 10.1159/000116822. [DOI] [PubMed] [Google Scholar]
- 207.Ihara M, Tomimoto H, Ishizu K, Mukai T, Yoshida H, Sawamoto N, et al. Decrease in cortical benzodiazepine receptors in symptomatic patients with leukoaraiosis: a positron emission tomography study. Stroke. 2004;35(4):942–947. doi: 10.1161/01.STR.0000122624.32167.e0. [DOI] [PubMed] [Google Scholar]
- 208.Mendelow AD, Bullock R, Teasdale GM, Graham DI, McCulloch J. Intracranial haemorrhage induced at arterial pressure in the rat. Part 2: Short term changes in local cerebral blood flow measured by autoradiography. Neurol Res. 1984;6(4):189–193. doi: 10.1080/01616412.1984.11739688. [DOI] [PubMed] [Google Scholar]
- 209.Nath FP, Jenkins A, Mendelow AD, Graham DI, Teasdale GM. Early hemodynamic changes in experimental intracerebral hemorrhage. J Neurosurg. 1986;65(5):697–703. doi: 10.3171/jns.1986.65.5.0697. [DOI] [PubMed] [Google Scholar]
- 210.Sills C, Villar-Cordova C, Pasteur W, Lamki L, Barron B, Mullani N, et al. Demonstration of hypoperfusion surrounding intracerebral hematoma in humans. J Stroke Cerebrovasc Dis. 1996;6:17–24. doi: 10.1016/s1052-3057(96)80021-8. [DOI] [PubMed] [Google Scholar]
- 211.Qureshi AI, Wilson DA, Hanley DF, Traystman RJ. No evidence for an ischemic penumbra in massive experimental intracerebral hemorrhage. Neurology. 1999;52(2):266–272. doi: 10.1212/wnl.52.2.266. [DOI] [PubMed] [Google Scholar]
- 212.Mayer SA, Lignelli A, Fink ME, Kessler DB, Thomas CE, Swarup R, et al. Perilesional blood flow and edema formation in acute intracerebral hemorrhage: a SPECT study. Stroke. 1998;29(9):1791–1798. doi: 10.1161/01.str.29.9.1791. [DOI] [PubMed] [Google Scholar]
- 213.Nath FP, Kelly PT, Jenkins A, Mendelow AD, Graham DI, Teasdale GM. Effects of experimental intracerebral hemorrhage on blood flow, capillary permeability, and histochemistry. J Neurosurg. 1987;66(4):555–562. doi: 10.3171/jns.1987.66.4.0555. [DOI] [PubMed] [Google Scholar]
- 214.Hoffman EJ, Huang SC, Phelps ME. Quantitation in positron emission computed tomography: 1. Effect of object size. J Comput Assist Tomogr. 1979;3(3):299–308. doi: 10.1097/00004728-197906000-00001. [DOI] [PubMed] [Google Scholar]
- 215.Mazziotta JC, Phelps ME, Plummer D, Kuhl DE. Quantitation in positron emission computed tomography: 5. Physical-- anatomical effects. J Comput Assist Tomogr. 1981;5(5):734–743. doi: 10.1097/00004728-198110000-00029. [DOI] [PubMed] [Google Scholar]
- 216.Videen TO, Dunford-Shore JE, Diringer MN, Powers WJ. Correction for partial volume effects in regional blood flow measurements adjacent to hematomas in humans with intracerebral hemorrhage: implementation and validation. J Comput Assist Tomogr. 1999;23(2):248–256. doi: 10.1097/00004728-199903000-00014. [DOI] [PubMed] [Google Scholar]
- 217.Zazulia AR, Diringer MN, Videen TO, Adams RE, Yundt KD, Aiyagari V, et al. Hypoperfusion without ischemia surrounding acute intracerebral hemorrhage. J Cereb Blood Flow Metab. 2001;21:804–810. doi: 10.1097/00004647-200107000-00005. [DOI] [PubMed] [Google Scholar]
- 218.Kim-Han JS, Kopp SJ, Dugan LL, Diringer MN. Perihematomal mitochondrial dysfunction after intracerebral hemorrhage. Stroke. 2006;37(10):2457–2462. doi: 10.1161/01.STR.0000240674.99945.4e. [DOI] [PubMed] [Google Scholar]
- 219.Powers WJ, Zazulia AR, Videen TO, Adams RE, Yundt KD, Aiyagari V, et al. Autoregulation of cerebral blood flow surrounding acute (6 to 22 hours) intracerebral hemorrhage. Neurology. 2001;57(1):18–24. doi: 10.1212/wnl.57.1.18. [DOI] [PubMed] [Google Scholar]
- 220.Zazulia AR, Videen TO, Powers WJ. Transient focal increase in perihematomal glucose metabolism after acute human intracerebral hemorrhage. Stroke. 2009;40(5):1638–1643. doi: 10.1161/STROKEAHA.108.536037. [DOI] [PubMed] [Google Scholar]
- 221.Bergsneider M, Hovda DA, Shalmon E, Kelly DF, Vespa PM, Martin NA, et al. Cerebral hyperglycolysis following severe traumatic brain injury in humans: a positron emission tomography study. J Neurosurg. 1997;86(2):241–251. doi: 10.3171/jns.1997.86.2.0241. [DOI] [PubMed] [Google Scholar]
- 222.Hattori N, Huang SC, Wu HM, Liao W, Glenn TC, Vespa PM, et al. Acute changes in regional cerebral (18)F-FDG kinetics in patients with traumatic brain injury. J Nucl Med. 2004;45(5):775–783. [PubMed] [Google Scholar]
- 223.Vespa PM. Metabolic penumbra in intracerebral hemorrhage. Stroke. 2009;40(5):1547–1548. doi: 10.1161/STROKEAHA.108.542803. [DOI] [PubMed] [Google Scholar]
- 224.Heiss WD, Beil C, Pawlik G, Herholz K, Wagner R. Non-traumatic intracerebral hematoma versus ischemic stroke: regional pattern of glucose metabolism. J Cereb Blood Flow Metab. 1985;5 (suppl 1):S5–S6. [Google Scholar]
- 225.Dal-Bianco P. In: Meyer JS, Lechner H, Reivich M, Ott EO, editors. Positron emission tomotraphy of 2(18F)-fluorodeoxyglucose in cerebral vascular disease: clinicometabolic correlations in patients with nontraumatic spontaneous intracerebral hematoma and ischemic infarction; Cerebral Vascular Disease 6: Proceedings of the World Federation of Neurology 13th International Salzburg Conference; Amsterdam: Excerpta Medica; 1987. pp. 257–262. [Google Scholar]
- 226.Carpenter DA, Grubb RL, Jr, Tempel LW, Powers WJ. Cerebral oxygen metabolism after aneurysmal subarachnoid hemorrhage. J Cereb Blood Flow Metab. 1991;11(5):837–844. doi: 10.1038/jcbfm.1991.143. [DOI] [PubMed] [Google Scholar]
- 227.Frykholm P, Andersson JL, Langstrom B, Persson L, Enblad P. Haemodynamic and metabolic disturbances in the acute stage of subarachnoid haemorrhage demonstrated by PET. Acta Neurol Scand. 2004;109(1):25–32. doi: 10.1034/j.1600-0404.2003.00174.x. [DOI] [PubMed] [Google Scholar]
- 228.Kassell NF, Sasaki T, Colohan AR, Nazar G. Cerebral vasospasm following aneurysmal subarachnoid hemorrhage. Stroke. 1985;16(4):562–572. doi: 10.1161/01.str.16.4.562. [DOI] [PubMed] [Google Scholar]
- 229.Heros RC, Zervas NT, Varsos V. Cerebral vasospasm after subarachnoid hemorrhage: an update. Ann Neurol. 1983;14(6):599–608. doi: 10.1002/ana.410140602. [DOI] [PubMed] [Google Scholar]
- 230.Suarez JI, Tarr RW, Selman WR. Aneurysmal subarachnoid hemorrhage. N Engl J Med. 2006;354(4):387–396. doi: 10.1056/NEJMra052732. [DOI] [PubMed] [Google Scholar]
- 231.Jakobsen M, Enevoldsen E, Bjerre P. Cerebral blood flow and metabolism following subarachnoid haemorrhage: cerebral oxygen uptake and global blood flow during the acute period in patients with SAH. Acta Neurol Scand. 1990;82(3):174–182. doi: 10.1111/j.1600-0404.1990.tb04485.x. [DOI] [PubMed] [Google Scholar]
- 232.Hayashi T, Suzuki A, Hatazawa J, Kanno I, Shirane R, Yoshimoto T, et al. Cerebral circulation and metabolism in the acute stage of subarachnoid hemorrhage. J Neurosurg. 2000;93(6):1014–1018. doi: 10.3171/jns.2000.93.6.1014. [DOI] [PubMed] [Google Scholar]
- 233.Grubb RL, Jr, Raichle ME, Eichling JO, Gado MH. Effects of subarachnoid hemorrhage on cerebral blood volume, blood flow, and oxygen utilization in humans. J Neurosurg. 1977;46(4):446–453. doi: 10.3171/jns.1977.46.4.0446. [DOI] [PubMed] [Google Scholar]
- 234.Hino A, Mizukawa N, Tenjin H, Imahori Y, Taketomo S, Yano I, et al. Postoperative hemodynamic and metabolic changes in patients with subarachnoid hemorrhage. Stroke. 1989;20(11):1504–1510. doi: 10.1161/01.str.20.11.1504. [DOI] [PubMed] [Google Scholar]
- 235.Voldby B, Enevoldsen EM, Jensen FT. Regional CBF, intraventricular pressure, and cerebral metabolism in patients with ruptured intracranial aneurysms. J Neurosurg. 1985;62(1):48–58. doi: 10.3171/jns.1985.62.1.0048. [DOI] [PubMed] [Google Scholar]
- 236.Powers WJ, Grubb RL, Jr, Baker RP, Mintun MA, Raichle ME. Regional cerebral blood flow and metabolism in reversible ischemia due to vasospasm. Determination by positron emission tomography. J Neurosurg. 1985;62(4):539–546. doi: 10.3171/jns.1985.62.4.0539. [DOI] [PubMed] [Google Scholar]
- 237.Kawamura S, Sayama I, Yasui N, Uemura K. Sequential changes in cerebral blood flow and metabolism in patients with subarachnoid haemorrhage. Acta Neurochir (Wien) 1992;114(1–2):12–15. doi: 10.1007/BF01401107. [DOI] [PubMed] [Google Scholar]
- 238.Yundt KD, Grubb RL, Jr, Diringer MN, Powers WJ. Autoregulatory vasodilation of parenchymal vessels is impaired during cerebral vasospasm. J Cereb Blood Flow Metab. 1998;18(4):419–424. doi: 10.1097/00004647-199804000-00010. [DOI] [PubMed] [Google Scholar]
- 239.Yundt KD, Grubb RL, Jr, Diringer MN, Powers WJ. Cerebral hemodynamic and metabolic changes caused by brain retraction after aneurysmal subarachnoid hemorrhage. Neurosurgery. 1997;40(3):442–450. doi: 10.1097/00006123-199703000-00003. [DOI] [PubMed] [Google Scholar]
- 240.Noske DP, Peerdeman SM, Comans EF, Dirven CM, Knol DL, Girbes AR, et al. Cerebral microdialysis and positron emission tomography after surgery for aneurysmal subarachnoid hemorrhage in grade I patients. Surg Neurol. 2005;64(2):109–115. doi: 10.1016/j.surneu.2004.09.036. [DOI] [PubMed] [Google Scholar]