Abstract
Acoustomotive optical coherence elastography (AM-OCE), a dynamic and internal excitation optical coherence elastography (OCE) technique, is reported. Acoustic radiation force was used for internal mechanical excitation and spectral-domain optical coherence tomography (OCT) was used for detection. Mechanical properties of gelatin tissue phantoms were measured by AM-OCE and verified using rheometry results. Measured mechanical properties including shear moduli and shear damping parameters of the gelatin samples double when their polymer concentration increases from 3% to 4%. Spectral analysis was also performed on the acquired data, which improved the processing speed by a factor of five compared to a least square fitting approach. Quantitative measurement, micro-scale resolution, and remote excitation are the main features of AM-OCE, which make the technique promising for measuring biomechanical properties.
Biomechanical properties of living tissues are of great importance as they contribute to or are responsible for tissue health and disease, cellular and extra cellular structural integrity, and biological development. For example, biomechanical properties of the microenvironment play a vital role in tumor growth [1]. Therefore, being able to quantitatively determine the biomechanical properties of tissues and their microenvironment is significant, especially in vivo. There exist well-developed methods for biomechanical property measurements. For example, ultrasound and MRI elastography techniques have succeeded in measuring biomechanical properties at the scale of tissues or organs [2,3]. Atomic force microscopy has been used to determine tissue biomechanical properties from nanoscopic to microscopic scales [4]. Among these techniques, optical coherence elastography (OCE) has been well established for imaging and measurements at micron scales, which makes it suitable for studies of biomechanical properties of tissue microenvironments.
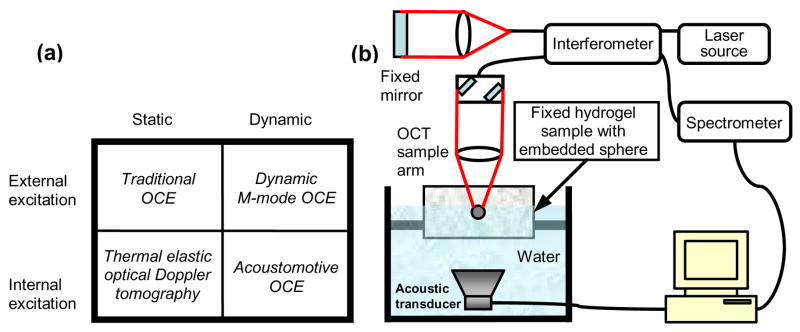
OCE is a novel elastography technology used to determine tissue biomechanical properties utilizing the in vivo imaging modality of optical coherence tomography (OCT) [5]. OCE techniques can be classified in different ways. Based on different spatial excitation characteristics, OCE techniques can be classified as internal excitation or external excitation, while based on different temporal excitation characteristics, OCE techniques can be classified as either static or dynamic, as shown in Fig. 1a. Most conventional OCE techniques utilize static and external excitation [6,7], but they often suffer from inaccuracies from speckle tracking algorithms [8]. Dynamic and external excitation OCE can be useful for quantitatively mapping tissue biomechanical properties without speckle tracking algorithms, but typically involved long processing times [8]. All these OCE studies using external excitation methods may suffer from an inability to maintain a sterile in vivo environment. Thermal elastic optical Doppler tomography was reported for measuring phantom mechanical properties, and this method can be classified as static with internal excitation OCE [9]. In this paper, we present acoustomotive OCE (AM-OCE), which is a dynamic and internal excitation OCE technique that is demonstrated for estimation of the mechanical properties of biomaterial phantoms. This technique utilizes acoustic radiation forces for internal mechanical excitation and OCT for detection. In contrast, photoacoustic tomography utilizes laser pulses for excitation and ultrasonic transducers for detection [10], but rarely has this technique been used for mechanical property measurements. Magnetomotive OCT also has the potential to be used as an elastography technique with dynamic and internal excitation [11]. To the best of our knowledge, this is the first experimental demonstration of a dynamic and internal excitation OCE technique.
Fig. 1.
(a) OCE classifications. (b)Schematic diagram of AM -OCE.
With similar mechanical properties to living tissues, gelatin-based phantoms (250 bloom strength, Type B gelatin, Rouselot, Buenos Aires, Argentina) were constructed for AM-OCE measurements. Gelatin powder and distilled water were heated in a water bath at a temperature between 62–68°C for one hour and periodically stirred. When the sample was cooled to 50°C, 0.1% weight-by-weight (w/w) formaldehyde was added and thoroughly mixed. Liquid gelatin was poured into the sample mold (diameter 7.5 cm, height 5.5 cm). A 1.5 mm stainless steel sphere was introduced just prior to gelling. Steel spheres were used as one of the typical models for microcalcifications mimicking stiff tissue lesions such as small tumors in ultrasound radiation force studies [12]. Samples were made with 3% and 4% w/w gel concentrations. Consequently, the congealed gels were homogenous except for isolated spheres. The spheres were positioned at the center of the phantom to minimize the influence of boundary effects on the measurement. OCE experiments were conducted after 1 day of gelation. It should be noted that AM-OCE measures the mechanical properties of the microenvironment surrounding inclusions (such as the tumor-mimicking sphere), rather than the mechanical properties of the inclusion. However, the mechanical properties of both the inclusion and the microenvironment would be inherently related.
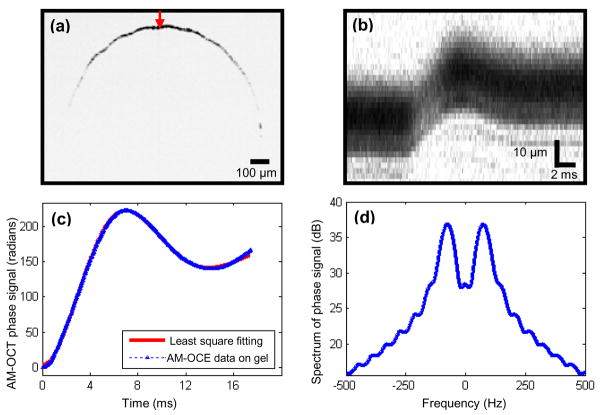
A spectral-domain OCT system was used in this study, using a Nd:YVO4-pumped titanium:sapphire laser source with a center wavelength of 800 nm and a bandwidth of 100 nm. The axial resolution was approximately 3 μm in the samples. A 12.5 mm diameter 40 mm focal length lens was used in the sample arm to provide a transverse resolution of 13 μm. The average power incident on the sample was 10 mW. A line camera with an acquisition rate of 25 kHz was used to detect the spectral interference signal. Acoustic radiation force was applied by a circular 19-mm-diameter f/1 PZT element transmitting sine-wave bursts of 100 ms at the resonant frequency of 1 MHz. The PZT element was synchronized with the OCT system in the form of step functions of radiation force, which was propagated into the samples. The sphere was positioned on the beam axis at the 24.5-mm radius of curvature of the ultrasound source. A schematic of the experimental setup is shown in Fig. 1b. A B-mode OCT image of the sphere is shown in Fig. 2a, in which the arrow denotes the position from where M-mode OCT images were acquired. In Figs. 2b and 2c, the amplitude and phase of an M-mode image are shown, respectively. The phase of the M-mode OCE image is proportional to the displacement of the sphere over time [8], and thus was used for the elastography analysis.
Fig. 2.
AM-OCE data analysis. (a) B-mode (Brightness mode) OCT image of a sphere embedded in tissue phantom. (b) Amplitude of M-mode OCT image of the sphere recorded at the position shown by the arrow in (a). (c) Phase of the M-mode OCT image and its fitting curve in time domain. (d)Power spectrum of (c).
The recorded OCE data were similarly analyzed, as described in our previous study [13]. In brief, we modeled the system comprised of a sphere embedded in gelatin as a Kelvin-Voigt body model with a mass, which can be expressed as mz̈(t) + γ0ż(t)+ k0z(t) = F(t), where k0 and γ0 represent a spring constant and a damping constant of the second order model, respectively, z is the uniaxial displacement function of the sphere, and m is the total mass on which the force acts, which is the sum of sphere mass and added mass of surrounding gel m′ = 2πa3 ρg/3, where a is the sphere radius and ρg is the gel density. F(t) denotes the driving step force. The M-mode OCT image, as shown in Fig. 2c, was fitted according to the solution of the above equation and k0 and γ0 were estimated through the least square fitting procedure. The shear modulus can be calculated as μ= K0/6πa. The shear damping parameter can be calculated as η = γ0/6πa.
Following this, spectral analysis was performed on the OCE data. A fast Fourier transform was performed on the time-domain OCE data, generating its power spectrum as shown in Fig. 2d. In the spectrum, the peak frequency corresponds to the resonant frequency of the system with damping ωd, which is related to k0 as k0 = m[ωd2 + (γ0/2m)2]. The -3dB bandwidth can be expressed as Δω = γ0/m. Thus, by measuring the peak frequency and the -3dB bandwidth, the material property shear modulus and shear damping parameter can be determined.
The material properties of the gels were verified independently through oscillatory rheometer experiments. Parallel plate shear experiments were conducted on an AR-G2 rheometer (TA Instruments, New Castle, USA). Circular specimens, 25 mm in diameter and 2–4 mm in height, were molded from the same gelatin used to make the large samples containing spheres. After 1 day of gelation, the specimens were removed from the molds and attached to parallel plate fixtures using cyanoacrylate (Rawn America, Spooner, WI, USA). Five percent strain was applied over a frequency range from 0.1 Hz to 10 Hz with 10 sample points per decade of frequency. For both concentrations of gelatin, the measured storage modulus was averaged over the test range.
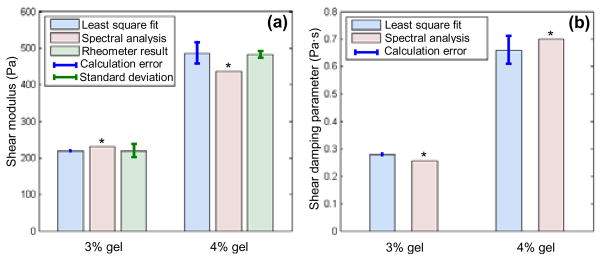
The AM-OCE results are shown in Fig. 3. In Fig. 3a, the shear moduli of the 3% and 4% gelatin samples measured by AM-OCE are plotted, including both least square fitting and spectral analysis results, as well as the rheometer results. The error bars for the AM-OCE least square fitting results represent the calculation errors, while the error bars for the rheometer results represent the standard deviations. It can be seen that the AM-OCE results for both samples correspond well with the well-established rheometer results. In Fig. 3b, the shear damping parameter results for the 3% and 4% gelatin samples measured by AM-OCE are shown, including both least square fit and spectral analysis results. From the results, we can see that both the shear modulus and shear damping parameters of the gelatin samples double when their concentration increases from 3% to 4%.
Fig. 3.
AM-OCE results on gelatin phantoms. (a) AM-OCE shear modulus. (b) AM-OCE shear damping parameter. * denotes no statistical or calculation error estimations.
In Fig. 3, no error estimation was made for the AM-OCE spectral analysis results. This is because the power spectrum, as in Fig. 2d, is derived from a single AM-OCE data measurement, with no statistical processing or fitting process performed. However, the processing time by the spectral analysis approach is about five times faster than by the least square fitting approach. Based on the post-processing procedure in Matlab (The Mathworks Inc.) and a processing sample number of 10, the processing time by the spectral analysis approach was approximately 1.4 s, while processing time by the least square fitting approach was approximately 7s. Comparing these two different analysis approaches, there is a ~5% calculation difference between them.
We have experimentally demonstrated a new AM-OCE technique which uses dynamic and internal acoustic radiation forces for mechanical excitation. Quantitative measurements of AM-OCE on gelatin-based phantoms were obtained and the results were verified with a commercial oscillatory rheometer. To investigate efficient processing procedures, AM-OCE data was processed using both a least square fitting and a spectral analysis approach. The spectral analysis of AM-OCE data is about 5 times faster than the least square fitting AM-OCE analysis. The AM-OCE technique avoids the inaccuracies caused by speckle tracking algorithms, and also has the feature of remote mechanical force excitation. Using the in vivo imaging capabilities of OCT for detection, this elastography technique has the potential for imaging biomechanical properties in vivo, such as for quantitatively measuring biomechanical properties of microenvironments around tumor development with micron-scale resolution. Acoustic radiation forces have been successfully applied for displacing small tumors that are stiffer than normal tissue (which we mimic with the embedded sphere) to enhance contrast in elastography for abdominal and breast cancers [14]. For OCE studies on samples without acoustically distinct inclusions, this acoustomotive method would still be applicable by using tightly focused acoustic waves [15]. Furthermore, the AM-OCE excitation force can be exerted from acoustic radiation originating from outside the body, which makes AM-OCE compatible with a wide range of OCT beam delivery techniques and promising for endoscopic, intravascular, and needle-based biomechanical property measurements.
Acknowledgments
This research was supported in part by grants from the National Science Foundation (BES 05-19920, S.A.B.) and the National Institutes of Health (NIBIB, 1 R01 EB005221, S.A.B.). Additional information can be found at http://biophotonics.illinois.edu.
Footnotes
OCIS codes: (110.4500) Optical coherence tomography; (120.7280) Vibration analysis; (170.7170) Ultrasound.
References
- 1.Huang S, Ingber DE. Cell tension, matrix mechanics, and cancer development. Cancer Cell. 2005;8:175. doi: 10.1016/j.ccr.2005.08.009. [DOI] [PubMed] [Google Scholar]
- 2.Wilson LS, Robinson DE, Dadd MJ. Elastography - the movement begins. Phys Med Biol. 2000;45:1409. doi: 10.1088/0031-9155/45/6/301. [DOI] [PubMed] [Google Scholar]
- 3.Sinkus R, Tanter M, Catheline S, Lorenzen J, Kuhl C, Sondermann E, Fink M. Imaging anisotropic and viscous properties of breast tissue by magnetic resonance-elastography. Magn Reson Med. 2005;53:372. doi: 10.1002/mrm.20355. [DOI] [PubMed] [Google Scholar]
- 4.Dimitriadis EK, Horkay F, Maresca J, Kachar B, Chadwick RS. Determination of Elastic Moduli of Thin Layers of Soft Material Using the Atomic Force Microscope. Biophys J. 2002;82:2798. doi: 10.1016/S0006-3495(02)75620-8. [DOI] [PMC free article] [PubMed] [Google Scholar]
- 5.Schmitt JM. OCT elastography: imaging microscopic deformation and strain of tissue. Opt Express. 1998;3:199. doi: 10.1364/oe.3.000199. [DOI] [PubMed] [Google Scholar]
- 6.Khalil AS, Chan RC, Chau AH, Bouma BE, Kaazempur MMR. Tissue elasticity estimation with optical coherence elastography: Toward mechanical characterization of in vivo soft tissue. Ann Biomed Eng. 2005;33:1631. doi: 10.1007/s10439-005-6766-3. [DOI] [PubMed] [Google Scholar]
- 7.Ko H, Tan W, Stack R, Boppart SA. Optical coherence elastography of engineered and developing tissue. Tissue Eng. 2006;12:63. doi: 10.1089/ten.2006.12.63. [DOI] [PubMed] [Google Scholar]
- 8.Liang X, Oldenburg AL, Crecea V, Chaney EJ, Boppart SA. Optical micro-scale mapping of dynamic biomechanical tissue properties. Opt Express. 2008;16:11052. doi: 10.1364/oe.16.011052. [DOI] [PMC free article] [PubMed] [Google Scholar]
- 9.Wang Q, Ahn Y, Kim C, Yu L, Jia W, Rao B, Chen Z, Chiang HK. Thermoelastic optical Doppler tomography of biological tissues. Proc SPIE. 2008;6847:68471B. [Google Scholar]
- 10.Xu M, Wang LV. Photoacoustic imaging in biomedicine. Rev Sci Instrum. 2006;77:041101. [Google Scholar]
- 11.Oldenburg AL, Crecea V, Rinne SA, Boppart SA. Phase-resolved magnetomotive OCT for imaging nanomolar concentrations of magnetic nanoparticles in tissues. Opt Express. 2008;16:11525. [PMC free article] [PubMed] [Google Scholar]
- 12.Urban MW, Kinnick RR, Greenleaf JF. Measuring phase of vibration of spheres in a viscoelastic medium using vibrometry. In: Andre MP, editor. Acoustical Imaging. Vol. 28. Springer; 2007. pp. 119–126. [Google Scholar]
- 13.Orescanin M, Toohey KS, Insana MF. Material properties from acoustic radiation force step response. J Acoust Soc AM. 2009;125:2928. doi: 10.1121/1.3106129. [DOI] [PMC free article] [PubMed] [Google Scholar]
- 14.Fahey BJ, Nelson RC, Bradway DP, Hsu SJ, Dumont DM, Trahey GE. In vivo visualization of abdominal malignancies with acoustic radiation force elastography. Phys Med Biol. 2008;53:279. doi: 10.1088/0031-9155/53/1/020. [DOI] [PMC free article] [PubMed] [Google Scholar]
- 15.Nightingale KR, Palmeri ML, Nightingale RW, Trahey GE. On the feasibility of remote palpation using acoustic radiation force. J Acoust Soc AM. 2001;110:1. doi: 10.1121/1.1378344. [DOI] [PubMed] [Google Scholar]


