Abstract
As the field of tissue engineering evolves, there will be an increasingly important need to visualize and track the complex dynamic changes that occur within three-dimensional constructs. Optical coherence tomography (OCT), as an emerging imaging technology applied to biological materials, offers a number of significant advantages to visualize these changes. Structural OCT has been used to investigate the longitudinal development of engineered tissues and cell dynamics such as migration, proliferation, detachment, and cell-material interactions. Optical techniques that image functional parameters or integrate multiple imaging modalities to provide complementary contrast mechanisms have been developed, such as the integration of optical coherence microscopy with multiphoton microscopy to image structural and functional information from cells in engineered tissue, optical coherence elastography to generate images or maps of strain to reflect the spatially-dependent biomechanical properties, and spectroscopic OCT to differentiate different cell types. From these results, OCT demonstrates great promise for imaging and visualizing engineered tissues, and the complex cellular dynamics that directly affect their practical and clinical use.
Keywords: engineered tissue, optical coherence tomography, functional imaging, microscopy, scaffolds
1. Introduction
Transplantation and autologous grafting are techniques used to replace failed organs or damaged tissues. These medical treatments have improved human health greatly, but are limited by factors such as availability of transplant organs and tissues, risk of transplant rejection, and the potential need for lifetime immunosuppression, with its many associated risks [1-3]. Tissue engineering is an established field and a hopeful solution which has attracted considerable interest for both clinical applications and basic scientific and technological research. Engineered tissues have the potential to organize and regenerate tissue, and eventually replace the tissues and organs that have failed or have been damaged [4]. Engineered tissues including skin, muscle, bone, cornea, neurons, cartilage, and vessels, among others, have found feasible applications [5, 6].
In engineered tissues, the intrinsic characteristics of cells, such as proliferation, organization and distribution, cell-cell and cell-substrate interactions, and formation of extracellular matrix (ECM), combine in complex ways to make a viable tissue replacement. Early types of engineered tissues used specific cell types as a source for populating scaffolds, such as smooth muscle cells, which are known to rapidly proliferate [7]. Recently, and with significant research efforts, stem cells are being used to provide an alternative means for generating engineered tissues by their ability to differentiate into cells to form other mesenchymal tissues such as bone, cartilage, muscle, marrow stroma, and others [8]. The engineered tissue scaffold is another key component, with a function to support and direct cells toward properly forming tissue, and to maintain a desired shape. Scaffolds can be prepared from natural material like collagen or from biomimetic materials [9-11]. Finally, the bioreactor serves an important role for engineered tissues by providing the microenvironment for operating and monitoring biological, biochemical, and biomechanical processes during engineered tissue development [12]. The cells, scaffold, and bioreactor all serve contributing roles in the development of engineered tissues. The process of development, however, is highly complex, dynamic, and inherently three-dimensional (3-D), and to more fully understand and ultimately control the development of engineered tissues, it will become increasingly important to monitor cells, scaffolds, and bioreactors using advanced imaging and visualization methods, preferably using noninvasive, real-time, high-resolution methods.
There have been many imaging modalities used for tissue engineering. For example, X-ray imaging and corresponding micro computed tomography (microCT) have been optimized for imaging engineered tissue scaffolds using a combinatorial method to minimize the use of contrast agents [13]. Magnetic resonance imaging (MRI) has been used to monitor mesenchymal stem cell differentiation in tissue engineering [14]. MRI has been used to image native anatomical sites to first define shapes of molds for engineered tissues, followed by microCT to validate the scaffold structure and composition prior to implantation [15]. Ultrasound elastography has been used to map the elasticity distribution of bulk engineered tissues [16]. However, the use of many of these imaging modalities remains problematic. X-rays in microCT are ionizing, which may induce cell damage. MRI is excellent for 3-D tissue imaging, but suffers from limited spatial resolution to study individual cells within scaffolds. Similar resolution limitations exist for ultrasound imaging.
Compared to the imaging modalities above, optical imaging methods can offer advantages of high resolution and non-invasive real-time imaging. A number of optical imaging methods have been applied to image engineered tissues. For example, Fourier Transform Infrared Spectroscopy (FTIR) has been used to monitor changes in molecular scaffold composition in engineered tissues including collagen, water and proteoglycans [17]. FTIR has also been used for the analysis of a melanoma model in engineered skin by characterizing the biochemical properties at different stages of engineered skin development [18]. FTIR, however, may suffer from the inability to image samples in vivo for tissue engineering applications. Confocal microscopes (CM) have widely been used for imaging engineered tissues [19, 20]. For this technology, pinholes are used to spatially reject out-of-focus light, allowing for optical sectioning. Three-dimensional volumes can be imaged to a depth of about 100 microns. Scaffolds based on photocured dimethacrylate polymers have been imaged by CM [21], and fluorescently-labeled neural cells have been imaged to monitor their functions over time [22]. In samples where fluorescence-labeling is impractical, reflectance CM can be performed, where tissue structure and cells can be imaged by collection of backscattered light [23]. The main limitation of CM in engineered tissue imaging, however, is the limited penetration depth, especially for highly scattering tissues. Multiphoton microscopy (MPM) is another optical imaging technology that has been used for engineered tissue imaging. Two-photon excitation is the most common nonlinear mechanism in MPM in which two photons are absorbed to excite a fluorescent molecule. MPM has been used to image a 3-D organotypic tissue model combined with another nonlinear imaging technology, second harmonic generation [24]. Using short-pulse laser sources, MPM usually extends the penetration depth of CM, but still is limited to 400-500 μm [25, 26].
Optical coherence tomography (OCT) is another optical imaging modality frequently used for imaging engineered tissues, offering non-invasive, label-free, real-time imaging with penetration depths on the order of several millimeters, depending on the optical properties of the sample. For example, OCT has been used to monitor both the scaffold and seeded cells in engineered bone tissue [27]. Pore size and porosity are important factors for scaffolds in tissue engineering, and these have been quantitatively estimated by analyzing OCT images of the scaffolds [28]. Optimization of scaffold design and composition for tissue engineering of tendon has been demonstrated using OCT [29]. Lung tumor cell growth in engineered membranes has been analyzed by OCT to investigate tumor cell growth and invasion [30]. Laser thermal injury and subsequent wound healing in engineered skin tissue has been imaged, and OCT images were compared with histological and multiphoton microscopy images [31]. In this paper, we focus on using OCT to investigate several of the fundamental issues of tissue engineering, including tissue development and organization, cell dynamics, and tissue mechanical properties. Structural OCT has been used to investigate how engineered tissue morphology and cell populations change over time, while functional OCT techniques have been used to extract information related to the elasticity, fluorescence, and spectroscopic properties of engineered tissues.
2. Optical coherence tomography
OCT was first introduced for imaging biological tissues in 1991 [32]. This technology combines interferometric techniques with broad-band near-infrared light sources and a transverse scanning mechanism through a focusing lens to achieve two dimensional (2-D) cross-sectional or 3-D imaging capabilities. For time-domain OCT (TD-OCT) systems, a low coherence near-infrared light source is split into two arms, namely reference and sample arms, using a beam splitter or fiber-optic coupler. As the reference arm mirror is moved, the path length between the two arms is changed and subsequently, the time delay is changed. When the time delay between the reference mirror and a scatterer in the sample is within the coherence time of the laser source, interference is detected at the output of the interferometer. When multiple scatterers are present along the axial (depth) direction in the sample, their locations can be spatially resolved due to their different time delays with respect to the reference arm. The acquired signal can be seen as convolutions of the point spread function and the scatterer distribution in the sample. By scanning the sample beam transversely, a 2-D image can then be formed. The axial resolution of OCT is determined by the coherence length of the light source while the transverse resolution is determined by the spot size of the incident beam. OCT is a non-invasive biomedical imaging modality which has been successfully applied clinically in ophthalmology to image morphological changes in the retina [33], and has also been utilized for imaging in other medical fields such as oncology, dermatology, cardiology, gastroenterology, and neurosurgery, to name only a few [34-37].
A lab-based TD-OCT system was one type of system used for studies reported in this paper, with its schematic shown in Figure 1. In this system, the low-coherence light source consisted of a neodymium-doped yttrium orthovanadate (Nd:YVO4) pumped titanium:sapphire laser, which has a center wavelength of 800 nm and a bandwidth of 100 nm, providing an axial resolution of approximately 3 μm in tissue. A lens with a diameter of 12.5 mm and a focal length of 20 mm was used in the sample arm to provide a focused spot with a transverse resolution of approximately 10 μm. The average power incident on the samples was typically 10 mW. A galvanometer-driven reflector scanning a distance of 2 mm at a rate of 20-30 Hz was used as delay line in the reference arm. The interference fringes were detected by photodiodes.
Figure 1.
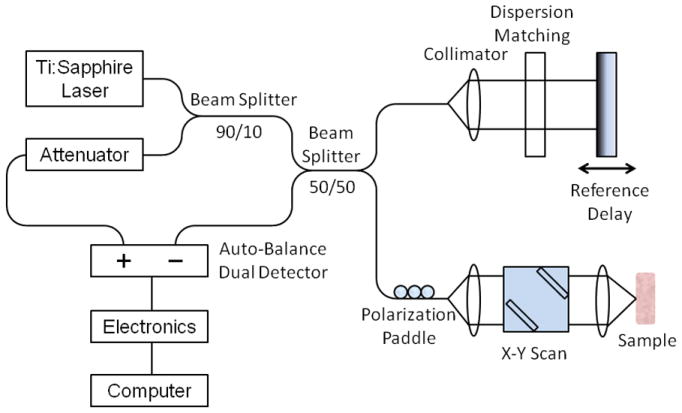
Schematic diagram of a time-domain OCT system used in the studies.
3. Imaging engineered tissues using OCT
3.1 Imaging structural development of engineered tissue
OCT was used to image microstructural features of engineered tissues during development, and was compared with imaging results from CM, scanning electron microscope (SEM), and histology on the same sample [38]. In this OCT study, we investigated 3-D microstructure and cell activities during the growth of engineered tissues. Fibroblast cells transfected with a green fluorescent protein (GFP)–vinculin plasmid were seeded in a porous chitosan scaffold. A portable microincubator (LU-CPC, Harvard Apparatus, Holliston, MA) was used for long-term cell culture in OCT and CM imaging, while SEM and histology images were acquired and processed after fixing the engineered tissue.
The stages of engineered tissue development were clearly identified, according to images acquired on days 1, 3, 5, 7, and 9, as shown in Figure 2a to e. The corresponding histology images were shown in Figure 2f to j. From the OCT images, it is clear that during day 1, cells and extracellular matrices appeared as small highly backscattering regions, compared to the chitosan scaffold, which is not shown in the image because of smaller unresolvable scaffold wall sizes (typically less than 5 μm), which are also likely index-matched to the culture media. On days 3 and 5, cells became more uniformly distributed throughout the chitosan scaffold, with increasing cell number and matrix density. On days 7 and 9, cells migrated and became more concentrated within the top 100-200 μm of the engineered tissue, and were sparse in the deeper scaffold regions. This response is likely due to the reduction of media nutrients and/or the accumulation of waste products within the scaffold. This trend was validated by histological images at each time-point. This data demonstrates the use of OCT for longitudinally monitoring the dynamics of cell populations within non-transparent engineered tissues over time. However, due to the resolution of this OCT system, the morphology of individual cells could not be resolved in these OCT images. Compared with CM images on the same sample, OCT images provided significant deeper imaging penetration (2 mm versus 150 μm), which also closely matched the observation depth shown in the histological images.
Figure 2.
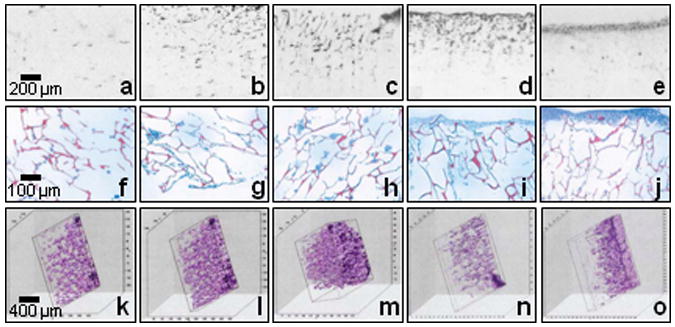
Two-dimensional OCT images (a-e), their corresponding histological images (f-j) and three-dimensional OCT images under different stages of engineered tissue development: day 1 (a, f, k, l, and m), day 3 (b and g), day 5 (c, h, and n), day 7 (d, i, and o), and day 9 (e and j).
Three-dimensional OCT images were also acquired and reconstructed to better interpret the structural changes in engineered tissues. By using reconstruction software (Slicer Dicer; Pixotec), cross-sectional OCT images with 20-μm interval spacing were reconstructed for 3-D OCT images, as shown in Figures 2 k-o. Figures 2 k-m denote 3-D images of the engineered tissue on day 1, reconstructed with 6, 12 and 50 cross-sectional OCT images, respectively. Figures 2 n and o show 3-D images of the engineered tissue on day 5 and 7, respectively. These provided more details about the interior of the engineered tissue, which could subsequently be viewed from arbitrary sectioning planes at any angle and direction (-60° y, 20° z, and 70° x angles used in 3-D images of Figure 2). From the 3-D images, a porous microarchitecture was identified, which accounts for the time-dependent cell distribution phenomena. However, at longer culture times, this structure disappeared on the surface of the sample due to the continuously deposited matrix from the fibroblasts, the major matrix-secreting cells, which filled the scaffold pores. From these results, 3-D OCT images demonstrated the ability to reveal more details about the complex 3-D microstructure and morphology during engineered tissue development.
3.2 Imaging cell dynamics in engineered tissue
In addition to obtaining structural information from engineered tissue, OCT has also been applied for imaging cell dynamics in engineered tissue [39]. In this study, NIH 3T3 fibroblast cells (American Type Culture Collection [ATCC], Manassas, VA), green-fluorescent-protein (GFP)-vinculin transfected 3T3 fibroblasts, and mouse macrophages were used. Four aspects of cell dynamics were monitored in this study: migration, proliferation, detachment, and cell-material interactions.
For the cell migration study, Matrigel-based invasion assays were used as a representative method of in vivo events. The same portable microincubator described earlier was used during the entire imaging study to ensure the cells remained under optimal physiological conditions. In the microincubator, a custom-made two-chamber system constructed from a modified Boyden migration chamber design [40] was used to hold porous filters coated with a 3 mm-thick layer of Matrigel. The upper chamber was seeded with macrophage cells that had been starved for 12 hours, while the lower chamber contained a macrophage chemoattractant, 100 nM of monocyte chemo-attractant protein-1 (MCP-1, Research Diagnostics Inc, NJ). Three-dimensional OCT images were acquired, and by analysis of cell position over time, cell migration direction and velocity were determined, which on average was toward the chemoattractant at a velocity of 0.67 μm/min. Individual cells were tracked by this method, and the cell migration velocity was noted to decrease after 2 hours of migration. This study was subsequently validated by CM images.
For the cell proliferation study, 3T3 fibroblasts seeded in Matrigel were used as the tissue model. The engineered tissue was cultured in a standard incubator and removed for OCT imaging on days 0, 4, and 8. Both 2-D and 3-D OCT images were acquired, as shown in Figure 3a to f. From the OCT images, cell clusters or aggregates were observed, and their scattering volumes in 3-D images could be used as quantitative indicators of proliferation. These results were validated by corresponding histological images taken from similar samples.
Figure 3.
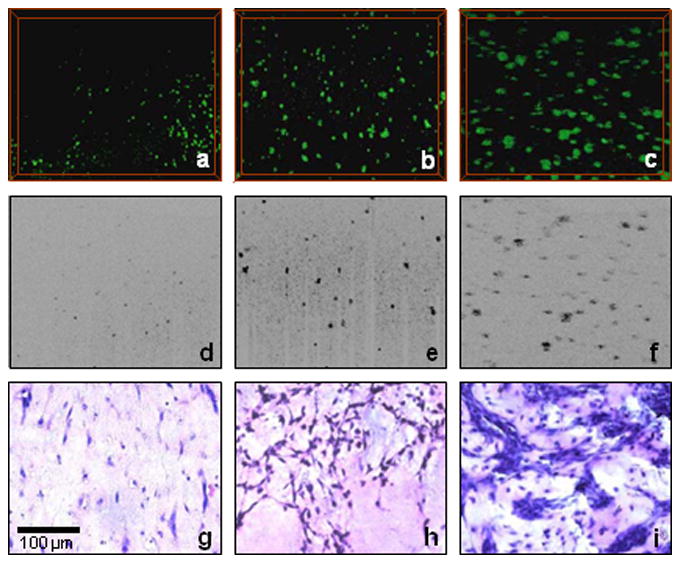
Three-dimensional (a-c) and two-dimensional (d-f) OCT images and corresponding histological images (g-i) of cell proliferation in 3-D scaffolds at different stages of development: day 0 (a, d, and g), day 4 (b, e, and h), and day 8 (c, f, and i). Scale bar applies to all images.
For the cell detachment study, 3T3 fibroblasts in a 3-D calcium phosphate scaffold (BD Bioscience, Bedford, MA) were used. For a low cell density model, the tissue was cultured for 3 days and imaged by OCT from 10 minutes to 16 minutes after being immersed in the solution of 0.25% trypsin/EDTA. No obvious difference was noticed in this case. However, a similar experiment was done on a high cell density model, which was cultured for 10 days. An apparent detachment of the cell-layer sheet from the scaffold was observed from 20 to 30 minutes after immersing the tissue in the trypsin solution. The results were explained by the fact that trypsin affected the cell-scaffold adhesion, but not the cell-matrix adhesion.
For the cell-material interaction study, tissue models were fabricated using GFP-vinculin transfected fibroblasts cells seeded on flexible poly-dimethyl-siloxane (PDMS) microtextured substrates, which included an array of parallel microgrooves (30 μm × 30 μm × 40 μm) and an array of microgrooves (10 μm × 10 μm) with spacing varying from 5 μm to 20 μm. OCT was capable of imaging and demonstrating morphological differences in cell-material interactions due to the topographical microstructures. For microstructures larger than a single cell, OCT images showed cells spreading and extending to the bottom of the microgrooves, while for microstructures smaller than a single cell, OCT images showed cells aggregating on top of the microgrooves, due to difficulty in forming initial attachment and aggregation. These results were validated by CM and phase contrast microscopy.
With these studies, we demonstrated the feasibility of OCT for imaging and tracking cell dynamics in engineered tissue, namely cell migration, proliferation, detachment, and cell-material interactions. This four dimensional (3-D over time) quantitative method is likely to contribute significantly to understanding complex cell behaviors in the field of tissue engineering.
4. Imaging engineered tissue using functional OCT
As discussed, OCT imaging based on the detection of backscattered light from tissues had been used successfully to not only visualize engineered tissues in bulk, but also to investigate the cell dynamics occurring within these structures. However, in certain circumstances, the endogenous scattering contrast arising from the optical index changes within cells and scaffolds may not be sufficient to differentiate features. Thus, many variants of OCT have been developed such as Doppler, polarization-sensitive, and spectroscopic OCT, and these techniques have been combined with other optical imaging modalities in interesting ways. Integrated with a multiphoton microscope, OCT can provide a wider range of complementary information and lead to the acquisition of more functional information from additional sources of contrast. For example, Doppler OCT was used to monitor and analyze a bioreactor containing engineered tissue in vitro, in which flow characteristics were retrieved [41]. In this paper, we focus on three types of these studies, namely integrated optical coherence and multiphoton microscopy (OCM/MPM), optical coherence elastography (OCE) and spectroscopic OCT (SOCT), and their applications in tissue engineering.
4.1 Imaging engineered tissues using integrated optical coherence and multiphoton microscopy
Optical coherence microscopy combines coherence gating and rejection of multiply-scattered photons with the spatial optical sectioning capabilities of confocal microscopy, resulting in high sensitivity, high contrast, en face imaging at greater depths in highly-scattering tissues [42]. In this integrated microscope system, OCM images represent optical backscatter information from the microstructure of samples while MPM images represent functional parameters from endogenous autofluorescent molecules, fluorescently-labeled probes, or genetically-expressed fluorescent proteins. Both structural and functional images were acquired simultaneously and co-registered. The experimental setup of the integrated microscope is shown in Figure 4. The laser source and interferometric detection for OCM are similar to those used in spectral-domain OCT, except a 0.95 numerical aperture (NA) objective lens was used in the sample arm. A photomultiplier tube was used for detection of two-photon fluorescence. The en face sections are about 0.5 μm thick for MPM images, depending on the laser intensity, and 2.2 μm thick for OCM images, depending on the confocal parameter of the focusing objective.
Figure 4.
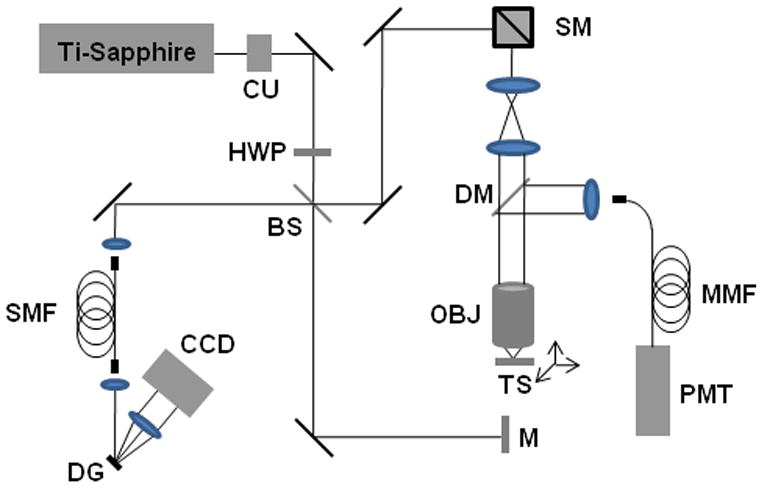
Experimental setup for the integrated optical coherence and multiphoton microscope (OCM/MPM). Abbreviations: BS, beam splitter; CCD, charge-coupled line-scan camera; CU, collimating unit; DM, dichroic mirror; DG, diffraction grating; HWP, half-wave plate; M, reference-arm mirror; MMF, multimode fiber; OBJ, objective; PMT, photomultiplier tube; SMF, single mode fiber; SM, scanning mirrors.
Typical OCM/MPM image sets are presented in Figure 5, showing GFP-vinculin fibroblasts seeded on a microtextured (micropeg) substrate. Figures 5a and 5d are OCM images showing both cells and substrates based on their backscattering properties while Figures 5b and 5e are MPM images showing nuclei (blue channel) and GFP-vinculin (green channel), denoting functional cell-cell or cell-substrate adhesions. Based on these observations, particularly the functional properties revealed by GFP-vinculin expression, it is suggestive that in Figures 5c and 5f the combination of these two optical modalities can provide not only cell morphology, but also information about the scaffold microstructure and cell-scaffold interactions in engineered tissues.
Figure 5.
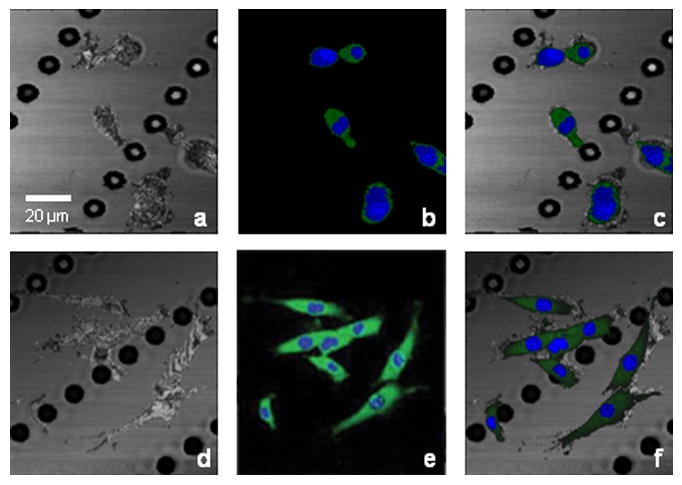
Integrated OCM/MPM imaging of GFP-vinculin fibroblasts seeded on a microtextured substrate under static (a-c) and dynamic (d-f) culture. (a) and (d) OCM images showing both cells and substrate. (b) and (e) MPM images showing nuclei (blue channel) and GFP-vinculin (green channel) denoting cell-cell and cell-substrate adhesions. (c) and (f) Multimodal images of combined OCM/MPM showing structural and functional relationships between cells and substrate/scaffold. The white arrow indicates the direction of stretching. Scale bar applies to all images.
The OCM/MPM system was used to image single cells and small populations of cells under mechanical stimulations [43], also shown in Figure 5. The same engineered constructs shown in Figures 5 a-c were mechanically stimulated by 18 hours of 5% cyclic uniaxial sinusoidal mechanical stretching at a frequency of 1 Hz. OCM, MPM and the combined OCM/MPM images are shown in Figures 5d, 5e, and 5f, respectively. Compared to the images before mechanical stimulation, cells appear elongated with a higher level of GFP-vinculin expression, which suggests a mechanically-induced increase in cell-substrate interactions.
Cellular responses to mechanical stimulations were also studied in 3-D scaffolds. Primary muscle fibroblasts derived from transgenic GFP mice, and GFP-vinculin fibroblasts, were cultured in Matrigel and used in two types of engineered tissues. Three-dimensional images of engineered tissues cultured under static conditions (Figures 6 a and b) were compared with those cultured under dynamic conditions (Figures 6 c and d). For the primary muscle fibroblasts in Matrigel, the cells in this engineered tissue became densely packed and aligned along a direction parallel to the stretched axis after mechanical stimulation, as shown in Figures 6 a (before stimulation) and 6c (after stimulation). However, for the GFP-vinculin fibroblasts in Matrigel, the cells did not show a significant degree of adhesion to the collagen-based scaffold after dynamic mechanical stimulation, and the cells appeared more spherical in shape, as shown in Figures 6b (before stimulation) and 6d (after stimulation). This may be due to a lack of certain transmembrane protein receptors that are available to bind to the Matrigel proteins. Matrigel, lacking collagen I, may also contribute to a reduced amount of cell-scaffold adhesions and subsequently, the reduced GFP-vinculin expression.
Figure 6.
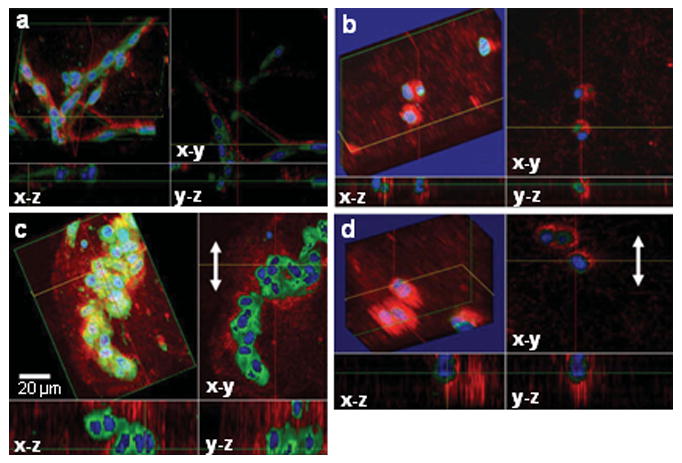
Three-dimensional OCM/MPM images of fibroblasts from a transgenic GFP mouse cultured in a Matrigel scaffold and GFP-vinculin fibroblasts seeded in a 3-D Matrigel scaffold cultured under static (a and b) and dynamic (c and d) conditions. The white arrow indicates the direction of stretching. Scale bar applies to all images.
4.2 Imaging engineered tissues using optical coherence elastography
Optical coherence elastography is a novel elastography technique used to determine tissue biomechanical properties. In this technique, mechanical stimulations are applied to biological tissues with simultaneous OCT detection to determine biomechanical properties of the sample. Micron scale resolution, several millimeters of imaging penetration, and non-invasive imaging are the main features for OCE. The first use of OCE was reported in 1998 [44]. In this study, OCE system hardware and theory of operation were described, and internal sample displacements indicating biomechanical properties of gelatin phantoms, pork tissue, and in vivo skin were shown using a 2-D cross-correlation speckle tracking algorithm. OCE techniques have been widely applied in different fields for making biomechanical property measurements, such as from the arterial wall and in atherosclerotic plaques using intravascular methods [45, 46].
For engineered tissues, biomechanical properties largely depend on the scaffold composition, the populated cells, the developing extracellular matrix, and the cell-substrate interactions. It is recognized that the mechanical properties affect metabolic performance and gene expression in certain tissues [47, 48], and cell physiology and interactions can reciprocally affect the mechanical properties of the tissue microenvironment. Thus, it is of great importance to measure the changing biomechanical properties in developing engineered tissues, not only for in vitro constructs, but also for future monitoring of engineered tissues following grafting into hosts using in vivo elastography methods.
An OCE system was constructed and based on the TD-OCT system described above [49]. In the sample arm, a glass slide was used as a rigid upper boundary and a translation stage was used to compress engineered tissues against the rigid glass slide in 2 μm increments. OCT images were acquired after each compression step and a cross-correlation algorithm was used for determining strain maps of the sample, a common elastography technique to characterize tissue mechanical properties [50]. The engineered tissue in this study was composed of two sections (Fig. 7), the left section contained NIH-3T3 fibroblasts (ATCC) seeded in a 3-D collagen matrix along with 6 μm diameter polystyrene microspheres (Polyscience, Niles, IL) which served as additional scatterers for OCT imaging. The right section contained all of the same elements, with the exception of the cells.
Figure 7.
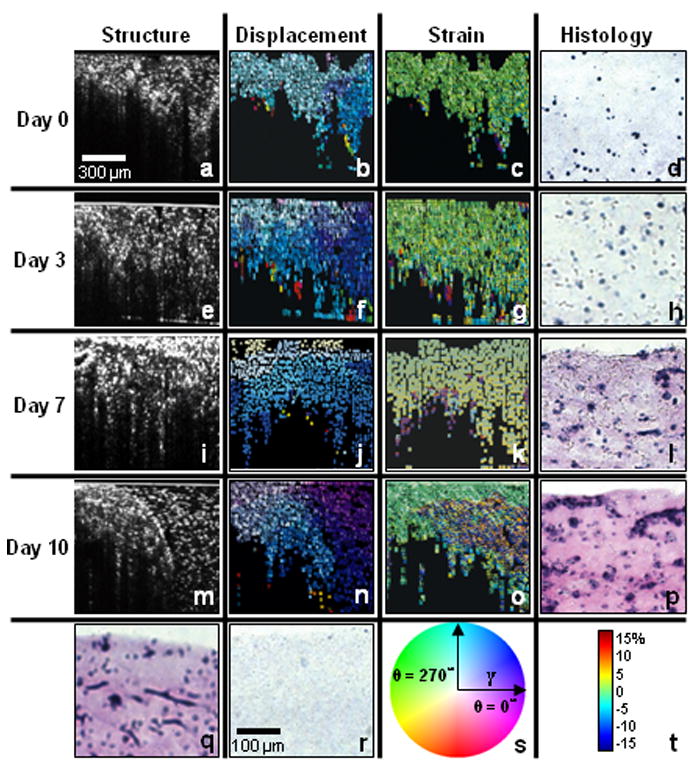
Optical coherence elastography of developing engineered tissue. Structural OCT images (a, e, i, and m), displacement maps (b, f, j, and n), strain maps (c, g, k, and o) and representative histological images (d, h, l, and p) of engineered tissues under different stages: day 0 (a-d), day 3 (e-h), day 7 (i-l) and day 10 (m-p). (q) Histological image of cells after 10 days of incubation without embedded microspheres. (r) Histological image of a cell-free scaffold and microspheres. (s) Color map with γ equal to 1.5 times the average displacement. (t) Color map for -20% to 20% strain map range.
Results from this study are shown in Figure 7. The first four rows of images correspond to incubation times of 0, 3, 7, and 10 days, with structural OCT images (Figure 7a, e, i and m), displacement maps (Figure 7b, f, j and n), and strain maps (Figure 7c, g, k and o) in each row. The last image in each row is the corresponding histological image of the cell-seeded section (Figure 7d, h, l and p) stained with hematoxylin and eosin. There were minimal differences in the structural OCT images between the left and right sections of the engineered tissue over the incubation time. However, from the displacement and strain maps, we can notice that there was less displacement and strain in the left section of the sample compared to the right section, especially after longer incubation times. This is primarily due to the increasing density of cells and extracellular matrix in the left section of the tissue over time, which resulted in a stiffening of the tissue, and reduced amounts of displacement and strain. These findings of increasing cell density and deposition of extracellular matrix were validated by the histological images, as evident by the increasing pink color from eosin staining of the extracellular matrix proteins.
4.3 Imaging engineered tissues using spectroscopic OCT
Spectroscopic OCT is based on the depth-resolved analysis of spectral information contained within the backscattered light returning from the sample. SOCT is enabled because of the broadband optical sources used in OCT. SOCT was first used to detect spectral-centroid shifts as an indicator of spectral modifications in an animal model [51]. Later SOCT techniques used depth-resolved backscattered spectra and tissue transfer functions to make quantitative measurements [52-55]. Represented in this paper, SOCT was combined with light scattering spectroscopy methods to provide spatially-resolved spectroscopic information from cells in engineered tissues [56].
A theoretical model was derived from a single scattering event in OCT for analyzing the spectroscopic signal. Engineered tissues with fibroblasts and macrophage cells cultured in 3 mm thick porous chitosan scaffolds for 2 days were analyzed in this study. Representative OCT and SOCT images of macrophage cells within this 3-D scaffold are shown in Figures 8a and b, respectively, while OCT and SOCT images of fibroblast cells are shown in Figures 8c and d, respectively. There are few differences between the OCT images of these two cell populations. However, there are distinct differences in the SOCT images. From these HSV-color reconstructed images, macrophage cells have more red-shifted centers, which correspond to narrower full-width 80% magnitude values of the spectral autocorrelation of the scattering signal. Fibroblast cells have more blue-shifted centers, which correspond to wider full-width 80% magnitude values of the spectral autocorrelation of the scattering signal. The spectroscopic differences are believed to be due to differences in the cell and organelle morphology between these two types of cells, specifically, differences in cell size, morphological features, nucleus size, and organelle distributions.
Figure 8.
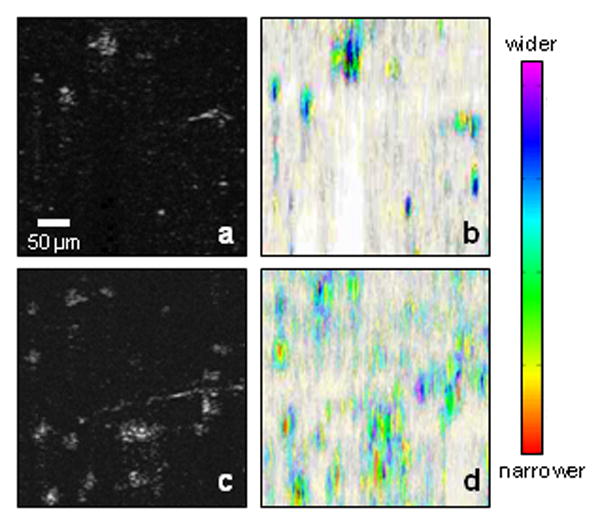
SOCT images of two types of cells in engineered tissues. (a) Structural OCT image of fibroblasts in a 3-D scaffold. (b) SOCT analysis of (a). (c) Structural OCT image of macrophages in a 3-D scaffold. (d) SOCT analysis of (c). The SOCT images are constructed using the HSV color scale. Central color differences are noted for each cell type, representing differing degrees of optical scattering from cell size, shape, nuclei size, and organelle distribution.
5. Discussion
OCT as a non-invasive, high resolution, real-time imaging modality has been widely used to image biological tissues for various applications. In this paper, we reviewed the ability and potential for OCT to image engineered tissues. Structural OCT was used to investigate engineered tissue development and cell dynamics. The results demonstrate the abilities of OCT to differentiate 3-D microstructure and morphology during engineered tissue development, and to detect and track cell dynamics including migration, proliferation, detachment, and cell-material interactions. Compared to traditional histological processes, OCT imaging provides features for real-time non-invasive monitoring to investigate engineered tissues. Compared to other imaging modalities such as MRI, ultrasound, microCT, and CM, OCT offers important advantages, and provides relatively high resolution with deep imaging penetration in highly-scattering engineered tissues.
As extensions for structural OCT, functional OCT techniques have also been successfully applied to imaging engineered tissues. OCM integrated with MPM was used to image en face and 3-D structural and functional information from various engineered tissues and cell-seeded substrates. OCE was used to generate strain maps of engineered tissues as an indicator of the biomechanical properties, an important capability, for use in bioreactors. Finally, spectroscopic OCT was used to differentiate two cell types in engineered tissues. Functional OCT techniques provide more information on the state of engineered tissue development. These imaging methods and results are likely to provide critical data for tissue engineering studies and serve as powerful tools for investigating the complex changes that occur during tissue organization and development.
Despite these advantages, there are some features of OCT which need further improvement for its use in tissue engineering. First, due to the typical resolutions achieved in OCT (5-10 μm), it is difficult to differentiate individual cell morphology in OCT images. From the representative OCT studies discussed in this review, small populations of cells were commonly observed, rather than individual cells with recognizable subcellular morphology. To address this problem, optical sources with wider bandwidths can be used to improve the axial resolution of OCT, while objective lenses with higher numerical apertures can be used to improve the transverse resolution, which were used in the OCM/MPM study. Second, in many of the studies cited, a time-domain OCT system was used, which is comparably slow for data and image acquisition. The acquisition speed, however, can easily be improved by factors of 10-1000 using state-of–the-art spectral-domain or swept-source OCT systems. Third, many of the studies discussed utilized OCT systems operating at 800 nm center wavelengths with broad bandwidths to maximize imaging resolution. OCT imaging penetration depths can be improved by using optical sources with longer (1300 nm) center wavelengths, which may be preferred when engineered tissues are comparably thicker and more highly scattering. Fourth, OCT may suffer from limitations in studying engineered tissues with certain collagen fiber scaffolds [39]. Collagen fibers may have similar optical scattering properties as some types of cells, which may reduce the contrast between the cells and the matrix, and may reduce the penetration depth of OCT imaging due to higher overall scattering. Furthermore, for high-resolution OCM/MPM, field-of-view may need to be improved for visualizing more of the tissue microenvironment.
In the future, OCT and its many variants are likely to contribute significantly to our understanding and use of engineered tissues. In our laboratory, we are investigating the development of engineered tissues, from early in vitro cell culture stages to later in vivo post-grafting stages using structural and functional OCT techniques. For example, in addition to the previously described in vitro studies, we have been imaging in vivo human skin using OCM/MPM, as shown in Figure 9. Results such as these demonstrate the potential to image epidermal and dermal layers of cells and structures not only in in vivo skin, but also in the developing engineered skin constructs after in vivo grafting to a host. Non-invasive visualization will be important at each stage of engineered tissue development because activities such as cell dynamics, cell-cell and cell-matrix interactions, and mechanical strain variations play critical roles in determining the processes and final performance of in vivo engineered tissues. The field of tissue engineering is addressing both the fundamental understanding of cell and tissue biology as well as the clinical challenges of human medicine. OCT offers the unique possibility to serve as a useful diagnostic technique for imaging cell dynamics at all stages, from in vitro culture conditions to in vivo host tissue responses.
Figure 9.
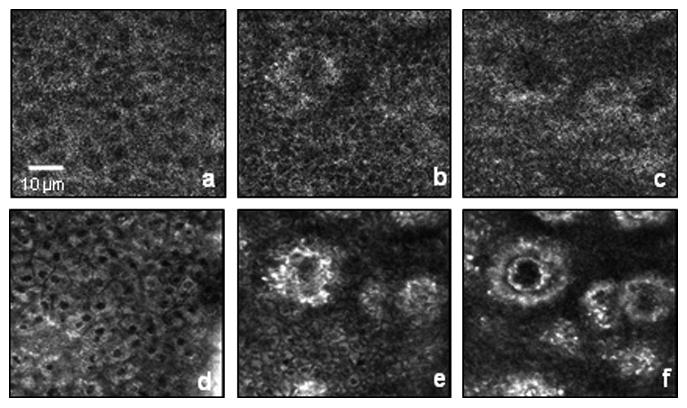
In vivo OCM (a-c) and MPM (d-f) images of epidermal and dermal human skin layers at depths of 25 μm (a and d), 50 μm (b and e), and 70 μm (c and f). The circular structures are dermal papillae projecting up into the epidermis, and imaged in cross-section at these en face planes.
Acknowledgments
We thank Dr. Wei Tan, a former researcher in our Biophotonics Imaging Laboratory, for her significant contributions to the results presented in this paper. We also thank Dr. Haohua Tu and Eric Chaney for their laboratory assistance with our optical imaging systems and our biological resources. This work was performed at the Beckman Institute for Advanced Science and Technology at the University of Illinois at Urbana-Champaign. This work was supported in part by the National Science Foundation (CAREER Award, BES 03-47747, and BES 05-19920, S.A.B.) and the National Institutes of Health (NIBIB, R01 EB005221, and Roadmap Initiative, NIBIB, R21 EB005321, S.A.B.). Additional information can be found at http://biophotonics.illinois.edu.
References
- 1.Shieh SJ, Vacanti JP. Surgery. 2005;137:1–7. doi: 10.1016/j.surg.2004.04.002. [DOI] [PubMed] [Google Scholar]
- 2.Lavik E, Langer R. Appl Microbiol Biotechnol. 2004;65:1–8. doi: 10.1007/s00253-004-1580-z. [DOI] [PubMed] [Google Scholar]
- 3.Atala A. Rejuvenation Res. 2004;7:15–31. doi: 10.1089/154916804323105053. [DOI] [PubMed] [Google Scholar]
- 4.Lysaght MJ, Reyes J. Tissue Eng. 2001;7:485–493. doi: 10.1089/107632701753213110. [DOI] [PubMed] [Google Scholar]
- 5.Schmidt CE, Leach JB. Annu Rev Biomed Eng. 2003;5:293–347. doi: 10.1146/annurev.bioeng.5.011303.120731. [DOI] [PubMed] [Google Scholar]
- 6.Metcalfe AD, Ferguson MW. J R Soc Interface. 2007;4:413–437. doi: 10.1098/rsif.2006.0179. [DOI] [PMC free article] [PubMed] [Google Scholar]
- 7.Lu SH, Wang HB, Liu H, Wang HP, Lin QX, Li DX, Song YX, Duan CM, Feng LX, Wang CY. Tissue Eng Part A. 2008 doi: 10.1089/ten.tea.2008.0187. [DOI] [PubMed] [Google Scholar]
- 8.Bianco P, Robey PG. Nature. 2001;414:118–121. doi: 10.1038/35102181. [DOI] [PubMed] [Google Scholar]
- 9.Ma PX. Adv Drug Deliv Rev. 2008;60:184–198. doi: 10.1016/j.addr.2007.08.041. [DOI] [PMC free article] [PubMed] [Google Scholar]
- 10.Wang Y, Kim HJ, Vunjak-Novakovic G, Kaplan DL. Biomaterials. 2006;27:6064–6082. doi: 10.1016/j.biomaterials.2006.07.008. [DOI] [PubMed] [Google Scholar]
- 11.Martina M, Hutmacher D. Polymer International. 2007;56:145–157. [Google Scholar]
- 12.Martin I, Wendt D, Heberer M. Trends Biotechnol. 2004;22:80–86. doi: 10.1016/j.tibtech.2003.12.001. [DOI] [PubMed] [Google Scholar]
- 13.Yang Y, Dorsey SM, Becker ML, Lin-Gibson S, Schumacher GE, Flaim GM, Kohn J, Simon CG., Jr Biomaterials. 2008;29:1901–1911. doi: 10.1016/j.biomaterials.2007.12.042. [DOI] [PMC free article] [PubMed] [Google Scholar]
- 14.Xu H, Othman SF, Magin RL. J Biosci Bioeng. 2008;106:515–527. doi: 10.1263/jbb.106.515. [DOI] [PubMed] [Google Scholar]
- 15.Ballyns JJ, Gleghorn JP, Niebrzydowski V, Rawlinson JJ, Potter HG, Maher SA, Wright TM, Bonassar LJ. Tissue Eng Part A. 2008;14:1195–1202. doi: 10.1089/ten.tea.2007.0186. [DOI] [PubMed] [Google Scholar]
- 16.Abraham Cohn N, Kim BS, Erkamp RQ, Mooney DJ, Emelianov SY, Skovoroda AR, O'Donnell M. IEEE Trans Ultrason Ferroelectr Freq Control. 2000;47:956–966. doi: 10.1109/58.852079. [DOI] [PubMed] [Google Scholar]
- 17.Boskey A, Pleshko Camacho N. Biomaterials. 2007;28:2465–2478. doi: 10.1016/j.biomaterials.2006.11.043. [DOI] [PMC free article] [PubMed] [Google Scholar]
- 18.Bhargava R, Kong R. Design and Performance Validation of Phantoms Used in Conjunction with Optical Measurements of Tissue. SPIE; San Jose, CA, USA: 2008. pp. 687004–687010. [Google Scholar]
- 19.Breuls RG, Mol A, Petterson R, Oomens CW, Baaijens FP, Bouten CV. Tissue Eng. 2003;9:269–281. doi: 10.1089/107632703764664738. [DOI] [PubMed] [Google Scholar]
- 20.Gareau DS, Bargo PR, Horton WA, Jacques SL. J Biomed Opt. 2004;9:254–258. doi: 10.1117/1.1645798. [DOI] [PubMed] [Google Scholar]
- 21.Landis FA, Stephens JS, Cooper JA, Cicerone MT, Lin-Gibson S. Biomacromolecules. 2006;7:1751–1757. doi: 10.1021/bm0600466. [DOI] [PubMed] [Google Scholar]
- 22.Mahoney MJ, Anseth KS. Biomaterials. 2006;27:2265–2274. doi: 10.1016/j.biomaterials.2005.11.007. [DOI] [PubMed] [Google Scholar]
- 23.Tachihara R, Choi C, Langley RG, Anderson RR, Gonzalez S. Dermatology. 2002;204:185–189. doi: 10.1159/000057879. [DOI] [PubMed] [Google Scholar]
- 24.Zoumi A, Yeh A, Tromberg BJ. Proc Natl Acad Sci U S A. 2002;99:11014–11019. doi: 10.1073/pnas.172368799. [DOI] [PMC free article] [PubMed] [Google Scholar]
- 25.Masters BR, So PT, Gratton E. Ann N Y Acad Sci. 1998;838:58–67. doi: 10.1111/j.1749-6632.1998.tb08187.x. [DOI] [PubMed] [Google Scholar]
- 26.So PT, Dong CY, Masters BR, Berland KM. Annu Rev Biomed Eng. 2000;2:399–429. doi: 10.1146/annurev.bioeng.2.1.399. [DOI] [PubMed] [Google Scholar]
- 27.Yang Y, Dubois A, Qin XP, Li J, El Haj A, Wang RK. Phys Med Biol. 2006;51:1649–1659. doi: 10.1088/0031-9155/51/7/001. [DOI] [PubMed] [Google Scholar]
- 28.Yang Y, Bagnaninchi PO, Wood MA, El Haj AJ, Guyot E, Dubois A, Wang RK. Optical Interactions with Tissue and Cells XVI. SPIE; San Jose, CA, USA: 2005. pp. 51–57. [Google Scholar]
- 29.Bagnaninchi PO, Yang Y, Maffuli N, Wang RK, El Haj A. Optical Interactions with Tissue and Cells XVII. SPIE; San Jose, CA, USA: 2006. p. 608419. [Google Scholar]
- 30.Yang Y, Sule-Suso J, El Haj AJ, Hoban PR, Wang R. Biosens Bioelectron. 2004;20:442–447. doi: 10.1016/j.bios.2004.02.030. [DOI] [PubMed] [Google Scholar]
- 31.Yeh AT, Kao B, Jung WG, Chen Z, Nelson JS, Tromberg BJ. J Biomed Opt. 2004;9:248–253. doi: 10.1117/1.1648646. [DOI] [PubMed] [Google Scholar]
- 32.Huang D, Swanson EA, Lin CP, Schuman JS, Stinson WG, Chang W, Hee MR, Flotte T, Gregory K, Puliafito CA, et al. Science. 1991;254:1178–1181. doi: 10.1126/science.1957169. [DOI] [PMC free article] [PubMed] [Google Scholar]
- 33.Toth CA, Narayan DG, Boppart SA, Hee MR, Fujimoto JG, Birngruber R, Cain CP, DiCarlo CD, Roach WP. Arch Ophthalmol. 1997;115:1425–1428. doi: 10.1001/archopht.1997.01100160595012. [DOI] [PubMed] [Google Scholar]
- 34.Schmitt JM, Yadlowsky MJ, Bonner RF. Dermatology. 1995;191:93–98. doi: 10.1159/000246523. [DOI] [PubMed] [Google Scholar]
- 35.Tearney GJ, Brezinski ME, Boppart SA, Bouma BE, Weissman N, Southern JF, Swanson EA, Fujimoto JG. Circulation. 1996;94:3013–3013. doi: 10.1161/01.cir.94.11.3013. [DOI] [PubMed] [Google Scholar]
- 36.Tearney GJ, Brezinski ME, Southern JF, Bouma BE, Boppart SA, Fujimoto JG. American Journal of Gastroenterology. 1997;92:1800–1804. [PubMed] [Google Scholar]
- 37.Tearney GJ, Brezinski ME, Southern JF, Bouma BE, Boppart SA, Fujimoto JG. Journal of Urology. 1997;157:1915–1919. [PubMed] [Google Scholar]
- 38.Tan W, Sendemir-Urkmez A, Fahrner LJ, Jamison R, Leckband D, Boppart SA. Tissue Eng. 2004;10:1747–1756. doi: 10.1089/ten.2004.10.1747. [DOI] [PubMed] [Google Scholar]
- 39.Tan W, Oldenburg AL, Norman JJ, Desai TA, Boppart SA. Opt Express. 2006;14:7159–7171. doi: 10.1364/oe.14.007159. [DOI] [PubMed] [Google Scholar]
- 40.Michna H. Cell Tissue Res. 1989;255:423–429. doi: 10.1007/BF00224127. [DOI] [PubMed] [Google Scholar]
- 41.Mason C, Markusen JF, Town MA, Dunnill P, Wang RK. Biosens Bioelectron. 2004;20:414–423. doi: 10.1016/j.bios.2004.03.035. [DOI] [PubMed] [Google Scholar]
- 42.Vinegoni C, Ralston T, Tan W, Luo W, Marks DL, Boppart SA. Applied Physics Letters. 2006;88:1–3. [Google Scholar]
- 43.Tan W, Vinegoni C, Norman JJ, Desai TA, Boppart SA. Microsc Res Tech. 2007;70:361–371. doi: 10.1002/jemt.20420. [DOI] [PubMed] [Google Scholar]
- 44.Schmitt J. Opt Express. 1998;3:199–211. doi: 10.1364/oe.3.000199. [DOI] [PubMed] [Google Scholar]
- 45.Chan RC, Chau AH, Karl WC, Nadkarni S, Khalil AS, Iftimia N, Shishkov M, Tearney GJ, Kaazempur-Mofrad MR, Bouma BE. Optics Express. 2004;12:4558–4572. doi: 10.1364/opex.12.004558. [DOI] [PubMed] [Google Scholar]
- 46.Rogowska J, Patel NA, Fujimoto JG, Brezinski ME. Heart. 2004;90:556–562. doi: 10.1136/hrt.2003.016956. [DOI] [PMC free article] [PubMed] [Google Scholar]
- 47.Birnholz JC, Farrell EE. Radiology. 1985;157:495–498. doi: 10.1148/radiology.157.2.3901109. [DOI] [PubMed] [Google Scholar]
- 48.Hunter CJ, Imler SM, Malaviya P, Nerem RM, Levenston ME. Biomaterials. 2002;23:1249–1259. doi: 10.1016/s0142-9612(01)00245-9. [DOI] [PubMed] [Google Scholar]
- 49.Ko HJ, Tan W, Stack R, Boppart SA. Tissue Eng. 2006;12:63–73. doi: 10.1089/ten.2006.12.63. [DOI] [PubMed] [Google Scholar]
- 50.Cespedes I, Ophir J, Ponnekanti H, Maklad N. Ultrason Imaging. 1993;15:73–88. doi: 10.1177/016173469301500201. [DOI] [PubMed] [Google Scholar]
- 51.Morgner U, Drexler W, Kartner FX, Li XD, Pitris C, Ippen EP, Fujimoto JG. Opt Lett. 2000;25:111–113. doi: 10.1364/ol.25.000111. [DOI] [PubMed] [Google Scholar]
- 52.Faber DJ, Mik EG, Aalders MC, van Leeuwen TG. Opt Lett. 2005;30:1015–1017. doi: 10.1364/ol.30.001015. [DOI] [PubMed] [Google Scholar]
- 53.Xu C, Ye J, Marks DL, Boppart SA. Opt Lett. 2004;29:1647–1649. doi: 10.1364/ol.29.001647. [DOI] [PubMed] [Google Scholar]
- 54.Xu C, Marks DL, Do MN, Boppart SA. Opt Express. 2004;12:4790–4803. doi: 10.1364/opex.12.004790. [DOI] [PubMed] [Google Scholar]
- 55.Xu C, Carney PS, Boppart SA. Opt Express. 2005;13:5450–5462. doi: 10.1364/opex.13.005450. [DOI] [PubMed] [Google Scholar]
- 56.Xu C, Carney PS, Tan W, Boppart SA. Imaging, Manipulation, and Analysis of Biomolecules, Cells, and Tissues IV. SPIE; San Jose, CA, USA: 2006. pp. 608804–608810. [Google Scholar]


