Abstract
Magnetic nanoparticles (MNPs) are increasingly important in magnetic resonance and biomedical optical imaging. We describe a method for imaging MNPs by detecting nanoscale displacements using a phase-resolved spectral-domain optical coherence tomography (OCT) system. Biological tissues and phantoms are exposed to ~800 G magnetic fields modulated at 56 and 100 Hz to mechanically actuate embedded iron oxide MNPs (~20 nm diameter). Sensitivity to 27 μg/g (~2 nM) MNPs within tissue phantoms is achieved by filtering paramagnetic from diamagnetic vibrations. We demonstrate biological feasibility by imaging topically applied MNPs during their diffusion into an excised rat tumor over a 2 hour time period.
1. Introduction
Magnetic nanoparticles (MNPs) composed of biocompatible iron oxides (magnetite, Fe3O4, or maghemite, γ-Fe2O3) exhibit magnetic susceptibilities χ that are typically >105 times larger than that of human tissue, including red blood cells [1,2]. Not surprisingly, this fact has led to the increasing development of MNP-related technologies in biology and medicine [3]. Heating of MNPs with high frequency magnetic fields is being investigated as a possible cancer treatment by inducing hyperthermia in tumors [4]. Concentrating MNPs within disease sites may be accomplished using magnetic field gradients to pull them within the body [5]. Molecular-based targeting has been demonstrated with antibody-conjugated MNPs which accumulate within mammary tumors in an animal model [6]. MNPs have even been used for stratifying cell layers in tissue engineering [4]. The ability to monitor the targeting and therapy of MNPs has therefore become increasingly important in biomedicine, which has been particularly successful in magnetic resonance (MR) imaging where MNPs are contrast agents [7]. The availability of new imaging techniques appropriate to the microscale such as optical coherence tomography (OCT) can elucidate processes such as diffusion, active transport processes, and in general, biodistribution and kinetics, which may be currently limiting our ability to target MNPs [3].
Optical coherence tomography is a three-dimensional microstructural biomedical imaging modality that utilizes the coherence property of light to optically range light scattering structures [8]. Various types of contrast agents have been developed for OCT which may enhance its biomedical utility by enabling molecular imaging [9,10]. The use of plasmon-resonant nanoparticles in OCT has been of particular interest as they exhibit extremely high optical scattering or absorption cross-sections [11–13]. Recently, a modulated OCT contrast method using plasmon-resonant nanoshells was demonstrated using the resonant photothermal heating of nanoshells to modulate the local refractive index [14]. Modulated OCT contrast is important to successfully achieve background rejection in highly scattering tissues. However, this method may be limited by cumulative heating in the tissue, and has yet to be demonstrated in a biological sample.
MNPs can be mechanically actuated with an externally applied magnetic field gradient, and novel magneto-optical particles have been designed for contrast in optical microscopy [15,16]. Magnetomotive OCT (MMOCT) is accomplished using an electromagnet which modulates a magnetic field within the tissue during OCT imaging [17]. This provides a mechanical displacement at the locations of MNPs in the tissue, which is observed as a shift in the OCT interferogram. MMOCT was first demonstrated in a cell scaffold containing a mixture of microparticle-labeled and unlabeled macrophage cells [17]. More recently, imaging of MNPs in the digestive tract of an in vivo African frog tadpole was shown [18]. Rejection of physiological motion for in vivo imaging was accomplished by acquiring two successive axial scans with the magnetic field off and a third with the field on, and comparing the signal changes between the on and off scans (magnetomotion) with those between the two off scans (physiological motion). However, these studies only tracked the amplitude of the OCT interference signal.
The use of optical phase to obtain sub-wavelength displacement sensitivity is very powerful for imaging biological samples [19]. A differential-phase OCT system was recently used to detect (but not image) the magnetomotion of MNP-laden macrophages in an animal model [20]. In the work described here, we present a new MMOCT system using a spectral-domain OCT system which provides sufficient phase sensitivity for phase-resolved imaging. Because it takes time for tissue to mechanically relax, the previous method of acquiring 3 successive axial scans in each location is not feasible if faster imaging times are required, such as for three-dimensional in vivo imaging. Therefore, in this system, the magnetic gradient force is modulated sinusoidally during a B-mode image frame, and background rejection is accomplished by acquiring an a priori image frame with the magnetic field off. To demonstrate biological relevance, we image the diffusion of MNPs into excised tumors from a rat model for human breast cancer; this model has been shown to be most similar to estrogen receptor-positive ductal carcinomas [21].
2. Theory
In this section, we will first describe the basis for mechanical motion of MNPs in biological media and how magnetomotion is driven in our system. Then we will explain how OCT is used to detect this motion, and how the data is collected and processed to produce images with magnetomotive contrast.
2.1 Magnetomotion in biological tissues
In our MMOCT system the magnetic field is applied using a solenoid, and imaging is performed on the sample immediately below the solenoid bore. By allowing the beam to pass through the central bore, in vivo imaging and imaging of thick tissues is possible, unlike other geometries [20] that use a central ferrite tip to concentrate the magnetic field gradient. Our geometry is such that, within the imaging volume, the radial components of the magnetic field are negligible and the magnetic field gradient is dominantly in the axial direction. In the following analysis we will therefore neglect the radial components and write forces F, magnetic fields B, and magnetizations M as one-dimensional entities which are essentially the axial (z) components of their true vector forms.
The force Fp on an MNP with volume Vp and volume magnetization Mp arising from an applied magnetic field B with a gradient along z can be written as:
| (1) |
We assume for simplicity that the magnetic field is unmodified by the magnetization within the sample (B=μ0H), and that the magnetic field does not fall off appreciably within our imaging depth (B(z)=B(0)). Analogous to Eq. (1), the tissue medium also experiences a force depending on its volume magnetization Mm and volume Vm. Thus, the net force Ftot on a tissue volume element V with embedded MNPs of number density Np can be written:
| (2) |
assuming the MNPs occupy a small fractional volume so that V≈Vm. The response from human tissue is typically diamagnetic [1], so that Mm will have a sign opposite to that of the superparamagnetic MNPs Mp. Thus, there is a certain “critical” particle volume density ρcrit at which the force from the MNPs exactly balances the opposing force from the tissue (Ftot=0):
| (3) |
We note that this equation looks the same when written in terms of a mass density and mass magnetization. Therefore, when the tissue is loaded with an MNP concentration greater than ρcrit, its net response will appear paramagnetic (motion toward B·∂B/∂z), and for concentrations less than ρcrit its motion will appear diamagnetic. As we will discuss below, discriminating the overall direction of motion (diamagnetic vs. paramagnetic) can improve the sensitivity of an MMOCT system.
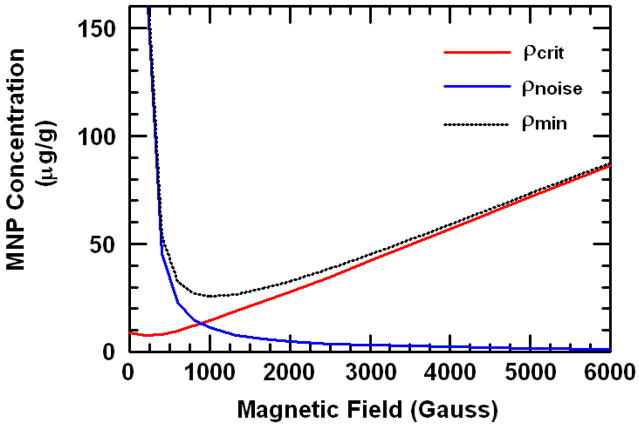
For a weakly magnetic medium, Mm is linear in B for B less than several Tesla. However, MNPs reach saturation at sub-Tesla magnetic fields, so Mp is more accurately described by the Langevin function. This saturation in the denominator of Eq. (3) results in an increasing critical nanoparticle density ρcrit with increasing B, as shown in Fig. 1. For magnetic fields sufficiently below saturation (less than ~500 G for our MNPs), Mp(B) is still linear, and ρcrit is near its minimum value of ~8 μg/g in silicone-based tissue phantoms.
Fig. 1.
Theoretical MNP densities ρcrit, ρnoise, and ρmin according to Eqs. (3) and (7). SQUID magnetometry measurements of the MNPs and tissue phantom silicone medium were used to generate the curves. The unknown scaling factor for ρnoise was estimated from the experimental results.
In this regime of low B, the Fp from Eq. (1) is proportional to the square of the applied magnetic field B. Therefore, in order to induce a temporally modulated force that is a pure sinusoid, we chose to drive our electromagnet with the following voltage waveform V(t):
| (4) |
where fB is the modulation frequency, V0 is the peak voltage, and B(t) is linearly proportional to V(t) (with negligible inductance for fB < 10kHz). The offset is chosen to allow for the use of a unipolar power supply, which can be helpful when driving high currents. If the induced forces are sufficiently small, the system responds mechanically in a linear (Hookean) way such that the displacement Δz(t) can be written:
| (5) |
where A is the maximum amplitude of the displacement and ϕ is the mechanical phase lag. The amplitude A will be determined by Ftot which is linear in the concentration of MNPs according to Eq. (2), and also by the viscoelastic properties of the medium. Previous data suggests that A is linear with respect to the MNP concentration [18]. Thus, A can be used as a relative metric of MNP concentration. If the viscosity of the medium can be ignored, the value of ϕ will equal zero for a paramagnetic system (aligned motion) and π for a diamagnetic system (opposed motion). However, even in media with significant viscosity, one would expect to observe a shift of π when comparing para- and dia-magnetic media. In this way ϕ can be used to determine the direction of Ftot.
From the measured mechanical phase lag ϕ for a position in the tissue r⃗, we can design a normalized cosine filter f̂ which suppresses diamagnetic signals as follows:
| (6) |
This filter is multiplied pointwise with the magnetomotive signal at each pixel in order to select the locations in the image exhibiting paramagnetic motion. It will be applied in the following subsection.
Finally, this all can be related to a minimum detectible concentration of MNPs, ρmin. We define ρmin as that required to achieve a certain minimum MNP displacement amplitude Amin in order to overcome the OCT system hardware noise. In a Hookean system where A is proportional to Ftot, we can solve for ρmin using Eqs. (1)–(3) as follows:
| (7) |
where Em is an effective dynamic modulus of the medium at fB which takes into account the viscoelastic properties of the relevant region around the imaging volume, c is a scaling factor depending on the geometry of the sample and magnetic field, and ρnoise is the additional MNP concentration needed to detect magnetomotion above the OCT system noise. ρnoise is inversely proportional to the force on the particles Fp. It is plotted in Fig. 1 for our MNPs, where the scaling factor AminEm has been estimated based on our experimental results in Section 4. The resulting estimate of ρmin is also shown in Fig. 1. We see that the optimum choice of B (that which minimizes ρmin) is a tradeoff between a sufficiently low B to not saturate the MNPs and keep the motion paramagnetic (reducing ρcrit), but sufficiently high B to induce enough force to displace the MNPs (reducing ρnoise). This choice is both OCT system- and sample-dependent. We note that this analysis is performed for homogeneous tissue phantoms; inhomogeneous media such as a subvolume of MNPs within the imaging region may require a higher ρmin.
What is the sensitivity in the case where the mechanical phase filter (Eq. (6)) is not used to discriminate paramagnetic from diamagnetic motion? In this case, a priori knowledge of A for the sample in the absence of MNPs would be needed, and Amin would then be defined as a certain number of standard deviations above or below the native A of the medium. This can rapidly become complicated, because A is a function of both magnetization Mm and elastic modulus Em of the medium, both of which may be spatially varying. Also, assuming the medium is diamagnetic, MNPs at exactly 2ρcrit give rise to the same A as without MNPs, and thus would be indistinguishable from control. In this case we could predict a lower bound on ρmin of 2ρcrit. In essence, we use the mechanical phase filter here because it reduced the need for a priori information to a binary question of whether the medium is diamagnetic or not, and, as will be shown empirically below, it greatly improved the sensitivity of our particular MMOCT system, even in highly controlled, spatially homogeneous tissue phantoms.
2.2 Coherence imaging of magnetomotion
Spectral interferometry is used to obtain the complex-analytic time-domain signal S̃(τ), which is the mutual coherence function of the electric fields from a reference arm ER and biological sample ES (delayed by time τ with respect to one another). S̃(τ) is obtained by Fourier transformation  of the measured spectral interferogram S(ω) after background subtraction of the reference field intensity |ER(ω)|2 according to the Wiener-Khintchine theorem:
| (8) |
where ω is the angular frequency of the light and the backscattered intensity from the sample |ES(ω)|2 is negligible. For simplicity, the two-dimensional B-mode complex analytic signal is written as S̃(x, z), where the sample depth z = ωτ/k and k is the wave vector in the sample, and the transverse coordinate x is sampled by scanning the beam across the sample. S̃(x, z) can be written in terms of a slowly-varying envelope Senv and relative phase φ:
| (9) |
where Senv is a convolution of the point spread function of the OCT system and the sample backscattering amplitude, and exp(iφ) is modulated rapidly with half-wavelength periodicity in z.
Mechanically modulated MNPs as described in Eq. (5) will push adjacent light-scattering structures, resulting in a deformation of the tissue that can be measured using phase-resolved OCT. In B-mode imaging this can be accomplished by continuously scanning in x while acquiring rapid axial (z) scans and at the same time modulating the magnetic field in t. However, the axial scans must be sufficiently fast to sample the magnetic field modulation (Nyquist criterion). Also, the magnetomotive signal must be separated from the optical phase changes along the x dimension [22], to allow them to be unmixed. These can be achieved under the following conditions:
| (10) |
where fz is the axial (z) line acquisition rate, Δx is the transverse resolution of the OCT system, and v is the velocity of the transverse scan. The latter criterion requires more than one cycle of the magnetic field be completed in the time it takes to transversely scan across one point scatterer.
When scanning is performed in this way, two-dimensional data is acquired where one dimension is z and the other is coupled transverse/temporal (x/t). The complex analytic signal in this case can be written:
| (11) |
where Senv(x,z) and φ(x,z) indicate what would be measured in the absence of magnetomotion. When the displacement Δz is small compared to the coherence length lc, Senv is unchanged and Δz only affects the phase term. Using Eq. (5) the relevant magnetomotive terms are extracted from the B-mode data by computing the complex argument and applying a derivative:
| (12) |
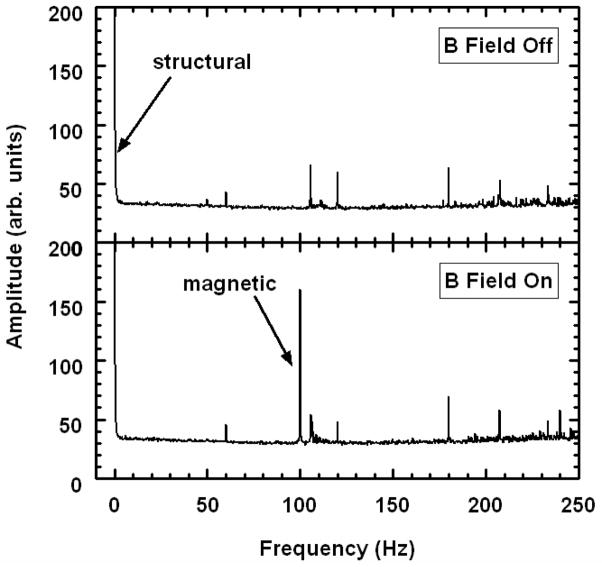
We note that phase unwrapping should be applied during computation of the derivative by taking a modulus 2π. The derivative helps to remove unwanted low frequency noise. Using the latter criterion of Eq. (10), we see that the stationary optical phase term [last term of Eq. (12)] varies more slowly than the magnetomotive term modulated at fB [first term of Eq. (12)]. This can be shown by Fourier transformation of D along the x/t dimension, as displayed in Fig. 2. A magnetomotive signal proportional to the displacement amplitude A(x,z) can thus be extracted by applying a bandpass filter (BPF) to D in x/t about fB with an appropriate passband to preserve spatial x variations. The mechanical phase lag ϕ(x,z) is similarly extracted by computing the argument of the bandpass-filtered D.
Fig. 2.
Representative transverse Fourier spectra with and without magnetic field modulation at 100 Hz for B-mode imaging of a tissue phantom with 100 μg/g MNPs. Spectral amplitudes were averaged over all rows of the image. As indicated, the low frequency peak contains the usual structural OCT data, and a peak at 100 Hz is specific to magnetomotion. Other peaks are attributed to background noise (including 60Hz and its harmonics).
To improve specificity, a B-mode image without magnetomotion should be acquired in the same way to account for physiological motions in the tissue. Thus, we write the background-rejected magnetomotive signal Smm in decibels as follows:
| (13) |
where Don and Doff are the measurements according to Eq. (12) acquired with the magnetic field modulated and off, respectively, and f̂on and f̂off are the mechanical phase filters using Eq. (6) with ϕ measured from Don and Doff, respectively. Smm(x,z) is then displayed directly as the MMOCT image.
We note that this theoretical analysis only treated the case of a homogeneously dispersed MNP-laden tissue. The displacement field Δz(x,z) induced by a localized deposit of MNPs is an axially aligned dipole function [23]. The effective resolution of the MMOCT image depends on analysis of the displacement pattern over a relevant area to infer the locations of specific MNP deposits. Given that individual magnetic microparticle-laden cells were resolved in a previous MMOCT study [18], we expect that the resolution of MMOCT will not be prohibitive to imaging in biological samples.
3. Methods
The spectral-domain OCT system consists of a Ti:Al2O3 femtosecond laser (KMLabs, Inc.) producing 800 nm light with a bandwidth of 120 nm (providing lc ~3 μm axial resolution). This is pumped by 4.5 W of 532 nm light from a frequency-doubled Nd:YVO4 laser (Coherent, Inc.) The broadband light is launched into a single-mode fiber interferometer which is divided into the sample arm and a stationary reference arm. The sample beam is steered using galvanometer mirrors placed one focal length above a 30 mm achromatic imaging lens (providing Δx ~12 μm transverse resolution). A water-jacketed electromagnet described previously [18] is placed between the lens and sample allowing the beam to pass through the central bore. A 250 W power supply is used to achieve a magnetic field of ~0.08 T and gradient of ~15 T/m within the sample imaging volume. The interference of the reference and sample beams is measured with a spectrometer described previously [24], composed of a grating, imaging lens, and line camera (Pirahna 2, Dalsa Inc.) with capability of 33 kHz line rates. The spectrometer resolution was designed to provide an optical imaging depth of 2 mm.
The magnetic modulation frequency fB was chosen to be 55.6 Hz for tumor tissues and 100 Hz for tissue phantoms, based on the best response (highest A) achieved from these samples. A lower axial scan rate of 1 kHz was chosen to avoid excessive oversampling. The camera exposure time was 250 μs. The root-mean-square phase noise measured from a stationary tissue specimen at 1 kHz without transverse scanning was 0.2 rad. B-mode scans over 2.5 mm were performed with a scan velocity v of 0.625 mm/s, corresponding to a right-hand-term in Eq. (10) of 104 Hz and thus satisfying the criterion for fB > 52 Hz. Each frame consisted of 4000 pixels width by 1024 pixels depth, taking 4 seconds to acquire. Each image was acquired twice, once with the magnetic field modulated and once with the field off, resulting in a total acquisition time of 8 s per MMOCT image. 3-D sampling was performed on each sample by acquiring 6 B-mode images with 0.5 mm spacing in y, resulting in a total imaging area of 2.5 × 2.5 mm. (The large spacing in y was chosen as a tradeoff between larger sample areas and shorter imaging times.)
MMOCT images were generated according to Eqs. (8), (12), and (13). Initially, the data collected from the line camera is resampled to provide S(ω) evenly sampled in frequency ω. Median filtering of Smm was performed over 23 × 23 μm. The bandpass filter width was chosen to pass transverse features of Smm up to a spatial frequency of 1/(32 μm). All images were downsampled by a factor of fz/fB along x for portability and cropped to 800 pixels in z to avoid edge effects near the bottom and top of the image. The mean Smm with and without the mechanical phase lag filter f̂ were computed for each image. MMOCT images were rendered for display by applying f̂ pointwise to Smm at each pixel. Then, for each set of 6 images, the mean and standard deviation of the image-averaged Smm and image-averaged ϕ were computed. This was all performed in post-processing using a Matlab® script which requires 15 s per image.
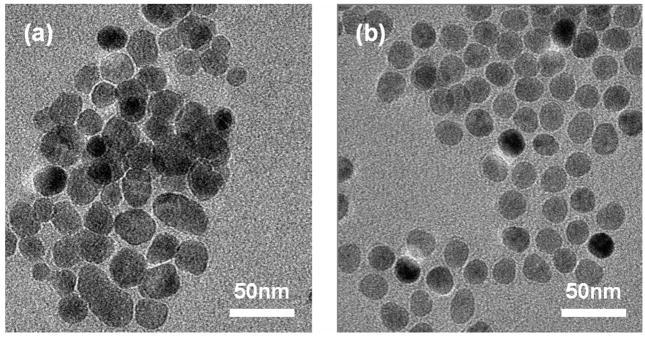
Two types of MNPs with similar properties were used (see Fig. 3). The first type, Sigma-Aldrich #637106, are approximately 20–30nm in diameter, composed of pure magnetite (Fe3O4) and are without any surface coating. We will refer to these as bare MNPs. These were used for preparation of tissue phantoms because of their miscibility in silicone oils. The second type, Ocean NanoTech #SHP-20, are significantly more monodisperse in size at ~20nm, composed of a combination magnetite/maghemite core (exact ratio unknown) and a polymer coating with a hydrophilic, COOH-terminated outer surface. We will refer to these as COOH-MNPs. These are stable in aqueous solutions (including saline solutions), and were used for the tissue imaging study.
Fig. 3.
Transmission electron micrographs of MNPs. (a) 20–30nm bare MNPs. (b) 20nm COOH-terminated MNPs.
Transmission electron microscopy (Philips CM200, FEI Company) was performed on each type of MNP for sizing. SQUID (superconducting quantum interference device) magnetometry (1T MPMS, Quantum Design, Inc.) showed the bare MNPs exhibited a volume magnetic susceptibility χ = 4.1, saturation magnetization Msat = 93 emu/g Fe, and remanence of 7 emu/g Fe. In comparison, the COOH-MNPs exhibited a χ = 2.5, Msat = 105 emu/g Fe, and remanence of 0.3 emu/g Fe. We expect the coercive field to be small because the MNPs are on the order of a single domain size; lacking significant remanance, they can be approximated as superparamagnetic. Inductively-coupled plasma mass spectrometry (OES Optima 200 DV, Perkin Elmer) revealed that, due to their polymer coating, the COOH-MNPs consist of 34% Fe by weight, compared to 72% Fe for the bare MNPs.
Silicone tissue phantoms which have comparable optical and mechanical properties to tissue were prepared exactly in the same way as reported previously [18], except we note a typographical error in [18] where the concentration of TiO2 used is actually 4 mg/g. Briefly, a mixture of crosslinking and non-crosslinking polymers is used to provide a tissue-like viscoelastic medium, and TiO2 microparticles are added to qualitatively match the OCT signal achieved from 2% intralipid (~40 cm−1 scattering coefficient). Varying concentrations of bare MNPs are added and the samples are homogenized via sonication before crosslinking in an oven. SQUID magnetometry was also performed on the tissue phantom medium without added MNPs, resulting in a measured magnetic susceptibility of χ = 6×10⁻⁶. In comparison, human tissues are known to have a susceptibility typically within 20% of that of pure water, χ = 9×10⁻⁶ [1].
Mammary tumors were induced in a Wistar-Furth female inbred rat (The Jackson Laboratory, Bar Harbor, ME) via intraperitoneal injection of a carcinogen (N-methyl-N-nitrosourea) according to a protocol described in detail previously [25]. After euthanasia, a tumor of 1.4 × 1.6 × 0.6 cm dimensions was harvested from the right groin area and stored at −80°C before imaging. MMOCT imaging was performed immediately after thawing the tumor. The tumor was subsequently immersed in a saline solution with ~4 mg/g COOH-MNPs for 15 minutes at room temperature, rinsed vigorously in pure saline for ~1 minute, and imaged using MMOCT. (The relatively large MNP concentration was chosen to ensure positive results for this single tumor). Again, the tumor was immersed in the MNP solution and the process of rinsing and imaging repeated to collect data for cumulative immersion times of 30, 60, 90, and 120 minutes. Every effort was made to image the same tumor surface area, however, exact registration between successive images was not maintained.
4. Results and discussion
4.1 MMOCT imaging of tissue phantoms
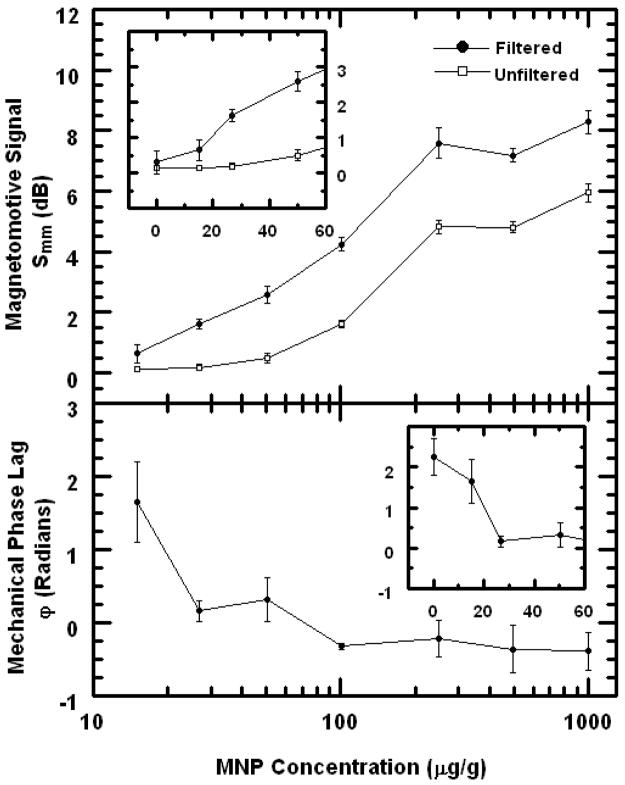
MMOCT imaging was performed on silicone phantoms with tissue-like optical and mechanical properties to understand the sensitivity to small MNP doses. The numerical results are plotted in Fig. 4. The mechanical phase lag ϕ for the control is 2.3 radians, compared to −0.4 radians for the most heavily dosed sample. There appears to be a small negative bias in ϕ which might be due to the viscosity in the medium; however, the overall difference between the positive and negative control phantoms is 2.7 which is near the expected value π. At 15 μg/g the mechanical phase appears to be approximately halfway between these two extremes, suggesting that this concentration is very near ρcrit [Eq. (3)] where the forces between the diamagnetism of the sample are balanced by those from the paramagnetic MNPs. In fact, this is in good agreement with the predicted value of ρcrit=12 μg/g (Fig. 1) for this experiment where B=800 G.
Fig. 4.
Plots of MMOCT signals in silicone tissue phantoms vs. MNP concentration. Top panel: Magnetomotive signal Smm is shown with and without the mechanical phase lag filter [Eq. (13)]. Top inset: Data near zero concentration is shown on a linear scale. Bottom panel: Mechanical phase lag ϕ is plotted. Bottom inset: Data near zero concentration is shown on a linear scale.
We see in Fig. 4 that the use of the mechanical phase lag filter [Eq. (6)] to differentiate paramagnetic motion from diamagnetic motion allows for the 27 μg/g phantom to be distinguished from control by more than one standard deviation, compared to 50 μg/g when the filter is not used. This is because the diamagnetic control sample motion exhibits a significant nonzero displacement amplitude A, and without measuring the mechanical phase ϕ, it cannot be distinguished from that from the 27 μg/g phantom.
If we use this result to estimate ρmin=27 μg/g, and assuming ρcrit=12 μg/g based on the SQUID magnetometry, we can then estimate ρnoise =15 μg/g for our field strength of 800 G. Using this result to scale the theoretical curve of ρnoise(B) appropriately in Fig. 1 allows us to predict ρmin(B) for all B, and we find that the minimum value of ρmin =26 μg/g is arrived at B=1000G. Therefore, we expect that our present setup with ρmin =27 μg/g at 800 G is very close to the optimum sensitivity. This optimization is specific to the hardware noise of the OCT system, the magnetizations of the MNPs and sample, and the mechanical properties of the sample.
We note that Smm begins to level for MNP concentrations above 250 μg/g. This occurs because the displacement amplitude becomes large, and the optical phase changes by more than π between successive samples. This situation can be written as:
| (14) |
And thus, in this case, one cannot properly unwrap the optical phase to track the magnetomotion. This problem can be mitigated by increasing the line rate fz, which allows MMOCT to sense a higher dynamic range of MNP concentrations.
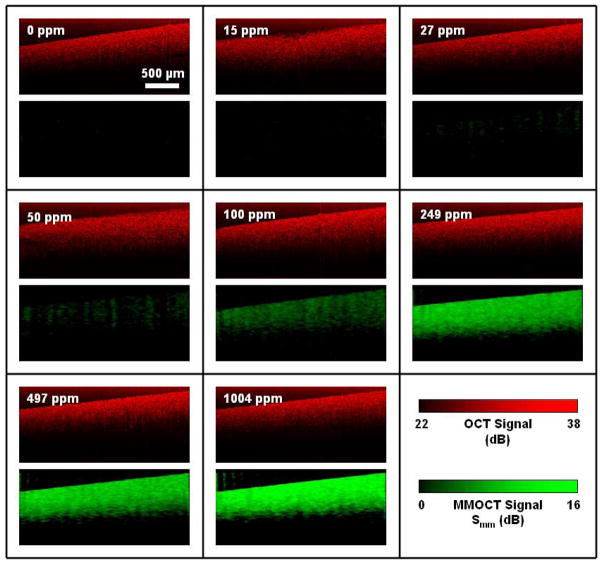
The OCT and MMOCT images from these tissue phantoms are shown in Fig. 5. We see that, while the OCT images are indistinguishable, the MMOCT images clearly show the expected dependence on MNP concentration. A few interesting effects can be noted. First, observe the autocorrelation artifact in the upper portion of the OCT images, which is due to non-negligible |ES|2 for these strongly scattering phantoms. Interestingly, this artifact is absent from the MMOCT images. This is because the |ES|2 term has no optical phase; only the ES*ER interference term carries the relative optical phase between the reference and sample electric fields. Since the MMOCT algorithm measures modulation in the optical phase to deduce the sample displacement, we expect it to be insensitive to the autocorrelation artifact. In fact, this is very similar to standard techniques currently employed to eliminate autocorrelations through phase modulation [26].
Fig. 5.
Representative OCT and MMOCT images of tissue phantoms with varying concentrations of magnetic nanoparticles (1 ppm = 1 μg/g), corresponding to the data of Fig. 4. Within each box, the upper panel is the OCT image in red, and the lower panel is the corresponding MMOCT image in green.
Secondly, we observe that the MMOCT images are not attenuated in z as rapidly as the OCT images. This is because the average value of the optical phase is independent of the scattering intensity, depending only on the amplitude of magnetomotion which is relatively independent of depth for homogeneous samples much thicker than the imaging depth. The phase noise, however, does increase with decreasing scattering intensity [19], and thus we find the MMOCT signal eventually becomes noisy at a depth where the scattering intensity is sufficiently low. The fact that the average MMOCT signal is relatively depth-independent is an improvement from the previously reported amplitude-based MMOCT methods where the scattering intensity scales the MMOCT contrast [17,18].
4.2 MMOCT imaging of tissues
To learn whether these techniques are relevant to imaging MNPs in real biological tissues, we studied the diffusion of MNPs into an excised rat tumor over a 2 hour period. The MMOCT signals versus diffusion time are displayed in Fig. 6. The mechanical phase lag ϕ before introduction of the MNPs is −2.2 which is near ±π, indicative of a diamagnetic response from the tumor. After MNPs diffused into the tumor for only 15 minutes, ϕ shifted toward zero, indicating that the MNPs were of sufficient concentration to result in a net paramagnetic response. The magnetomotive signal Smm showed a rapid increase over 1 hour, after which it leveled off. The leveling could be due to two effects: 1) the concentration of MNPs reached a steady state in the tissue, and/or 2) the MNP concentration was above the available dynamic range of Smm. Since 4 mg/g is significantly above the concentration at which Smm leveled in tissue phantoms (Fig. 4), we expect the latter effect cannot be neglected.
Fig. 6.
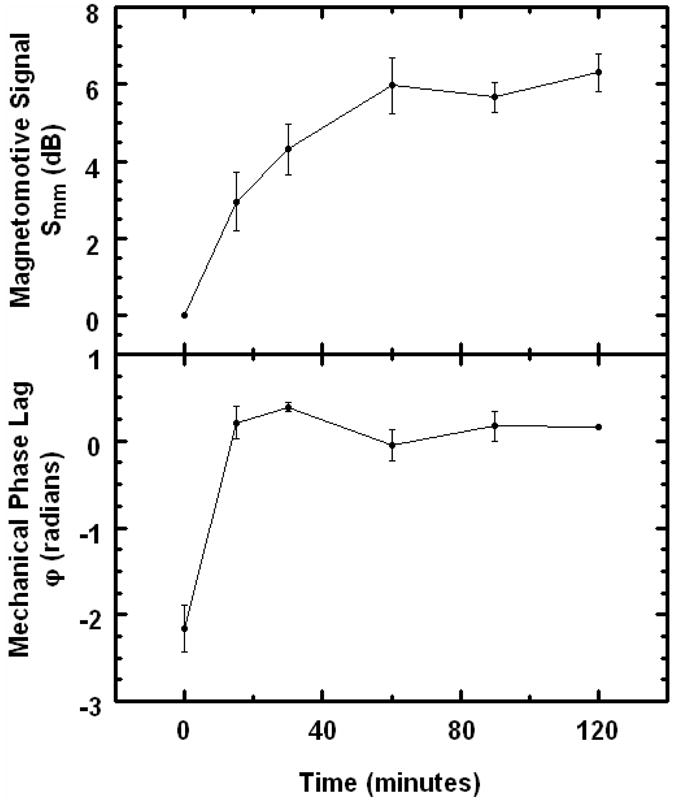
Plots of MMOCT signals in an excised rat tumor vs. diffusion time of MNPs. Top panel: Magnetomotive signal Smm computed according to Eq. (13). Bottom panel: Mechanical phase lag ϕ.
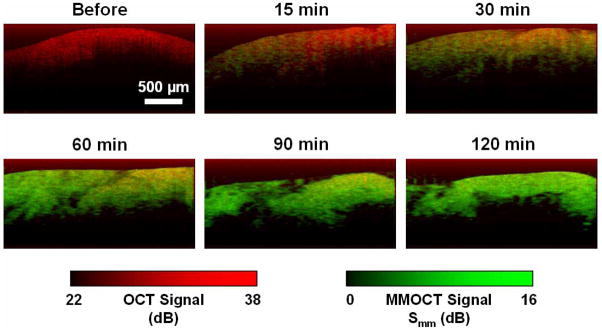
The overlaid OCT and MMOCT images of the tumor during diffusion of MNPs is shown in Fig. 7. Although the Smm at longer time periods leveled, the MMOCT images exhibit a useful dynamic range of approximately 16 dB. There appears to be structure in the MMOCT image correlated with the structure in the OCT image, which may be liquid voids. We note that MNPs in liquid phantoms do not exhibit MMOCT contrast for two reasons: 1) their motion is not constrained and upon application of the field the MNPs move continuously along magnetic field gradients, and 2) their Brownian motion is too fast compared to the sampling rate, which results in decorrelation of the optical phase.
Fig. 7.
Representative MMOCT images of MNP diffusion in tumors versus time. Red and green display the structural (OCT) and magnetomotive (MMOCT) image channels, respectively, as indicated by the colored scale bars.
We also note that, while there is some transverse variation in the MMOCT signals, such as in the 15 and 60 minute images, there is no depth-dependent gradient that one might expect to observe during a diffusion process. This may be because the diffusion length at ≥15 minutes is much longer than the imaging depths of ~600 μm achieved in this tumor. However, further investigation is needed to understand on what length scale the magnetomotion is mechanically coupled within the tissue, which will determine the spatial resolution of MMOCT imaging.
5. Summary
In this work we present a new MMOCT imaging system based on phase-resolved detection of magnetic nanoparticle displacements, with improved sensitivity to 27 μg/g of MNPs from previously reported 450 μg/g [18] for an amplitude-based MMOCT system. The speed of imaging is improved from 60 s for a 0.6 mm B-mode scan to 8 s for a 2.5 mm scan, a factor of over 30 times faster. This is accomplished by continuously modulating the magnetic field with a square-root sinusoid to produce a pure sinusoidal force on the MNPs. The fundamental limit of imaging speed may be limited by the tissue mechanics; in this experiment we found tumor tissues had a larger mechanical response at 56 Hz than at 100 Hz. We found that the optical scattering and magnetomotive signals could be separated into two frequency channels for B-mode imaging by appropriate choice of the transverse scanning speed and magnetic modulation frequency fB.
We note that the phase sensitivity of our MMOCT system is relatively poor with 0.2 rad phase noise at 1 kHz. However, recent experiments suggest that the optical phase sensitivity may be practically limited to ~0.1 rad for in vivo applications [27], and thus, the phase sensitivity of our system may not be a significant limiting factor.
The use of a mechanical phase filter to resolve paramagnetic from diamagnetic samples was crucial for achieving the highest sensitivity to the MNPs. In tissue phantoms, we found the mechanical phase lag shifted predictably from near π at zero MNP concentration (diamagnetic) to near 0 at high MNP concentration (paramagnetic). We found that a late stage rat mammary tumor exhibited a diamagnetic response, which then shifted to paramagnetic after soaking in MNPs. While our method requires a priori knowledge that the tissues are diamagnetic, experience shows that human tissues are diamagnetic, typically lying within 20% of the susceptibility of H2O [1].
Theoretical analysis showed that an optimum magnetic field strength balanced the effects of saturation of MNPs at high fields with too little magnetomotive force at low fields. For our experiments we predict the optimum B ~1000 G, which was very close to our applied field of 800 G. To the degree that the biological phantoms, MNPs, and OCT system were typical, we expect that the choice of magnetic fields in this strength range will generally yield the best results.
6. Conclusion
MMOCT imaging provides a new way of tracking MNPs on the microscale. With the additional speed and sensitivity afforded by this new MMOCT system, we have demonstrated imaging of diffusing MNPs in an excised rat mammary tumor model. We found that MNPs rapidly diffuse into an excised tumor over a time scale of < 15 minutes, and MMOCT images exhibited a dynamic range of ~16 dB. The toxicity of these MNPs during topical administration is not known, however, the concentration of MNPs needed to track MNP diffusion may be considerably lower than the 4 mg/g used in this study.
The enhanced MNP sensitivity of 27 μg/g or ~2 nM corresponds to ~600 MNPs per 10 μm diameter cell volume. This will be useful for tracking functionalized MNPs targeted to cellular receptors. A recent in vivo mouse experiment suggests that it is possible to target hundreds of nM of MNPs to cancer [6], therefore the MMOCT MNP sensitivity may be useful for in vivo molecular imaging. While safety of the MNPs in this study has not been investigated, similar iron oxide MNPs with a dextran coating are in clinical use as MR contrast agents (Feridex I.V., Advanced Magnetics, Inc.), which are administered intravenously at a dose of 0.56 mg Fe/kg. MMOCT may facilitate the development of MNPs for biomedical applications such as hyperthermic therapy, and provide molecular contrast in OCT imaging.
Acknowledgments
We would like to thank Eric Chaney, Xing Liang, and Dr. Daniel L. Marks at the University of Illinois at Urbana-Champaign for their technical contributions to this work. This research was supported in part by the National Institutes of Health Roadmap Initiative, NIBIB 1 R21 EB005321, S.A.B, NIBIB 1 R01 EB005221, S.A.B., and the National Science Foundation, BES 05-19920, S.A.B. S.A.R. gratefully acknowledges support of a Beckman Postdoctoral Fellowship. Additional information can be found at http://biophotonics.uiuc.edu.
Footnotes
OCIS codes: (170.4500) Optical coherence tomography; (170.3880) Medical and biological imaging; (160.3820) Magneto-optical materials.
References and links
- 1.Schenck JF. Physical interactions of static magnetic fields with living tissues. Prog Biophys Mol Biol. 2005;87:185–204. doi: 10.1016/j.pbiomolbio.2004.08.009. [DOI] [PubMed] [Google Scholar]
- 2.Watarai H, Namba M. Capillary magnetophoresis of human blood cells and their magnetophoretic trapping in a flow system. J Chromatogr A. 2002;961:3–8. doi: 10.1016/s0021-9673(02)00748-3. [DOI] [PubMed] [Google Scholar]
- 3.Arruebo M, Fernandez-Pachaco R, Ibarra MR, Santamaria J. Magnetic nanoparticles for drug delivery. Nano Today. 2007;2:22–32. [Google Scholar]
- 4.Ito A, Shinkai M, Honda H, Kobayashi T. Medical application of functionalized magnetic nanoparticles. J Biosci Bioeng. 2005;100:1–11. doi: 10.1263/jbb.100.1. [DOI] [PubMed] [Google Scholar]
- 5.Dobson J. Magnetic nanoparticles for drug delivery. Drug Dev Res. 2006;67:66–60. [Google Scholar]
- 6.Lee JH, Huh YM, Jun YW, Seo JW, Jang JT, Song HT, Kim S, Cho EJ, Yoon HG, Suh JS, Cheon J. Artificially engineered magnetic nanoparticles for ultra-sensitive molecular imaging. Nat Med. 2007;13:95–99. doi: 10.1038/nm1467. [DOI] [PubMed] [Google Scholar]
- 7.Sosnovik DE, Weissleder R. Emerging concepts in molecular MRI. Curr Opin Biotechnol. 2007;18:4–10. doi: 10.1016/j.copbio.2006.11.001. [DOI] [PubMed] [Google Scholar]
- 8.Huang D, Swanson EA, Lin CP, Schuman JS, Stinson WG, Chang W, Hee MR, Flotte T, Gregory K, Puliafito CA, Fujimoto JG. Optical coherence tomography. Science. 1991;254:1178. doi: 10.1126/science.1957169. [DOI] [PMC free article] [PubMed] [Google Scholar]
- 9.Boppart SA, Oldenburg AL, Xu C, Marks DL. Optical probes and techniques for molecular contrast enhancement in coherence imaging. J Biomed Opt. 2005;10:041208. doi: 10.1117/1.2008974. [DOI] [PubMed] [Google Scholar]
- 10.Applegate BE, Izatt JA. Molecular imaging of endogenous and exogenous chromophores using ground state recovery pump-probe optical coherence tomography. Opt Express. 2006;14:9142–9155. doi: 10.1364/oe.14.009142. [DOI] [PubMed] [Google Scholar]
- 11.Cang H, Sun T, Li ZY, Chen J, Wiley BJ, Xia Y, Li X. Gold nanocages as contrast agents for spectroscopic optical coherence tomography. Opt Lett. 2005;30:3048–3050. doi: 10.1364/ol.30.003048. [DOI] [PubMed] [Google Scholar]
- 12.Agrawal A, Huang S, Lin AWH, Lee MH, Barton JK, Drezek RA, Pfefer TJ. Quantitative evaluation of optical coherence tomography signal enhancement with gold nanoshells. J Biomed Opt. 2006;11:041121. doi: 10.1117/1.2339071. [DOI] [PubMed] [Google Scholar]
- 13.Oldenburg AL, Hansen MH, Zweifel DA, Wei A, Boppart SA. Plasmon-resonant gold nanorods as low backscattering albedo contrast agents for optical coherence tomography. Opt Express. 2006;14:6724–6738. doi: 10.1364/oe.14.006724. [DOI] [PubMed] [Google Scholar]
- 14.Adler DC, Huang SW, Huber R, Fujimoto JG. Photothermal detection of gold nanoparticles using phase-sentivie optical coherence tomography. Opt Express. 2008;16:4376–4393. doi: 10.1364/oe.16.004376. [DOI] [PubMed] [Google Scholar]
- 15.Anker JN, Kopelman R. Magnetically modulated optical nanoprobes. Appl Phys Lett. 2003;82:1102–1104. [Google Scholar]
- 16.Aaron JS, Oh J, Larson TA, Kumar S, Milner TE, Sokolov KV. Increased optical contrast in imaging of epidermal growth factor receptor using magnetically actuated hybrid gold/iron oxide nanoparticles. Opt Express. 2006;14:12930–12943. doi: 10.1364/oe.14.012930. [DOI] [PubMed] [Google Scholar]
- 17.Oldenburg AL, Gunther JR, Boppart SA. Imaging magnetically labeled cells with magnetomotive optical coherence tomography. Opt Lett. 2005;30:747–749. doi: 10.1364/ol.30.000747. [DOI] [PubMed] [Google Scholar]
- 18.Oldenburg AL, Jean-Jacques Toublan F, Suslick KS, Wei A, Boppart SA. Magnetomotive contrast for in vivo optical coherence tomography. Opt Express. 2005;13:6597–6614. doi: 10.1364/opex.13.006597. [DOI] [PubMed] [Google Scholar]
- 19.Choma MA, Ellerbee AK, Yang C, Creazzo TL, Izatt JA. Spectral-domain phase microscopy. Opt Lett. 2005;30:1162–1164. doi: 10.1364/ol.30.001162. [DOI] [PubMed] [Google Scholar]
- 20.Oh J, Feldman MD, Kim J, Kang HW, Sanghi P, Milner TE. Magneto-motive detection of tissue-based macrophages by differential phase optical coherence tomography. Lasers Surg Med. 2007;39:266–272. doi: 10.1002/lsm.20473. [DOI] [PubMed] [Google Scholar]
- 21.Chan MM, Lu W, Merchant FM, Iglehart JD, Miron PL. Gene expression profiling of NMU-induced rat mammary tumors: cross species comparison with human breast cancer. Carcinogenesis. 2005;26:1343–1353. doi: 10.1093/carcin/bgi100. [DOI] [PubMed] [Google Scholar]
- 22.Park BH, Pierce MC, Cense B, Yun SH, Mujat M, Tearney GJ, Bouma BE, deBoer JF. Real-time fiber-based multi-functional spectral-domain optical coherence tomography at 1.3 μm. Opt Express. 2005;11:3931–3944. doi: 10.1364/opex.13.003931. [DOI] [PubMed] [Google Scholar]
- 23.Oldenburg AL, Luo W, Boppart SA. High-resolution in vivo nanoparticle imaging using magnetomotive optical coherence tomography. Proc. SPIE 6097; [DOI] [Google Scholar]
- 24.Ralston TS, Marks DL, Carney PS, Boppart SA. Interferometric synthetic aperture microscopy. Nat Phys. 2007;3:129–134. doi: 10.1038/nphys514. [DOI] [PMC free article] [PubMed] [Google Scholar]
- 25.Zysk AM, Chaney EJ, Boppart SA. Refractive index of carcinogen-induced rat mammary tumours. Phys Med Biol. 2006;51:2165–2177. doi: 10.1088/0031-9155/51/9/003. [DOI] [PubMed] [Google Scholar]
- 26.Zhang J, Nelson JS, Chen Z. Removal of a mirror image and enhancement of the signal-to-noise ratio in Fourier-domain optical coherence tomography using an electro-optic phase modulator. Opt Lett. 2005;30:147–149. doi: 10.1364/ol.30.000147. [DOI] [PubMed] [Google Scholar]
- 27.Makita S, Hong Y, Yamanari M, Yatagai T, Yasuno Y. Optical coherence angiography. Opt Express. 2006;14:7821–7840. doi: 10.1364/oe.14.007821. [DOI] [PubMed] [Google Scholar]


