

Abstract
Microsatellite instability is a key mechanism of colon carcinogenesis. We have previously studied mutations within a (CA)13 microsatellite using an enhanced green fluorescent protein (EGFP)-based reporter assay that allows the distinction of replication errors and mismatch repair (MMR) activity. Here we utilize this assay to compare mutations of mono- and dinucleotide repeats in human colorectal cells. HCT116 and HCT116+chr3 cells were stably transfected with EGFP-based plasmids harboring A10, G10, G16, (CA)13 and (CA)26 repeats. EGFP-positive mutant fractions were quantitated by flow cytometry, mutation rates were calculated and the mutant spectrum was analyzed by cycle sequencing. EGFP fluorescence pattern changed with the microsatellite's nucleotide sequence and cell type and clonal variations were observed in mononucleotide repeats. Replication errors (as calculated in HCT116) at A10 repeats were 5–10-fold higher than in G10, G16 were 30-fold higher than G10 and (CA)26 were 10-fold higher than (CA)13. The mutation rates in hMLH1-proficient HCT116+chr3 were 30–230-fold lower than in HCT116. MMR was more efficient in G16 than in A10 clones leading to a higher stability of poly-G tracts. Mutation spectra revealed predominantly 1-unit deletions in A10, (CA)13 and G10 and 2-unit deletions or 1-unit insertion in (CA)26. These findings indicate that both replication fidelity and MMR are affected by the microsatellite's nucleotide composition.
INTRODUCTION
Microsatellite instability (MSI) is detected in approximately 10–15% of colorectal, endometrial and gastric cancers (1,2), a proportion of which are caused by the Lynch syndrome (2,3). In Lynch syndrome, MSI is caused by a defect in the DNA mismatch repair (MMR) system that results from germline mutations in certain MMR genes including hMLH1, hPMS2, hMSH2 or hMSH6 (4). A permanent frameshift mutation in microsatellites is caused by slippage of DNA polymerase followed by a lack of post-replication MMR (5,6). Polymerase slippage happens predominantly in areas of microsatellites in the eukaryotic genome (7). Most microsatellites are located in non-coding regions, but some of these repeats (typically mononucleotide repeats) are found in coding regions of genes which may be inactivated through frameshift mutations in MSI-positive tumors (8).
The components of the MMR system play a major role in maintaining genetic stability during cell division by correcting replication errors which—if not repaired—would create frameshifts and lead to nonsense mutations. In eukaryotes, homologs of the bacterial MutS- and MutL-MMR proteins form heterodimers with specific roles in the repair of certain types of mismatch errors caused by polymerase slippage (7). MMR is initiated when complexes of the MutS homologs, either MSH2-MSH6 (MutSα) or MSH2-MSH3 (MutSβ), recognize a mismatch. Eukaryotic DNA polymerases-α, -β and -δ differ in their frequency and specificity of producing frameshift errors, polymerase-β being the least accurate enzyme (9). These specificities reflect a major role for eukaryotic polymerases in modulating the integrity of DNA repeats. Polymerase-ε along with polymerase-δ plays a major role in DNA replication, recombination and repair (10). However, frameshifts and MSI were not significantly increased in exonuclease mutant Pol-εe/e cells (11).
Microsatellites have a repeat-unit size of 1–6 bp and occupy ∼3% of the human genome (12). They consist of 6–30 repeat units and tend to be highly polymorphic (13). A number of characteristics of DNA repeats are known to influence their degree of instability. These include the length of the repeat unit (14), the base composition (15), the number of DNA repeats (16,17), the sequence context (18,19) and the degree of ‘perfection’ of the repeat tract (20). Such studies were based on the use of selective media. When quantitating mutation rates, the presence of preexisting mutations within such assays cannot be precluded.
Previously, we developed a flow cytometry-based assay for the quantitation of frameshift mutations within a (CA)13 microsatellite (21). This assay could distinguish between actual replication errors and their removal by the DNA MMR system. Here we utilize this assay to compare mutation rates of various mono- and dinucleotides. The aim was to investigate the influence of length, composition and unit type on both the occurrence of replication errors and the removal of such by the MMR.
RESULTS
Generation of frameshift-reporter plasmids
The plasmid pIREShyg2-enhanced green fluorescent protein (EGFP) (21) allows the expression of EGFP under the control of a constitutive cytomegalovirus promoter. Several DNA repeat oligonucleotides were inserted after the translation initiation codon of the EGFP gene shifting it out of its reading frame and resulting in the expression of a truncated peptide without fluorescence. Deletions or insertions within the repetitive sequence may restore the proper reading frame of the EGFP gene and cause expression of EGFP. pIREShyg2-EGFP was linearized with the restriction enzymes PmeI (generating a 3′ blunt end) and AscI (generating a 5′-GCGC overhang). Compatible DNA repeat oligonucleotides (A10, G10, G16, (CA)26 and N26) were generated by hybridization of forward and reverse single DNA oligonucleotides with a 5′-GCGC overhang and a 3′ blunt end. N26 is a random DNA sequence which served as non-repeat control (5′-GCGCTTATACTAAGCGGAAATCGTTA-3′). After ligation, the products were transformed into Stbl2 competent bacteria (Gibco). Amplified plasmids were isolated and sequenced using EGFP-specific primers flanking the DNA repeat sequence.
Establishment and characterization of frameshift-reporter cell lines
hMLH1-proficient and hMLH1-deficient cells (HCT116+chr3, HCT116) were stably transfected with pIREShyg2-EGFP-A10, pIREShyg2-EGFP-G10, pIREShyg2-EGFP-G16, pIREShyg2-EGFP-(CA)26 DNA repeats and pIREShyg2-EGFP-N26 similar to our previous experiments using pIREShyg2-EGFP-(CA)13 (21). Additionally, hMHS2-proficient and hMSH2-deficient cells (LoVo+chr2, LoVo) were transfected with pIREShyg2-EGFP-(CA)13. Stable clones were characterized by sequencing, Southern blotting and flow cytometry (Supplementary Material, Fig. S1). Out of each transfection, two clones harboring a single insertion of the plasmid were selected and processed further for mutation analyses.
EGFP fluorescence pattern changes with the nucleotide sequence of the microsatellite insert and the cell type
We utilized a recently developed EGFP-based assay for the detection of frameshift mutations within a (CA)13 microsatellite (21) and extended this system to various DNA repeat constructs to test whether the composition, length and unit type of DNA repeats are crucial for the frequency of the occurrence of frameshift mutations. Non-fluorescent (M0) cells were sorted into 24-well plates (Supplementary Material, Fig. S2A). EGFP-positive populations were analyzed by flow cytometry after 3–20 days, dependent on the MMR background and proliferation rate. In previous experiments using pIREShyg2-EGFP-(CA)13, the EGFP-positive population consisted of two distinct fractions, M1 and M2, which represent intermediate (correlating with replication errors) and permanent mutant cells (representing the combined effect of replication errors and MMR proficiency) (21). The intensity and distribution of the EGFP-positive populations M1 and M2 were analyzed using Cyflogic flow cytometry data analysis software (Fig. 1). The M1 and M2 fractions displayed diversity in histogram pattern (Fig. 1A; FL1/counts) and fluorescence intensity (Fig. 1B; geometric mean) between different microsatellite sequences but not within clones of the same microsatellite. The mean fluorescence intensity of the M2 population was strongest in HCT116 cells harboring (CA)26 or (CA)13 (536 ± 56 or 442 ± 50, respectively) followed by G10 (151 ± 88) and G16 (117 ± 78). A10 (33 ± 1) displayed the lowest fluorescence intensity. In some clones (such as HCT116 A10 and HCT116 G16.2), the separation of M1 and M2 fractions was difficult and therefore the results for the M1 fraction have to be considered with caution. LoVo cells harboring a (CA)13 repeat showed a lower fluorescence intensity than the corresponding HCT116 cells (86 ± 6 versus 442 ± 50). Interestingly, the population pattern (M1 > M2) was also different from the corresponding HCT116 clone (M2 > M1).
Figure 1.


EGFP fluorescence pattern and intensity depends on the nucleotide sequence of the microsatellite. Stable transfectants of the various cell clones were sorted for M0 non-fluorescent cells, grown for 10–20 days and were analyzed by flow cytometry on a FACScan (BD Bioscience). (A) The fluorescence pattern of each clone is represented by a histogram (FL1) to quantitate the distinct fluorescence subpopulations M1 and M2. Differences in fluorescence pattern are related to the nucleotide sequence of the microsatellite and the type of cell line. (B) Single cell clones of HCT116 cells were cultured in quadruplicate and the geometric mean of the FL1 intensity was expressed as mean ± SD for the M1 and the M2 fractions. A strong variation was observed between different microsatellites but less within single cell clones of the same microsatellite.
In HCT116+chr3 cells, the fluorescence intensity of the M1 populations was comparable and the M2 population was either very small (A10) or not present at all. The non-repetitive control sequence (N26) displayed a very small M1- and no M2 population in both HCT116 and HCT116+chr3 cells. Overall, a good correlation was evident between the fluorescence intensity of the M1 and the according M2 fractions (R = 0.932, P < 0.0001). These data suggest that the EGFP fluorescence pattern and intensity is altered by the nucleotide composition of the inserted repetitive sequence as well as the type of cell line.
The nucleotide composition and length increase the mutation rate in MMR-deficient cells
Next we compared the change of M1 and M2 mutant fractions over time. M0 cells were sorted, cultured as above and analyzed at early (days 4–8), mid (days 7–12) and late time points (days 10–20) according to the different proliferation rates of clones [LoVo and LoVo+chr2 grow about three times slower than HCT116 (doubling time about 14 h) or HCT16+ hr3 (doubling time about 24 h)]. In most clones, the M1 population showed little change and the M2 population accumulated over time. A comparison between A10 and G10 clones in HCT116 (Fig. 2A) revealed an approximately 4-fold larger M1 fraction in cells harboring the A10 repeat. The corresponding accumulation of M2 cells was also much higher in the A10 clones, while there was little or no change of the M2 population of G10 clones. Comparative mutations rates (Table 1; method of the mean) of A10 were 5–15-fold higher than G10. These data suggest that A10 repeats are more susceptible to replication errors than G10 and, consequently, produce more permanent frameshift mutations in MMR-deficient mammalian cells. The replication fidelity within the G10 tract is, however, significantly compromised when the length of the repeat increases to G16 (Fig. 2B). In fact, the G16 microsatellite is hypermutable with about 3% of M2 cells after 5–6 replication cycles (4 days of culture). Comparative mutations rates (Table 1; method of the mean) of G16 were 20–60-fold higher than G10 (Table 1).
Figure 2.

Comparison of M1 and M2 populations over time within different microsatellite sequences. Non-fluorescent M0 cells were sorted into 24-well plates and analyzed after a period of 5–20 days (early, mid and late time points) and a change in M1 and M2 fractions was compared between certain clones. (A) Comparison between A10 and G10 clones. (B) Comparison between G10 and G16 clones. (C) Comparison between (CA)13 and (CA)26 clones. (D) Comparison between (CA)13 in HCT116 and LoVo cells. A random non-repeat sequence (N26) served a control.
Table 1.
Mutation rates within mono- and dinucleotide repeats in colon epithelial cells
| Microsatellite | HCT116 |
HCT116+chr3 |
P-valuea | ||
|---|---|---|---|---|---|
| ML | MM | ML | MM | ||
| (CA)13 | 2.0 ± 0.3 (×10−4) | 1.9 ± 0.5 (×10−4) | 9.0 ± 4.4 (×10−6) | 8.9 ± 5.5 (×10−6) | <0.001 |
| (CA)26.1b | 1.5 ± 0.2 (×10−3) | 1.5 ± 0.4 (×10−3) | <6.4 ± 3.5 (×10−6) | <6.1 ± 5.0 (×10−6) | 0.003 |
| (CA)26.2b | 1.7 ± 0.2 (×10−3) | 1.7 ± 0.4 (×10−3) | <1.1 ± 0.6 (×10−6) | <1.1 ± 0.9 (×10−6) | 0.003 |
| A10.1 | 3.7 ± 0.5 (×10−4) | 3.8 ± 1.0 (×10−4) | 1.3 ± 0.7 (×10−5) | 1.3 ± 1.0 (×10−5) | 0.001 |
| A10.2 | 3.4 ± 0.5 (×10−4) | 3.7 ± 1.0 (×10−4) | 1.1 ± 0.5 (×10−5) | 1.1 ± 0.6 (×10−5) | 0.008 |
| G10.1 | 1.3 ± 0.7 (×10−5) | 2.5 ± 1.3 (×10−5) | <7.7 ± 4.2 (×10−6) | <7.3 ± 6.0 (×10−6) | n.s. |
| G10.2 | 5.9 ± 3.1 (×10−5) | 7.6 ± 4.8 (×10−5) | <1.0 ± 0.5 (×10−5) | <9.6 ± 7.9 (×10−6) | n.s. |
| G16.1 | 1.5 ± 0.2 (×10−3) | 1.7 ± 0.4 (×10−3) | 9.0 ± 3.5 (×10−6) | 9.2 ± 4.7 (×10−6) | 0.003 |
| G16.2 | 1.6 ± 0.2 (×10−3) | 1.5 ± 0.3 (×10−3) | 3.7 ± 2.0 (×10−6) | 4.2 ± 3.1 (×10−6) | <0.001 |
| N26.1 | <2.6 ± 1.4 (×10−6) | <2.5 ± 2.1 (×10−6) | <3.5 ± 1.9 (×10−6) | <3.3 ± 2.7 (×10−6) | n.s. |
| N26.2 | <2.7 ± 1.5 (×10−6) | <2.6 ± 2.1 (×10−6) | <3.1 ± 1.6 (×10−6) | <2.9 ± 2.4 (×10−6) | n.s. |
| LoVo | LoVo + chr2 | ||||
| (CA)13.1 | 1.3 ± 0.3 (×10−4) | 1.3 ± 0.4 (×10−4) | <4.8 ± 2.6 (×10−5) | <4.5 ± 3.7 (×10−5) | 0.009 |
| (CA)13.2 | 1.0 ± 0.2 (×10−4) | 1.3 ± 0.4 (×10−4) | <1.4 ± 0.8 (×10−5) | <1.4 ± 1.1 (×10−5) | 0.06 |
Data are mean ± SEM. Mutation rates are expressed as mutations per microsatellite per generation.
ML, maximum likelihood method; MM, method of the mean.
aBetween mutation rates (MM) of MMR-deficient (HCT116, LoVo) and MMR-corrected (HCT116+chr3, LoVo+chr2) cells.
bExact mutation rate cannot be established as clones are a mix of wild-type and 1-unit deletions.
n.s. not significant.
Comparison of (CA)13 and (CA)26 repeats revealed higher mutant fractions for the longer tract both in the M1 and the M2 fraction (Fig. 2C) with an 8-fold difference in mutation rates (Table 1; method of the mean). Changes in mutant fractions in the (CA)13-harboring HCT116 cells were consistent with our previous data (21). The somewhat lower mutation rate was due to a change in the assumed cloning efficiency (now adjusted to 20%). Despite the obvious differences in EGFP fluorescence pattern of the M1 and M2 population, the size of the M1 and M2 populations was similar in (CA)13-transfected LoVo cells and HCT116 cells (Fig. 2D). Due to the slow growth of LoVo cells, the culture period and conditions were difficult to compare.
Comparative mutation rates of the investigated microsatellites in HCT116 cells were: G10<(CA)13<A10<G16<(CA)26 (P < 0.05). Thus, the stability of microsatellites in MMR-deficient colon cells depends on the nucleotide composition and length of the DNA repeat. Despite the different growth and fluorescence pattern of mutant cells, the mutation rate at the (CA)13 repeat was similar in LoVo and HCT116 cells.
Mutation spectra of mono- and dinucleotide repeats in MMR-deficient cells
During DNA replication, the formation of insertion/deletion loops within microsatellite sequences leads to a gain or loss of repeat units (22). To analyze the spectrum of the resulting mutations, single cells of the M0, M1 or M2 populations (Supplementary Material, Fig. S2A) were sorted into 96-well plates and grown for 10 days. From each clone, a fluorescent image was taken by inverted fluorescence microscopy (Supplementary Material, Fig. S2B), the DNA was isolated and the microsatellite region was subjected to cycle sequencing (Supplementary Material, Fig. S2C). The cloning efficiency in 96-well plates was 4–25% for M0, 1–21% for M1 and 8–24% for M2 clones. The quality of sequence analysis was good except for G16 clones (which we were unable to amplify). Except for (CA)26 repeats, the M0 fraction revealed wild-type sequences only, whereas the intermediate mutant fraction M1 revealed a mixture of wild-type, heteroduplex DNA and definitive mutations (Table 2).
Table 2.
Mutation spectrum within DNA microsatellites in colon epithelial cells
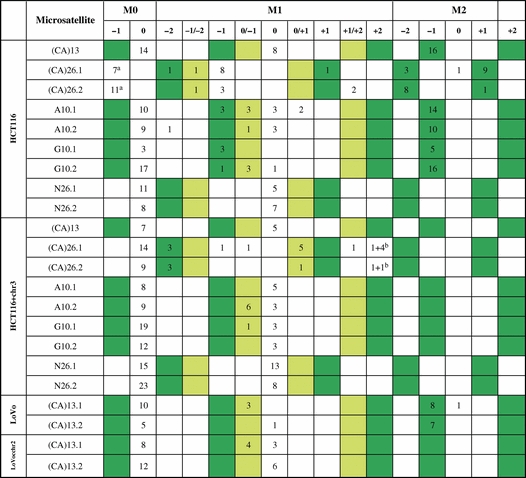 |
No fill color: wild-type or frameshift mutant cells without expected EGFP fluorescence.
Green: in-frame mutant cells with expected EGFP fluorescence.
M1 light green: Heteroduplex mutant cells with expected partial (dim) EGFP fluorescence.
aClones turned out to be (CA)25.
b+2/+3 heteroduplexes.
In clones from the M2 fractions, all mutations within the (CA)13, the A10 and G10 microsatellite were 1-unit deletions, whereas both 1-unit insertions as well as 2-unit deletions were seen in (CA)26-harboring HCT116 cells.
Similar to our previous findings, we identified heteroduplex sequences in the M1 fraction specifically in mononucleotide repeats and in the (CA)26 clones (21). In (CA)26 clones, these were 1-unit/2-unit deletion heteroduplexes according to a mixed fluorescence colony phenotype. In sorted M1 cells containing (CA)26 repeats, fluorescence-positive −1 or +2-unit mutations but no wild-type sequences were observed. This likely reflects the large proportion of (CA)26 mutant cells that are present within the M0 and M1 population. (CA)13 mutations in hMSH2-deficient LoVo cells displayed a similar spectrum as in HCT116. Our data are in line with the expected range of mutations and demonstrate a good correlation with the fluorescence phenotype of the originating cell (i.e. M0, M1 or M2).
Repair of insertion/deletion loops by MutL
Similar mutation analyses were performed in clones of HCT116+chr3 that express a functional MutL complex (through transfer of chromosome 3 where hMLH1 is located) but lack hMSH3 to build MutSβ. In some clones, no M2 cells were detected and, thus, the calculation of the mutation rate was based on the assumption that a single mutant cell was not detected (Table 1). In general, the corresponding clones in HCT116+chr3 displayed significantly lower mutation rates than in HCT116 cells. The highest mutation rate was measured in A10, followed by G16 and (CA)13 (Table 1). The fold reduction in mutation rate (as calculated by the method of the mean) through transfer of hMLH1 (on chromosome 3) was further plotted for clones that displayed definitive mutations in both cell lines (Fig. 3). As G16 tracts were 5 to 15 times more susceptible to replication errors than A10, the lower mutation rate in G16 indicates that the presence of a functional MutL complex induces a more efficient repair of G16 than A10 insertion/deletion loops.
Figure 3.

Efficiency of MutL in the repair of insertion/deletion loops at different microsatellites. Mutation rates (method of the mean) were compared between hMLH1-deficient HCT116 and hMLH1-proficient HCT116+chr3 and a fold reduction (y-axis) was calculated. The efficiency to repair G16 mismatches was significantly better than for A10 or (CA)13 (P < 0.001).
DISCUSSION
In the eukaryotic genome, microsatellites are prone to frameshift mutations as a result of polymerase slippage during DNA replication (22). Such events involve insertion or deletion of repeat units. Known factors that influence repeat instability are the length, composition and repeat-unit size of DNA repeats (23). Mononucleotide repeats are the most abundant repeat motifs in humans and are frequently mutated within certain types of cancer such as Lynch syndrome (24). Recently, a frameshift mutation in the A13 repeat within the 3′-untranslated region of epidermal growth factor receptor (EGFR) was shown to be frequently mutated in MSI colon cancers which are associated with increased EGFR expression (25). Poly-(CA) tracts exhibit frequent mutations in non-neoplastic mucosa from patients with ulcerative colitis (26). A proper understanding of such mutational events in humans may help understand the mechanisms that lead to the accumulation of mutations in cancer tissue.
Here, we utilized an EGFP-based frameshift-reporter system to analyze and compare spontaneous mutation rates within mono- and dinucleotide repeats. Plasmids harboring A10, G10, G16, (CA)13 and (CA)26, as well as a non-repetitive random nucleotide sequence (N26) that put the EGFP gene out of the reading frame, were cloned and transfected into hMLH1-deficient and hMLH1-proficient human colon epithelial cells. In addition, our previously studied (CA)13 reporter plasmid (21) was now tested in hMSH2-deficient cells (LoVo). In MMR-deficient cells, significant differences in the mutation rate were observed among these DNA sequences reflecting the different rate of replication errors. As expected, the most stable sequence was the non-repetitive N26. Despite some clonal variation, the most stable microsatellite was G10 (∼5.1 ± 3.1 × 10⁻⁵) with a 5–15-fold lower mutation rate than the A10 tract (∼3.8 ± 1.0 × 10⁻⁴). This is somewhat in contrast to previous studies in S. cerevisiae and E. coli (19,27) but not to mammalian cells (28). When testing mutation rates in our longitudinal studies (days 4–20), no significant change within single clones was observed (data not shown) indicating an equal occurrence of mutations per cell during the culture period.
When increasing the size of the poly-G repeat from a G10 to G16, the mutation rate increased 20–60-fold (∼1.6 ± 0.4 × 10⁻³), indicating that the length of G-repeats plays a major role on replication fidelity in human cells. We found that poly-(G)10 repeats are more stable than poly-(A)10. In contrast, poly-(G)17 repeats are less stable than poly-(A)17 repeats (29). When analyzing the corresponding mutation rates in hMLH1-proficient HCT116+chr3 cells, the corresponding mutation rates are 20–220-fold lower than in HCT116 which is a result of MMR due to the presence of MutL. This repair efficiency was far better in G16 (Fig. 3) tracts than in A10 or (CA)13 repeats, indicating that the MMR efficiency is affected by the type of the nucleotide repeat. In S. cerevisiae, it was also shown that the mismatch correction depends on the type of microsatellite. However, these studies were done with mutants of the MutSβ components Msh2, Msh3 and Msh6 (30). As HCT116+chr3 are known to lack hMSH3, it will be interesting to test the differential mutation rate in MMR-proficient normal colorectal cells.
Based on physical properties, CA repeats might be considered similar to random sequences in DNA (31), and should in theory exhibit base stacking and base-pair opening kinetics intermediate between the extremes of mononucleotide G or A runs. In fact, the median mutation rate of (CA)17 was lower than that of G17 and higher than A17 (29). Interestingly, CA tracts also form a poly-pyrimidine/poly-purine motif, which tends to exhibit Z-DNA characteristics that become greater with length (32,33). The potential for Z-DNA formation of alternating pyrimidine–purine nucleotides [(CG)n>(CA)n>(TA)n] correlates with frameshift potential (33). In our study, mutations at the (CA)26 were 8-fold higher than in (CA)13 and somewhat similar to G16. In fact, cycle sequencing revealed that a large fraction (if not all) of the (CA)26 (non-fluorescent) HCT116 cells harbored actual (CA)25 microsatellites. Therefore, the exact mutation rate for this clone cannot be calculated. The mutation spectra of (CA)26 (Table 2) showed a large number of definitive mutant cells in the M1 fraction without detecting any cells in the M2 fraction. This indicates that the gate between M1 and M2 was set too stringent, thereby obstructing a proper determination of the mutation rate. It is interesting that the M1 fraction does not exhibit a linear fluorescence pattern but rather a clear defined population. A possible explanation could be that cells in the M1 fraction are EGFP positive not because of a failure during replication but rather a transcriptional error caused by RNA polymerase. It is quite interesting that in (CA)26 stretches +2 insertions were as common as −1 deletions, a finding that was not observed with (CA)13, where only −1 deletions were detected (21). Thus, replication errors in longer (CA) stretches produce both insertions and deletions, whereas shorter stretches cause deletions only (16,34). Additionally HCT116 and HCT116+chr3 cells are lacking hMSH3 which recognizes larger loop outs.
By testing the various microsatellites, we identified that different microsatellites change the fluorescence intensity of EGFP. We think this is a methodological issue, specifically with the separation of M1 and M2 fractions or the analysis of rare events (such as the missing M2 fractions in (CA)26 HCT116+chr3 clones). It is likely that this change of fluorescence intensity is due to a peptide-dependent effect of the translated microsatellite sequence at the N-terminus of EGFP. Poly-A and poly-G tracts are translated into poly-Lys or poly-Gly sequences and (CA) repeats into a poly-(His-Thr) sequence. Such differences may limit the use of this mutation reporter assay specifically when it comes to the appropriate setting of the M0/M1 and M1/M2 threshold, which was notoriously more difficult in clones with low EGFP fluorescence. This has to be taken into account when interpreting the data. Additionally, it is difficult to compare fluorescence intensities between LoVo and HCT116 because of a slower proliferation rate of LoVo cells, the culture period and conditions. Interestingly, the clonal variation of the mean fluorescence levels between mononucleotide repeats was greater than between dinucleotide repeats. Therefore, the M1/M2 distinction is only reliable in poly-CA tracts and the method described previously (21) is not as robust as initially assumed. The control plasmid harboring a random non-repetitive sequence (N26) displayed also a small M1 fraction, but none of these cells were found to be mutant. This most likely represents background noise in the measurement of the M1 population.
The mutation rate analysis with this in vitro system has several advantages over the bacterial antibiotic-resistance gene method (34). It can be utilized for a semi-high throughput screening of mutagenic chemicals or of novel compounds when seeking an improvement of replication fidelity (35). It excludes the growth of preexisting mutants by the sorting of fluorescence-negative cells and has an unbiased reporter measurement, whereas antibiotic resistance varies with the antibiotic concentration used. The major value of our model lies in its ability to estimate the relative influence of polymerase errors and MMR proficiency on the rate of frameshift mutations as demonstrated by our data which provide evidence that the nucleotide composition of a microsatellite alters both replication fidelity and MMR efficiency.
MATERIALS AND METHODS
Cell culture
HCT116 (hMLH1 mutant) and LoVo (hMSH2 mutant) colorectal cancer cells were obtained from ATCC. HCT116+chr3 (36) (hMLH1 wild-type) and LoVo+chr2 (hMSH2 wild-type) were kind gifts from Drs Boland and Koi. Cells were grown in IMDM (Iscove's modified Dulbecco's medium, GIBCO-Invitrogen, Vienna, Austria) containing 10% fetal bovine serum (Biochrom, Berlin, Germany). The medium for HCT116+chr3 contained additionally 400 µg/ml and the medium for LoVo+chr2 contained 700 µg/ml Geneticin (G418, GIBCO-Invitrogen). All cells were maintained (so what about G418?) at 37°C, full humidity and 5% CO2.
Plasmid construction and sequence analysis
Using the restriction enzymes PmeI and AscI (New England Biolabs, Ipswich, GB, USA), the previously established pIREShyg2-EGFP vector (21) was linearized. Sense and anti-sense oligonucleotides (A10, (CA)26, G10 and N26 = GCGCTTATACTAAGCGGAAATCGTTA as non-DNA repeat control) with a 5′-CGCG overhang to create a compatible site for the linearized pIREShyg2-EGFP were annealed and directionally cloned into the PmeI–AscI site of pIREShyg2-EGFP to generate the plasmids pIREShyg2-EGFP-(oligonucleotide). The ligation products (pIREShyg2-EGFP(A)10, pIREShyg2-EGFP(CA)26, pIREShyg2-EGFP(G)10 and pIREShyg2-EGFP(N)26) were transformed into Stbl2 (Life Technologies, Rockville, MD, USA) and the cells were grown at 30°C on selection agar plates. Ampicillin-resistant colonies were selected and the correct sequence of the microsatellite insert was confirmed by PCR amplification with 5′-EGFP (5′-CCCACTGCTTACTGGCTTATCG-3′) and 3′-EGFP (3′-CCTGAAGTTCATCTGCACCACC-5′) and subsequent sequencing with the same primer set on an ABI Prism 310 (Applied Biosystems Inc, Foster City, CA, USA) using the DyEx 2.0 Spin Kit (Qiagen, Hilden, Germany) according to the manufacturer's manual.
Transfection and stable clone selection
Cells were transfected with the above-described pIREShyg2-EGFP-(oligonucleotide) plasmids using Effectene (Qiagen) according to the manufacturer's manual. Twenty-four hours after transfection, selection with 200 µg/ml hygromycin B (Life Technologies, Gaithersburg, MD, USA) for HCT116 and LoVo or 150 µg/ml hygromycin B and 400 µg/ml or 700 µg/ml geneticin for HCT116+chr3 and LoVo+chr2 cells, respectively. Stable cell clones were picked and analyzed by PCR for EGFP insertion as described above.
Southern blot analysis
The number of integrated plasmids in the genome was identified by Southern blotting. Total cellular DNA from stably transfected cells that had been grown from single cell colonies was isolated by phenol/chloroform/isoamylalcohol extraction. Twenty micrograms of total DNA were digested with BamHI, EcoRV or both (New England Biolabs), resolved on a 0.8% agarose gel and transferred onto a nylon membrane (Hybond N™, Amersham Pharmacia, Braunschweig, Germany) by vacuum blotting (Pharmacia-LKB Vacugene 2016). EGFP cDNA-labeling, hybridization and washing conditions were done as previously described (37).
Analysis of mutant cells by flow cytometry
Non-fluorescent HCT116, HCT116+chr3, LoVo and LoVo+chr2 frameshift-reporter cells were sorted into 24-well plates on a FACSAria cell sorter by using CloneCyt Plus™ software and sorting technology (Becton Dickinson, San Jose, CA, USA). During a 4–20-day growth period, cultures were expanded as required to keep cells in exponential growth. Cells were rinsed with cold Ca2+/Mg2+-free PBS (GIBCO-Invitrogen) and detached with 200 µl Accutase™ (PAA Laboratories, Linz, Austria). Fifty microliters of the cell suspension were analyzed on a FACScan (Becton Dickinson) and data were analyzed using Cyflogic flow cytometry data analysis software (Ver. 1.2.1, CyFlo Ltd., Turku, Finland) and cell counts were multiplied by four to quantify the total number of cells per well. Gate settings and analysis were done as described before (21). Briefly, the population displaying no fluorescence was called M0, populations with low fluorescence intensity M1 and those with high fluorescence intensity M2. The counts of M1 and M2 cells were expressed as percentage of R1 (total cell number).
Analysis of mutation spectrum by sequencing
Single cells of M0, M1 and M2 populations were sorted into 96-well plates and grown for several days to obtain approximately 200 cells per clone. The medium was removed and cells were immediately lysed with 50 mm NaOH and boiled for 10 min at 99°C. The microsatellite locus of the pIREShyg2-EGFP vector was amplified by PCR and further subjected to cycle sequencing as described above to detect the type of frameshift mutations which occurred in the respective microsatellite.
Statistical analysis and estimation of mutation rates
The mutation rate is defined as the probability of a cell to undergo a mutation in its lifetime, and is expressed per microsatellite per cell per generation. We used two different approaches for estimating the mutation rate: (i) the Luria–Delbruck method (38) and (ii) a maximum likelihood method (39,40). The Luria–Delbruck method is moment-based, whereby the mutation rate is estimated as a function of the sample mean of the number of mutants. In the maximum likelihood approach, a probability-generating function for the number of mutant cells is used to obtain the distribution of mutants as a function of the mutation rate. This likelihood function for the observed data is calculated and maximized for the mutation rate. In both of these methods, the number of cells that undergo a mutation during their lifetime (we will refer to these as definitively mutated cells) is estimated. Then, the mutation rate was obtained by dividing the number of definitively mutated cells by the total number of cells that could potentially have undergone a mutation. Data from M2 cells from the last day of analysis were used to calculate the mutation rate by the method of the mean and the maximum likelihood approaches (41). A cloning efficiency of 20% was considered for the estimation of the mutation rates. In order to assess the difference between cell lines, the mutation rates of clone replicates were compared by the Welch two-sample t-test. The Lea–Coulson method of the median was used to calculate the mutation rates of single clones as it is independent of the number of clone replicates. The resulting P-values were adjusted for multiple testing using the Benjamini–Hochberg method to control the false discovery rate.
AUTHOR'S CONTRIBUTIONS
Christoph Campregher (study design, acquisition of data, analysis and interpretation of data, drafting of the manuscript and statistical analysis), Theresa Scharl (statistical analysis), Manuela Nemeth and Clemens Honeder (acquisition of data), Thomas Jascur and C. Richard Boland (material support and critical revision of the manuscript) and Christoph Gasche (study design, interpretation of data, critical revision of the manuscript for important intellectual content, study supervision and obtained funding).
SUPPLEMENTARY MATERIAL
FUNDING
This study was supported by the Austrian Science Fund (FWF grant P18270) and the Christian Doppler Research Association. Funding to pay the Open Access charge was provided by FWF.
Supplementary Material
ACKNOWLEDGEMENTS
We thank Drs Rick Boland, Minoru Koi and Ajay Goel (Baylor University Medical Center, Dallas) for HCT116+chr3 and LoVo+chr2 cells, Victoria Heinrich for performing Southern blot analysis, and Drs Martin Willheim and Guenther Hofbauer for cell sorting (Core Unit Zellsortierung, Medical University of Vienna). The financial support by the Federal Ministry of Economy, Family and Youth and the National Foundation for Research, Technology and Development is gratefully acknowledged. The funders had no role in study design, data collection and analysis, decision to publish or preparation of the manuscript.
Conflict of Interest statement. None declared.
REFERENCES
- 1.Boland C.R., Thibodeau S.N., Hamilton S.R., Sidransky D., Eshleman J.R., Burt R.W., Meltzer S.J., Rodriguez-Bigas M.A., Fodde R., Ranzani G.N., Srivastava S. A National Cancer Institute Workshop on Microsatellite Instability for cancer detection and familial predisposition: development of international criteria for the determination of microsatellite instability in colorectal cancer. Cancer Res. 1998;58:5248–5257. [PubMed] [Google Scholar]
- 2.Ionov Y., Peinado M.A., Malkhosyan S., Shibata D., Perucho M. Ubiquitous somatic mutations in simple repeated sequences reveal a new mechanism for colonic carcinogenesis. Nature. 1993;363:558–561. doi: 10.1038/363558a0. doi:10.1038/363558a0. [DOI] [PubMed] [Google Scholar]
- 3.Peinado M.A., Malkhosyan S., Velazquez A., Perucho M. Isolation and characterization of allelic losses and gains in colorectal tumors by arbitrarily primed polymerase chain reaction. Proc. Natl Acad. Sci. USA. 1992;89:10065–10069. doi: 10.1073/pnas.89.21.10065. doi:10.1073/pnas.89.21.10065. [DOI] [PMC free article] [PubMed] [Google Scholar]
- 4.Eshleman J.R., Markowitz S.D. Mismatch repair defects in human carcinogenesis. Hum. Mol. Genet. 1996;5(Spec No.):1489–1494. doi: 10.1093/hmg/5.supplement_1.1489. [DOI] [PubMed] [Google Scholar]
- 5.Streisinger G., Owen J. Mechanisms of spontaneous and induced frameshift mutation in bacteriophage T4. Genetics. 1985;109:633–659. doi: 10.1093/genetics/109.4.633. [DOI] [PMC free article] [PubMed] [Google Scholar]
- 6.Henderson S.T., Petes T.D. Instability of simple sequence DNA in Saccharomyces cerevisiae. Mol. Cell Biol. 1992;12:2749–2757. doi: 10.1128/mcb.12.6.2749. [DOI] [PMC free article] [PubMed] [Google Scholar]
- 7.Streisinger G., Okada Y., Emrich J., Newton J., Tsugita A., Terzaghi E., Inouye M. Frameshift mutations and the genetic code. This paper is dedicated to Professor Theodosius Dobzhansky on the occasion of his 66th birthday. Cold Spring Harb. Symp. Quant. Biol. 1966;31:77–84. doi: 10.1101/sqb.1966.031.01.014. [DOI] [PubMed] [Google Scholar]
- 8.Sharan S.K., Bradley A. Identification and characterization of a microsatellite marker within murine Brca2 gene. Mamm. Genome. 1997;8:79. doi: 10.1007/s003359900623. doi:10.1007/s003359900623. [DOI] [PubMed] [Google Scholar]
- 9.Kunkel T.A. Frameshift mutagenesis by eucaryotic DNA polymerases in vitro. J. Biol. Chem. 1986;261:13581–13587. [PubMed] [Google Scholar]
- 10.Pursell Z.F., Isoz I., Lundstrom E.B., Johansson E., Kunkel T.A. Yeast DNA polymerase epsilon participates in leading-strand DNA replication. Science. 2007;317:127–130. doi: 10.1126/science.1144067. doi:10.1126/science.1144067. [DOI] [PMC free article] [PubMed] [Google Scholar]
- 11.Albertson T.M., Ogawa M., Bugni J.M., Hays L.E., Chen Y., Wang Y., Treuting P.M., Heddle J.A., Goldsby R.E., Preston B.D. DNA polymerase epsilon and delta proofreading suppress discrete mutator and cancer phenotypes in mice. Proc. Natl Acad. Sci. USA. 2009;106:17101–17104. doi: 10.1073/pnas.0907147106. doi:10.1073/pnas.0907147106. [DOI] [PMC free article] [PubMed] [Google Scholar]
- 12.Subramanian S., Mishra R.K., Singh L. Genome-wide analysis of microsatellite repeats in humans: their abundance and density in specific genomic regions. Genome Biol. 2003;4:R13. doi: 10.1186/gb-2003-4-2-r13. doi:10.1186/gb-2003-4-2-r13. [DOI] [PMC free article] [PubMed] [Google Scholar]
- 13.Ellegren H. Heterogeneous mutation processes in human microsatellite DNA sequences. Nat. Genet. 2000;24:400–402. doi: 10.1038/74249. doi:10.1038/74249. [DOI] [PubMed] [Google Scholar]
- 14.Sia E.A., Jinks-Robertson S., Petes T.D. Genetic control of microsatellite stability. Mutat. Res. 1997;383:61–70. doi: 10.1016/s0921-8777(96)00046-8. [DOI] [PubMed] [Google Scholar]
- 15.Eckert K.A., Yan G. Mutational analyses of dinucleotide and tetranucleotide microsatellites in Escherichia coli: influence of sequence on expansion mutagenesis. Nucleic Acids Res. 2000;28:2831–2838. doi: 10.1093/nar/28.14.2831. doi:10.1093/nar/28.14.2831. [DOI] [PMC free article] [PubMed] [Google Scholar]
- 16.Yamada N.A., Smith G.A., Castro A., Roques C.N., Boyer J.C., Farber R.A. Relative rates of insertion and deletion mutations in dinucleotide repeats of various lengths in mismatch repair proficient mouse and mismatch repair deficient human cells. Mutat. Res. 2002;499:213–225. doi: 10.1016/s0027-5107(01)00282-2. [DOI] [PubMed] [Google Scholar]
- 17.Wierdl M., Dominska M., Petes T.D. Microsatellite instability in yeast: dependence on the length of the microsatellite. Genetics. 1997;146:769–779. doi: 10.1093/genetics/146.3.769. [DOI] [PMC free article] [PubMed] [Google Scholar]
- 18.Kondrashov A.S., Rogozin I.B. Context of deletions and insertions in human coding sequences. Hum. Mutat. 2004;23:177–185. doi: 10.1002/humu.10312. doi:10.1002/humu.10312. [DOI] [PubMed] [Google Scholar]
- 19.Harfe B.D., Jinks-Robertson S. Sequence composition and context effects on the generation and repair of frameshift intermediates in mononucleotide runs in Saccharomyces cerevisiae. Genetics. 2000;156:571–578. doi: 10.1093/genetics/156.2.571. [DOI] [PMC free article] [PubMed] [Google Scholar]
- 20.Boyer J.C., Hawk J.D., Stefanovic L., Farber R.A. Sequence-dependent effect of interruptions on microsatellite mutation rate in mismatch repair-deficient human cells. Mutat. Res. 2008;640:89–96. doi: 10.1016/j.mrfmmm.2007.12.005. [DOI] [PubMed] [Google Scholar]
- 21.Gasche C., Chang C.L., Natarajan L., Goel A., Rhees J., Young D.J., Arnold C.N., Boland C.R. Identification of frame-shift intermediate mutant cells. Proc. Natl Acad. Sci. USA. 2003;100:1914–1919. doi: 10.1073/pnas.0437965100. doi:10.1073/pnas.0437965100. [DOI] [PMC free article] [PubMed] [Google Scholar]
- 22.Kunkel T.A., Bebenek K. DNA replication fidelity. Annu. Rev. Biochem. 2000;69:497–529. doi: 10.1146/annurev.biochem.69.1.497. doi:10.1146/annurev.biochem.69.1.497. [DOI] [PubMed] [Google Scholar]
- 23.Sia E.A., Kokoska R.J., Dominska M., Greenwell P., Petes T.D. Microsatellite instability in yeast: dependence on repeat unit size and DNA mismatch repair genes. Mol. Cell Biol. 1997;17:2851–2858. doi: 10.1128/mcb.17.5.2851. [DOI] [PMC free article] [PubMed] [Google Scholar]
- 24.Bubb V.J., Curtis L.J., Cunningham C., Dunlop M.G., Carothers A.D., Morris R.G., White S., Bird C.C., Wyllie A.H. Microsatellite instability and the role of hMSH2 in sporadic colorectalcancer. Oncogene. 1996;12:2641–2649. [PubMed] [Google Scholar]
- 25.Yuan Z., Shin J., Wilson A., Goel S., Ling Y.H., Ahmed N., Dopeso H., Jhawer M., Nasser S., Montagna C., et al. An A13 repeat within the 3′-untranslated region of epidermal growth factor receptor (EGFR) is frequently mutated in microsatellite instability colon cancers and is associated with increased EGFR expression. Cancer Res. 2009;69:7811–7818. doi: 10.1158/0008-5472.CAN-09-0986. doi:10.1158/0008-5472.CAN-09-0986. [DOI] [PMC free article] [PubMed] [Google Scholar]
- 26.Brentnall T.A., Crispin D.A., Bronner M.P., Cherian S.P., Hueffed M., Rabinovitch P.S., Rubin C.E., Haggitt R.C., Boland C.R. Microsatellite instability in nonneoplastic mucosa from patients with chronic ulcerative colitis. Cancer Res. 1996;56:1237–1240. [PubMed] [Google Scholar]
- 27.Jackson A.L., Chen R., Loeb L.A. Induction of microsatellite instability by oxidative DNA damage. Proc. Natl Acad. Sci. USA. 1998;95:12468–12473. doi: 10.1073/pnas.95.21.12468. doi:10.1073/pnas.95.21.12468. [DOI] [PMC free article] [PubMed] [Google Scholar]
- 28.Burns D.P., Temin H.M. High rates of frameshift mutations within homo-oligomeric runs during a single cycle of retroviral replication. J. Virol. 1994;68:4196–4203. doi: 10.1128/jvi.68.7.4196-4203.1994. [DOI] [PMC free article] [PubMed] [Google Scholar]
- 29.Boyer J.C., Yamada N.A., Roques C.N., Hatch S.B., Riess K., Farber R.A. Sequence dependent instability of mononucleotide microsatellites in cultured mismatch repair proficient and deficient mammalian cells. Hum. Mol. Genet. 2002;11:707–713. doi: 10.1093/hmg/11.6.707. doi:10.1093/hmg/11.6.707. [DOI] [PubMed] [Google Scholar]
- 30.Gragg H., Harfe B.D., Jinks-Robertson S. Base composition of mononucleotide runs affects DNA polymerase slippage and removal of frameshift intermediates by mismatch repair in Saccharomyces cerevisiae. Mol. Cell Biol. 2002;22:8756–8762. doi: 10.1128/MCB.22.24.8756-8762.2002. doi:10.1128/MCB.22.24.8756-8762.2002. [DOI] [PMC free article] [PubMed] [Google Scholar]
- 31.Hud N.V., Plavec J. A unified model for the origin of DNA sequence-directed curvature. Biopolymers. 2003;69:144–158. doi: 10.1002/bip.10364. doi:10.1002/bip.10364. [DOI] [PubMed] [Google Scholar]
- 32.Rich A., Nordheim A., Wang A.H. The chemistry and biology of left-handed Z-DNA. Annu. Rev. Biochem. 1984;53:791–846. doi: 10.1146/annurev.bi.53.070184.004043. doi:10.1146/annurev.bi.53.070184.004043. [DOI] [PubMed] [Google Scholar]
- 33.Freund A.M., Bichara M., Fuchs R.P. Z-DNA-forming sequences are spontaneous deletion hot spots. Proc. Natl Acad. Sci. USA. 1989;86:7465–7469. doi: 10.1073/pnas.86.19.7465. doi:10.1073/pnas.86.19.7465. [DOI] [PMC free article] [PubMed] [Google Scholar]
- 34.Twerdi C.D., Boyer J.C., Farber R.A. Relative rates of insertion and deletion mutations in a microsatellite sequence in cultured cells. Proc. Natl Acad. Sci. USA. 1999;96:2875–2879. doi: 10.1073/pnas.96.6.2875. doi:10.1073/pnas.96.6.2875. [DOI] [PMC free article] [PubMed] [Google Scholar]
- 35.Gasche C., Goel A., Natarajan L., Boland C.R. Mesalazine improves replication fidelity in cultured colorectal cells. Cancer Res. 2005;65:3993–3997. doi: 10.1158/0008-5472.CAN-04-3824. doi:10.1158/0008-5472.CAN-04-3824. [DOI] [PubMed] [Google Scholar]
- 36.Koi M., Umar A., Chauhan D.P., Cherian S.P., Carethers J.M., Kunkel T.A., Boland C.R. Human chromosome 3 corrects mismatch repair deficiency and microsatellite instability and reduces N-methyl-N′-nitro-N-nitrosoguanidine tolerance in colon tumor cells with homozygous hMLH1 mutation. Cancer Res. 1994;54:4308–4312. [PubMed] [Google Scholar]
- 37.Gasche C., Chang C.L., Rhees J., Goel A., Boland C.R. Oxidative stress increases frameshift mutations in human colorectal cancer cells. Cancer Res. 2001;61:7444–7448. [PubMed] [Google Scholar]
- 38.Luria S.E., Delbruck M. Mutations of bacteria from virus sensitivity to virus resistance. Genetics. 1943;28:491–511. doi: 10.1093/genetics/28.6.491. [DOI] [PMC free article] [PubMed] [Google Scholar]
- 39.Sarkar S., Ma W.T., Sandri G.H. On fluctuation analysis: a new, simple and efficient method for computing the expected number of mutants. Genetica. 1992;85:173–179. doi: 10.1007/BF00120324. doi:10.1007/BF00120324. [DOI] [PubMed] [Google Scholar]
- 40.Lea D.E., Coulson C.A. The distribution of the numbers of mutants in bacterial populations. J. Genet. 1949;49:264–285. doi: 10.1007/BF02986080. doi:10.1007/BF02986080. [DOI] [PubMed] [Google Scholar]
- 41.Natarajan L., Berry C.C., Gasche C. Estimation of spontaneous mutation rates. Biometrics. 2003;59:555–561. doi: 10.1111/1541-0420.00065. doi:10.1111/1541-0420.00065. [DOI] [PubMed] [Google Scholar]
Associated Data
This section collects any data citations, data availability statements, or supplementary materials included in this article.