

Abstract
The majority of women diagnosed with epithelial ovarian carcinoma (EOC) succumb due to complications of metastatic disease, suggesting that anti-metastatic therapies may improve patient survival. EOC metastasis involves intra-peritoneal shedding of cells from the primary tumor, followed by adhesion and localized penetration of the submesothelial matrix to anchor metastatic implants. Accumulation of malignant ascites is also common. Thus, a unique microenvironmental niche is established, which includes malignant cells and a plethora of soluble factors secreted by – or in response to – tumor cells. As cells penetrating the sub-mesothelial surface encounter an interstitial collagen-rich ECM, we have used 3-dimensional type I collagen (3DCI) gels to model early events resulting from intra-peritoneal anchoring. In this study we demonstrate a novel pathway of CXCR4 upregulation through β1-integrin- and NFκB- dependent signaling pathways in response to 3DCI. We also demonstrate the involvement of CXCR4-SDF1 axis in collagen invasion and proliferation, relevant to the metastatic EOC. Our data show that CXCR4 expression in human EOCs, as well as SDF1 presence in the ascites, is correlated with disease progression and metastasis. These data emphasize the importance of CXCR4 – SDF1 axis in EOC metastasis and suggest that this mechanism should be accounted for when targeting EOC metastasis.
Keywords: CXCR4 - SDF1 axis, ovarian carcinoma, metastasis, migration, CXCR4, microenvironment, chemotaxis, collagen
INTRODUCTION
Epithelial ovarian carcinoma (EOC) is a leading cause of death from gynecologic malignancies largely due to intraperitoneal metastasis 1. Unfortunately, the majority of women are diagnosed with late stage disease, when metastasis has already occurred. Currently available treatments are not efficient in prevention or retardation of metastatic spread. Optimization of the existing approaches and development of the new ones is held back by the lack of mechanistic knowledge of the biology of EOC metastasis.
Metastatic dissemination of EOC is largely confined to the peritoneal cavity and often involves malignant ascites 2. Metastasizing cells adhere to and disrupt the peritoneal mesothelium and locally invade into the three-dimensional collagen type I-rich submesothelial extracellular matrix to anchor secondary lesions 3,4. Importantly, in most cases EOC metastases are confined to the tissues and organs of the peritoneal cavity, and peritoneal metastases ultimately lead to death due to bowel obstruction. This peritoneally localized pattern of metastatic spread suggests the presence of specific microenvironmental factors that provide homing cues to guide malignant cells to receptive niches permissive for the growth of secondary lesions.
We have previously suggested that EOC cell culture in three-dimensional collagen I (3DCI) gels can be used as a simplified model of peritoneal metastasis 5. Using this consistently reproducible model system, coupled with cDNA microarray analysis and validation of results using human EOC specimens, we have identified several novel EOC metastasis-associated proteins. In particular, results have demonstrated upregulation of migration and invasion promoting genes, such as Wilms’ tumor gene product 1, actinin alpha-4, and membrane type-1 matrix metalloproteinase 5,6,7. Furthermore, our previous data strongly suggest the potential involvement of additional migration, proliferation, apoptosis, and gene expression-related genes in EOC metastasis 5. An interesting candidate gene found to be transcriptionally upregulated by 3DCI culture is the chemokine (CXC-motif) receptor 4 (CXCR4).
CXCR4 is a G-protein coupled transmembrane receptor initially identified as a co-factor for HIV entry into CD4+ T-cells 8. CXCR4 can bind its specific chemokine designated stromal derived factor-1 (SDF1; CXCL12). Binding of SDF1 to CXCR4 triggers Gi protein signaling and activates a variety of intracellular signal transduction pathways and molecules regulating migration, chemotaxis, cell survival, proliferation, and adhesion 9,10,11. It has been extensively demonstrated that the CXCR4-SDF1 axis is responsible for stem cell homing, neural cell migration, and tumor metastasis 12,13,14,15,16. It was previously shown that ovarian carcinoma cell lines Caov-3 and IGROV were able to penetrate through basement membrane-mimicking Matrigel in a CXCL12-dependent manner 17,18. Retardation of metastasis and cell proliferation in response to a CXCR4 antagonist AMD3100 has been observed in a xenograft murine model of EOC 19. This receptor may be a target for anti-metastasis drug therapy, moreover, CXCR4-specific drugs, such as AMD3100 20, have already been developed. However, the mechanistic details of CXCR4 upregulation in EOC remained unknown. Our initial finding of upregulation of CXCR4 in response to 3DCI suggested a potential mechanism for strengthening of the CXCR4-SDF1 axis in advanced and metastatic EOC through elevated production of CXCR4 5. The goal of this study was to examine the regulation of CXCR4 expression in EOC cells cultured in organotypic 3DCI gels and to evaluate its potential significance as a target for anti-metastatic intervention. Here we demonstrate that 3DCI, relevant microenvironment of metastatic EOC cells, induced expression of CXCR4 through β1-integrin– and NFκB – dependent mechanism. Moreover, active cell-surface localized CXCR4 was contributing to SDF1-directed cell migration that could be efficiently retarded by blocking CXCR4 function with specific antibodies and AMD3100.
MATERIALS AND METHODS
Materials
The ovarian carcinoma cell lines DOV13, OVCA433, and OVCA429 were kindly provided by Dr. R. Bast, Jr. (M.D. Anderson Cancer Center, Houston, TX) and maintained as previously described 21. OVCAR3 cell line was generously provided by Dr. A. Skubitz (Univ. of Minnesota, Minneapolis, MN). Cell lines SKOV-3, ES2, and Caov-3 were obtained from ATCC and maintained according to the manufacturer’s suggestions. LEAF™ anti-mouse CD29 antibody (clone TS2/16) with adhesion activating function was purchased from Biolegend (San Diego, CA). AMD3100 was obtained from AIDS Reagent Program, NIH (Bethesda, MD). pNFkB1 and pNFkB2 (Panomix) were generously provided by Dr. J.C. Jordan. pEGFP-N1 was obtained from Clontech (Mountain View, CA). pBABE puro SDF-1 alpha 22 (Addgene plasmid 12270) was obtained from Dr. R. Weinberg through Addgene (Cambridge, MA). Control siRNA, CXCR4-specific siRNAs, p65 specific siRNAs, anti-p65 antibody and anti-CXCR4 antibody were purchased from Santa Cruz Biotechnology (Santa Cruz, CA). Human recombinant SDF1 was from Sigma (St. Louis, MO).
Three-Dimensional Matrix Cell Culture Models
We used several three-dimensional cell culture models composed of various matrix components to characterize their interaction with ovarian carcinoma cells and distinguish the impact of matrix geometry and matrix composition on CXCR4 expression. Three-dimensional collagen I (3DCI) (Sigma; St. Louis, MO) gel at 0.8 mg/ml, and synthetic 10% polyethylene glycol (PEG) gels containing 0.3 mM RGDS, were used to mimic three-dimensional matrix conditions encountered by invading ovarian carcinoma cells. Synthetic 10% 4-arm polyethylene glycol acryl (SunBio; Orinda, CA) (PEG-acryl) containing 0.3 mM RGDS (Sigma; St. Louis, MO) was prepared by photocrosslinking during 5 min using 0.5% 2,2-Dimethyl-2-phenyl-acetophenone (Ciba; Tarrytown, NY) in polyvinylpyrrolidone (600mg/ml) as the photoinitiator. Cells were cultured atop three-dimensional matrices for various periods of time as described before 7. Control cells were plated either on 10 μg/ml thin layer collagen I (two-dimensional collagen I or 2DCI) or 10 μg/ml thin layer collagen III (2DCIII), or 0.3 mM RGDS (2D).
RNA extraction, cDNA synthesis, and Quantitative Real Time RT-PCR (QPCR)
RNA was extracted and cDNA synthesized using SV total RNA isolation system (Promega) and cDNA synthesis kit (Quanta). Real time PCR was carried out with the ABI Prizm (Applied Biosystems) according to the manufacturer’s instructions as described before 5. SYBR Green was used for quantitative PCR as a double-stranded DNA-specific fluorophore. Primers for mRNA detection of genes of interest were constructed according to requirements for oligonucleotide primers for real time RT-PCR using Primer3 software (Table 1). RPL-19 was used a housekeeping gene control. Prior to using RPL-19 as a control, it has been established that its expression correlated well with the total RNA concentration and did not change with the time and treatment used in our studies. Efficiency of amplification was determined using the standard curves method. Relative quantification of gene expression between experimental (3DCI) and control (2DCI) samples was measured by normalization against endogenous RPL-19 using the ΔCT method 23. Fold changes were quantified as 2−(ΔCt sample−ΔCt control) as described previously 23. Real time RT-PCR was also used to detect the levels of CXCR4 and SDF1 mRNAs in samples from tissues of normal ovary and ovarian carcinoma patients commercially available from Origene (Rockville, MD) according to the manufacturer’s suggestions. Ct values above 35 were considered negative expression. RPL19 and ACTNB were expressed in each sample as reported before 5.
Table 1.
Sequences of the Primers Used in Real-Time RT-PCR Experiments.
| Gene (official name) | GeneBank Accession Number | Sequence |
|---|---|---|
| CXCR4 (CXCR4) | NM_003467 | Forw: 5′ ACTGGCATTGTGGGCAA 3′ Rev: 5′ GTCCGTCATGCTTCTCA 3′ |
| SDF1 (CXCL12) | NM_000609 | Forw: 5′ GATTCAGGAGTACCTGGAGA 3′ Rev: 5′ CCTACTGTAAGGGTTCCTCA 3′ |
| p65 NFkappaB (RELA) | NM_021975 | Forw: 5′ AGCACAGATACCACCAAGAC 3′ Rev: 5′ CAGTCCTTTCCTACAAGCTC 3′ |
| p50 NFkappaB (NFKB1) | NM_003998 | Forw: 5′ CATATTTGGGAAGGCCTG 3′ Rev: 5′ TGCCATCTGTGGTTGAA 3′ |
| p52 NFkappaB (NFKB2) | NM_002502 | Forw: 5′ CCTACCTCTGATAGCGACTC 3′ Rev: 5′ GCTGTATCACCAAGTGACAG 3′ |
Immunohistochemistry
Immunohistochemical analysis was doneretrospectively on tumor tissue microarrays prepared with Institutional Review Board approval by the Pathology Core Facility of the Robert H. Lurie ComprehensiveCancer Center at Northwestern University assembled from tissueoriginally taken for postoperative diagnostic purposes. Monoclonal antibody against human CXCR4 (R&D Systems; Minneapolis, MN) was used at 1:100 dilution. Procedures and scoring were done as described before 5–7 by anatomic pathologist Dr. Brian P. Adley blinded to the research design.
Calcium Imaging
The intracellular free calcium concentration was measured using digital video microfluorimetry as previously described 24. DOV13 were plated on collagen I coated glass coverslips, rinsed with HEPES buffer followed by addition of 2 mM fura-2 AM (Molecular Probes, Eugene, OR) for 30 min at RT. Complete dye deesterification was achieved by removing fura-2 AM, rinsing, and keeping the cells in the dark for 30 min. Glass coverslips were mounted on the stage of a Nikon Diaphot inverted epifluorescence microscope (Tokyo, Japan) equipped for digital fluorescence microscopy. Fluorescence was digitally monitored at 520 nm after excitation at 340 nm (bound Ca2) and 380 nm (free Ca2+). Ratios of F340/F380 were collected before and during treatment with 20 nM SDF1alpha using MetaFluor software from Universal Imaging Corporation (West Chester, PA).
Transient Transfections
Transient transfections were performed using the lipofection method with Lipofectamine2000 (Invitrogen; Carlsbad, CA) as a vehicle. p65 NFkappaB siRNA, CXCR4 siRNA, control siRNA (Santa Cruz Biotechnology; Santa Cruz, CA), pNFkappaB1, pNFkappaB2, and Renilla luciferase expression constructs, were transiently transfected into DOV13 cells according to the manufacturer’s instructions.
Collagen Invasion
Invasion assays were performed using Transwell chambers (0.8 μm, BD Biosciences; San Jose, CA) and human collagen I (Sigma; St Louis, MO) as described before 25 with the following modifications. Because ovarian carcinoma cells constitutively express MMPs at elevated levels 7,25,26, and SDF1 can be proteolytically degraded by MMPs 27, we modified the experimental setup to have a constant supply of SDF1. Monolayer of COS7 cells was introduced in the bottom of the receptacle 24-well plate (Figure 5A). COS7 cells were transiently transfected with pBABE puro SDF-1alpha expressing plasmid, and ovarian carcinoma cells seeded in the top chamber were allowed to invade through collagen toward SDF1. Control experiments included cell invasion through collagen toward untransfected COS7. To study the role of CXCR4– SDF1 in ovarian carcinoma invasion, DOV13 were pre-incubated with CXCR4 blocking antibodies (AnaSpec; San Jose, CA), nonspecific IgG (Santa Cruz Biotechnology; Santa Cruz, CA), or a specific CXCR4 antagonist AMD3100 for 20 min and allowed to invade toward COS7 expressing SDF1.
Figure 5. The CXCR4-SDF1 axis in ovarian carcinoma cell invasion.
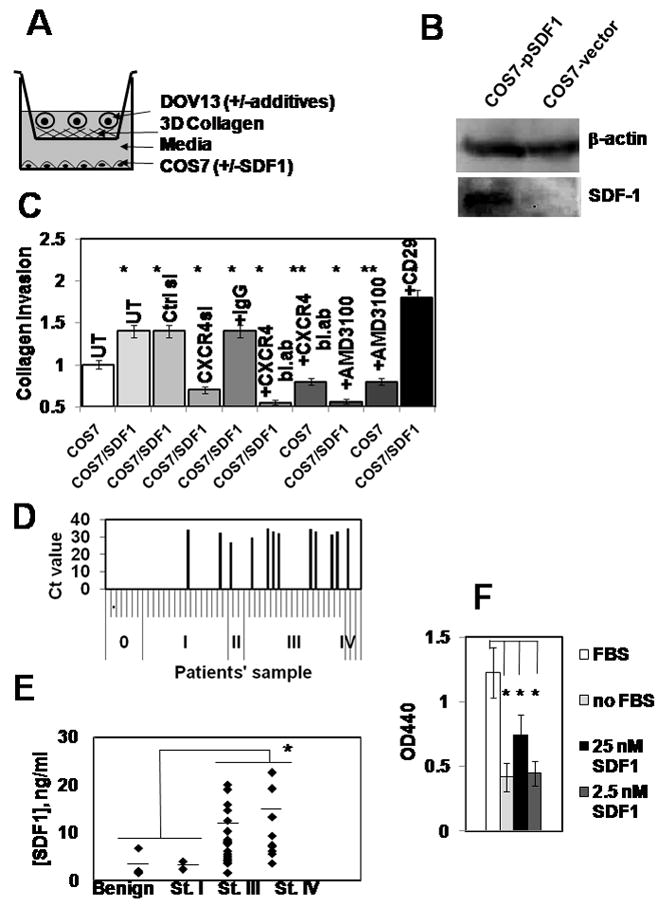
(A) A schematic representation of an invasion chamber setup used in the experiments. Dov13 cells were seeded into the inner well of a Boyden chamber overlaid with 3DCI in the presence or absence of additives (antibodies, small molecule inhibitors). The well was placed in an outer chamber containing a layer of COS7 cells transfected with control or SDF-1 expression vector. The number of cells penetrating the 3DCI gel and adherent to the lower surface of the filter was enumerated and is shown in (C). (B) Cells were transiently transfected with pBABE-SDF1 and a control vector containing no SDF1-specific sequence insert, collected and lysed. 20μg of the total protein lysates was subjected to Western blot and probed with SDF1-specific antibodies and β-actin specific antibodies (loading control). (C) DOV13 cells were transiently transfected with control or CXCR4-specific siRNAs or pre-incubated in the presence or absence of CXCR4-blocking antibodies (0.2μg/ml), non-specific IgG (0.2 μg/ml), AMD3100 (10 μM), or adhesion activating CD29 clone TS2/16 antibodies (1:100 dilution) and allowed to invade for 18 hours toward COS7 expressing SDF1, or control vector, as indicated. Experiments were performed four times, each in triplicate, averaged, and plotted on a graph as a percent of invading cells, standard error of ±10%. DOV13 without additives, invading toward COS7 monolayer (white open bar) was arbitrarily set as 100% of invasion; *p<0.05, **p>0.05. (D) Expression of SDF1 in human ovarian carcinoma specimens detected using real time RT-PCR. Black bars in the histograms represent the values of the cycle numbers at which the accumulation of fluorescent signal from SYBR Green bound to the gene-specific double-stranded DNA PCR product was above the background. Absence of the black bars indicates no accumulation of the specific PCR product. A total of 48 samples were tested. Results for samples from 1–48 are plotted from left to right on the x axis and separated by small ticks. Samples from normal ovary are designated ‘0’, and those belonging to ovarian carcinoma FIGO stages I, II, III, IV, are indicated as ‘I’, ‘II’, ‘III’, ‘IV’, respectively, and are separated by long ticks. (E) Malignant and nonmalignant ascites samples were obtained from women diagnosed with benign ovarian cysts (n=6), Stage I (n=2), Stage III (n=21), and Stage IV (n=10) EOC. Patients ascites samples were analyzed using ELISA according to the manufacturer’s specifications to determine the levels of CXCL12/SDF1 alpha; * p<0.05. Average for each group is shown with a vertical bar line across the individual values. (F) Cell Proliferation Assay. DOV13 were plated on 48 well plates, allowed to adhere followed by o/n serum starvation. Proliferation was initiated by addition of complete media (FBS; open bar), serum-free media (no FBS; light grey bar), 25 nM SDF1 in serum-free media (black bar), and 2.5 nM SDF1 in serum-free media (dark grey bar) and incubation for 24h. Proliferation was measured by addition of WST-1 to the growing cells followed by 1 hour incubation and measurement of OD440. Experiments were repeated 4 times, each in triplicate, averaged and plotted ±standard error; * p<0.05.
Western Blotting
Procedures were performed as described before 5–7. The antibodies were used at the following dilutions: 1:200 for human anti-SDF1 antibodies (Santa Cruz Biotechnology; Santa Cruz, CA) in 3% bovine serum albumin (BSA; Sigma; St. Louis, MO), 1:200 for human anti-CXCR4 polyclonal antibody (Santa Cruz Biotechnology, Santa Cruz, CA) in 3% bovine serum in TBST, 1:1000 for anti-β-tubulin monoclonal antibody (Sigma; St. Louis, MO) in 5% skim milk in TBST, 1:2000 for anti-p65 NFkappaB polyclonal antibodies (Rockland; Gilbertsville, PA) in 3% BSA, 1:2000 for anti-actin monoclonal antibodies (Abcam, Cambridge, MA) in 5% skim milk in TBST. Immunoreactive bands were visualized with an anti-(rabbit-IgG)-peroxidase or anti-(mouse-IgG)-peroxidase (Rockland; Gilbertsville, PA) (1:1000 in 5% skim milk in TBST) and enhanced chemiluminescence using LAS3000 (Fujifilm) and LAS3000 ImageReader software.
Luminescence Measurements
NFkappaB activity was detected in cells transfected with Renilla luciferase construct and either pNFkB1 or pNFkB2 reporter luciferase constructs cultured on 2DCI and 3DCI using Dual Luciferase system (Promega; Madison WI) according to the manufacturer’s suggestions.
ELISA
Ascites samples from 39 patients with benign (n=6) and malignant (n=33) ovarian disease obtained with IRB approval by Northwestern University were analyzed for SDF1 using Human CXCL12/SDF1 alpha Quantikine ELISA kit (R&D Systems; Minneapolis, MN).
Cell Proliferation
Cell proliferation kit based on the cleavage of the tetrazolium salt WST-1 to formazan by cellular mitochondrial dehydrogenases (BioVision; Mountain View, CA) was used according to the manufacturer’s instructions.
Confocal Imaging
To visualize CXCR4 in DOV13 cells cultured on 2DCI and 3DCI cells were fixed for 10 min on ice using 4% paraformaldehyde solution, permeabilized with 0.01% Triton X-100 and blocked in 5% BSA for 1 h at room temperature followed by incubation with 1:100 dilution of the primary anti-CXCR4 antibody (AnaSpec; Santa Clara, CA) for 1 hour, then with a 1:500 dilution of secondary anti-rabbit Alexa488-congugated IgG. Staining was visualized using Zeiss Pascal confocal microscope and integrated software using 60× objective. Exposure times were set according to the cells in 2DCI in order to visualize weak membranous CXCR4 staining. Z-stacks of the entire cell had been acquired.
RESULTS
CXCR4 is Upregulated by Organotypic Three-Dimensional Collagen I Culture and Is Associated with Advanced and Metastatic Ovarian Carcinoma
Interaction of ovarian carcinoma cells with three-dimensional collagen I gels can be used as a simplified model to identify novel genes potentially associated with EOC intraperitoneal metastasis, especially when coupled with cDNA microarray analysis and validation of the in vitro findings in human EOC specimens 5,28. Using this model to elucidate novel targets for anti-metastatic intervention has revealed upregulation of an important migration-related protein receptor, CXCR4 5. In the current study, EOC cell culture on 3DCI resulted in significant upregulation of CXCR4 in four out of six tested ovarian carcinoma cell lines including DOV13, OVCA433, SKOV-3, and Caov-3 (Figure 1A). Interestingly ES2 cells, representative of the clear cell EOC histotype, were characterized by very low expression of CXCR4 (Ct value of 34 when Ct for housekeeping gene RPL19 was 20) that was further decreased upon 3DCI stimulation (data not shown). Upregulation of CXCR4 RNA was accompanied by increased levels of CXCR4 protein in lysates of OVCA433, SKOV-3, Caov-3, and DOV13 cells cultured in 3DCI (Figure 1B). As the membrane bound CXCR4 participates in SDF1-mediated chemotaxis, the cellular localization of CXCR4 was evaluated in cells grown on thin layer vs 3-dimensional collagen I using immunofluorescent confocal microscopy. Total CXCR4 staining was enhanced in cells cultured on 3DCI, with particular enrichment at the tips of filopodial protrusions (Figure 1C).
Figure 1. CXCR4 is Upregulated by 3DCI in EOC cells.
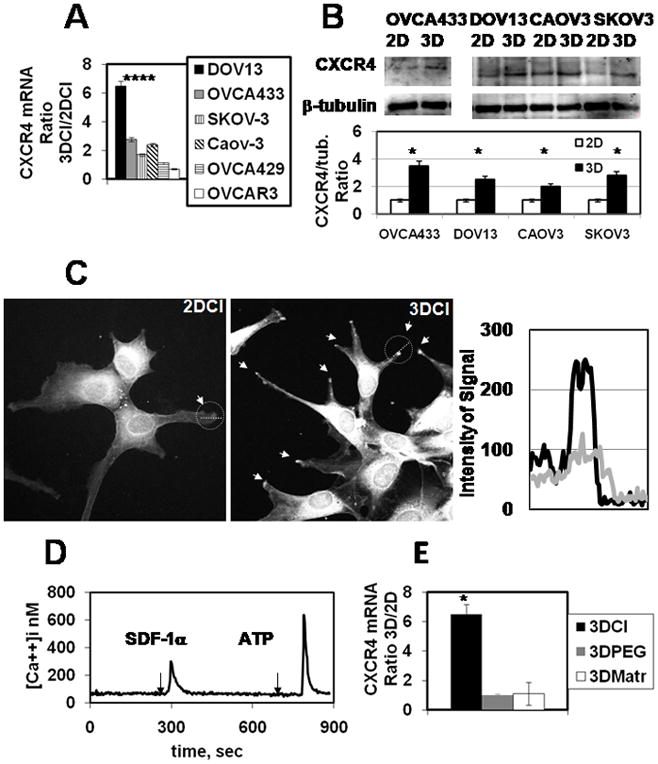
(A) Ovarian carcinoma cell lines DOV13, OVCA433, SKOV-3, Caov-3, OVCA429, and OVCAR3 were cultured on 2DCI and 3DCI for 8 hours. Cells were collected, RNA extracted, cDNA synthesized, and CXCR4 RNA was detected using real time RT-PCR as described in Methods. CXCR4 RNA ratio was found with 2−ΔΔCt method 23, averaged (n=4) and plotted. *p < 0.005 (Student’s t-test; comparisons: Ct values on 2DCI vs those on 3DCI).
(B) OVCA433, SKOV-3, Caov-3, and DOV13 were cultured on 2DCI and 3DCI for 24 hours and subjected to Western blot thereafter. CXCR4-specific antibodies (Santa Cruz Biotechnology) were used at 1:200 dilution; anti-β-tubulin antibody was used at 1:1000 dilution, as indicated in Methods. Histogram demonstrates levels of CXCR4 expression relative to the loading control β-tubulin; *p < 0.005 (Student’s t-test; comparisons included normalized band intensities on 2DCI versus those on 3DCI).
(C) DOV13 were cultured on 2DCI and 3DCI for 24 hours and subjected to immunofluorescent staining. CXCR4-specific antibodies were used at 1:100 dilution. Confocal images were obtained using Zeiss confocal microscope at 60× magnification on the objective. Arrows show accumulation of CXCR4 on the tips of protruding pseudopodia in cells cultured in 3DCI, as indicated. Intensity of the CXCR4 staining was quantified from confocal images using ImageJ (NIH). Lines (white dotted) outlined with a circle were drawn across the tips of the protruding lamellipod (2DCI) and pseudopod (3DCI) to generate the intensity scan. Intensities of CXCR4 expression across the protrusions is plotted on the graph. A light grey line represents CXCR4 in protrusions of cells cultured on 2DCI, and a black line represents CXCR4 in protrusions of cells cultured on 3DCI, as indicated. Shown are representative images of three independent experiments. (D) SDF-1 induces [Ca2+]i changes in DOV13. Cells were imaged with digital video microfluorimetry as described in Methods during 15 min as indicated. DOV13 responded to SDF-1 and ATP. A total of 46 cells (96%) from three independent experiments of 48 total (all cells in the field of view) showed [Ca2+]i increase when stimulated by SDF1. ATP-induced Ca responses were present in all cells tested. (E) DOV13 was cultured on 3DCI, 2DCI, 3DPEG, RGD-coated plates, 3DMatrigel and thin-layer Matrigel for 8 hours. Cells were collected, RNA extracted, cDNA synthesized, and CXCR4 RNA was detected using real time RT-PCR as described in Methods. CXCR4 RNA ratio was found with 2−ΔΔCt method 23, averaged (n=3) and plotted. Black bar representing CXCR4 expression on 3DCI is from Figure 1A and is shown here for comparison; *p<0.05 (comparisons: Ct values on 2D vs those on 3D for all matrices).
A robust SDF1-induced Ca response signal indicated functional CXCR4 in DOV13 cells (Figure 1D). Organotypic collagen culture places cells in a constrained 3-dimensional milieu, but also engages collagen binding integrins. To differentiate which of these stimuli was responsible for CXCR4 induction DOV13 cells were cultured in 3-dimensional synthetic polyethylene glycol (PEG) gels to provide a 3-dimensional milieu in the absence of integrin engagement, or in Matrigel to engage type IV collagen and laminin-1-binding integrins. Only 3D gels comprised of type I collagen induced strong upregulation of CXCR4, while PEG gels and Matrigel did not significantly modulate expression (Figure 1E). This implies a potential involvement of β1-integrins in the mechanism of CXCR4 upregulation.
Examination of CXCR4 expression in normal ovarian surface epithelium and in EOC specimens from stage I–IV tumors showed a progressive increase in CXCR4 expression from early stage (I–II) to late stage (III–IV) tumors (Table 1; Figure 2A), with a smaller overall percentage of CXCR4-positive non-malignant normal ovarian tissues (Figure 2A). This is supported by immunohistochemical examination of 13 paired specimens of primary tumor and peritoneal metastasis from the same surgical procedure. While CXCR4 expression was detected in only 1 primary tumor (8%), positive CXCR4 immunoreactivity was observed in 46% of metastases (Figure 2B).
Figure 2. CXCR4 Is Overexpressed in Advanced and Metastatic Human Ovarian Carcinomas.
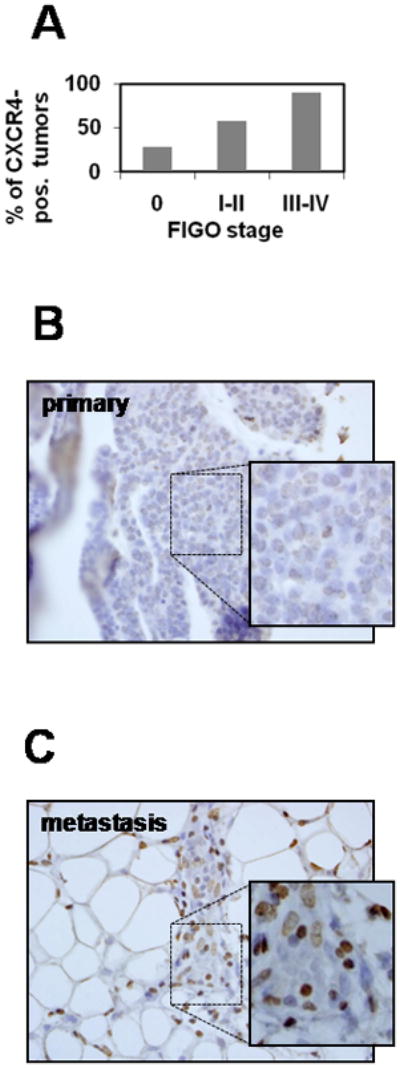
(A) Quantitative analysis of CXCR4-positive samples (% of total for each group) belonging to normal ovary, early stage (I–II), and late stage (III–IV) EOC from Table 2. A representative example of immunohistochemical analysis of CXCR4 expression in (B) primary (FIGO Stage III) and (C) paired metastatic omental specimens of serous ovarian carcinoma is shown. Inserts are 2-fold magnifications of the outlined regions on the tissue specimens largely containing ovarian carcinoma cells. Brown staining – CXCR4; blue - hematoxylin. Tumor tissue microarrays were prepared by the Pathology Core Facility of the Robert H. Lurie Comprehensive Cancer Center at Northwestern University assembled from tumor tissue originally taken for routine diagnostic purposes with Institutional Review Board approval.
Upregulation of CXCR4 on 3DCI through NFκB Is Mediated by β1-Integrin Signaling
Our observations suggested that CXCR4 was upregulated by the 3DCI, but not other 3D matrices and the planar substrata (Figure 1E). It has been previously demonstrated that 3DCI engages α3β1 and α2β1-integrins on the surface of the EOC cells 25,26. Based on these findings, we tested whether β1-integrin signaling pathway is regulating expression of NFκB and, subsequently, CXCR4. Cells were pre-incubated with CD29 antibodies at 1:100 dilution for 20 min and then cultured on 2DCI and 3DCI for 30 min, 1, 2, and 4 hours. Cells were collected, RNA extracted, cDNA synthesized followed by QPCR detection of p65 (RELA) and CXCR4 RNAs. Our results showed that already after 30 min of 3DCI culture p65 was significantly upregulated in the presence of adhesion activating antibodies (Figure 3A). Subsequently, upregulation of CXCR4 was significantly stronger in the presence of CD29 antibodies already after 2 hours of culture (Figure 3B), indicating that upregulation of p65 (RELA) and CXCR4 on 3DCI is regulated through β1-integrin signaling.
Figure 3. Upregulation of p65 (RELA) and CXCR4 on 3DCI is regulated by β1-integrin signaling.
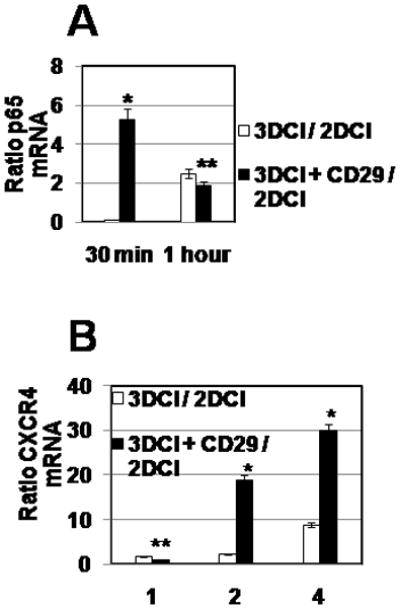
DOV13 cells were pre-incubated with 1:100 dilution of CD29 antibody, as well as mouse IgG antibodies, for 20 min at 37 C followed by 2DCI and 3DCI culture for 30 min and 1 hour (A) and for 1, 2, and 4 hours (B). Cells were collected, RNA extracted, cDNA synthesized, followed by the QPCR detection of p65 and CXCR4 expression. CXCR4 RNA ratio was found with 2−ΔΔCt method 23, averaged (n=3) and plotted. *p<0.05 and **p>0.05 (Student’s t-test; comparisons included ratios in the absences vs those in the presence of CD29 antibody).
NFkappaB Participates in CXCR4 Regulation by 3DCI
To elucidate the molecular mechanisms by which 3DCI culture regulates the expression of CXCR4 in EOC cells, experiments were performed to examine the involvement of NFkappaB signaling. The rationale for this approach is based on data showing NFkappaB-dependent CXCR4 expression in breast, prostate, and lung cancer 29,30,31, with particular emphasis on involvement of the p65 catalytic subunit (RELA) of the NFkappaB complex. To evaluate whether NFkappaB signaling is activated in EOC cells cultured on 3DCI, cells were transfected with pNFkB1 and pNFkB2 luciferase reporter constructs containing multiple copies of NFkB binding sequence upstream of a minimal TA promoter and the TATA box from the Herpes simplex virus thymidine kinase promoter driving expression of luciferase gene, followed by culture on 3DCI or thin layer collagen I (2DCI). Increased signal arising from NFkappaB reporter luciferase constructs was observed in cells cultured in 3DCI compared to 2DCI (Figure 4A), suggesting enhanced activation of the NFkappaB pathway in 3DCI. To further evaluate the potential involvement of NFkappaB signaling in upregulation of CXCR4 induced by 3DCI, expression of the p65 subunit was silenced using specific siRNA, cells were cultured on 3DCI or 2DCI, and expression of CXCR4 was evaluated using qPCR. Silencing of p65 efficiently eliminated the 3DCI-induced upregulation of CXCR4, while high level expression was maintained in cells transfected with control siRNA and PBS (Figure 4B,C). The p65 subunit of NFkappaB can form a complex with either the p50 or p52 subunits to make a fully functional transcriptionally active complex 32. Analysis of human EOC RNAs showed expression of p65, p50, and p52 in human ovarian tumors (Table 2). Further, out of 41 tested human ovarian carcinoma RNAs, 63% (26) expressed either one or both subunit combinations (p65/p50 and p65/p52) that would allow for assembly of functional NFkappaB. Comparison of the CXCR4 co-expression with p65/p50 or p65/p52 revealed that 72% of CXCR4-positive ovarian carcinoma specimens also express either or both p65/p50 and p65/p52, suggesting that NFkappaB-mediated upregulation of CXCR4 may occur in a significant number of human disease specimens (Table 2).
Figure 4. NFκB signaling in regulation of CXCR4 expression.
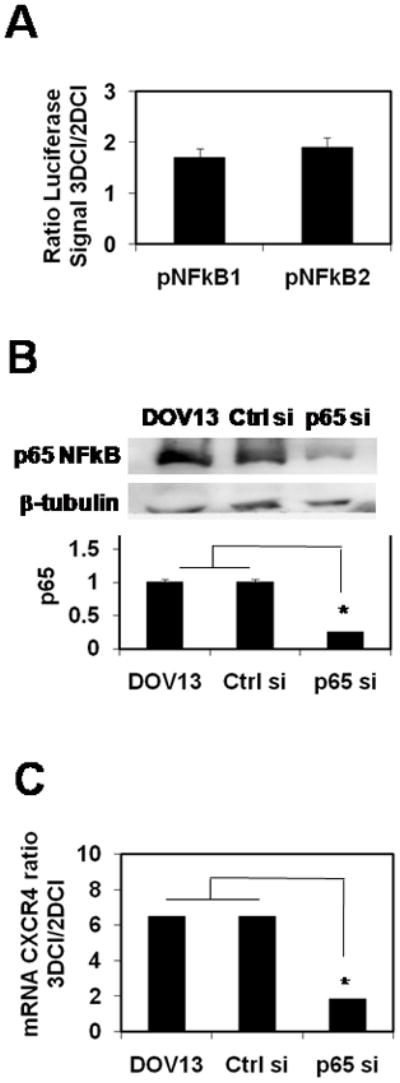
(A) Cells were transiently transfected with combinations of pNFkB1 and Renilla luciferase construct, or pNFkB2 and Renilla luciferase construct, plated on 2DCI and 3DCI for 6 hours. Luciferase signal was collected as described in Methods. Ratio of normalized Firefly luciferase signal from cells cultured on 3DCI to that from cells on 2DCI ±standard error (average of 3 experiments) is plotted.
(B) DOV13 cells were transiently transfected with PBS, control siRNA, and p65NFκB-specific siRNA, followed by cell culture on 2DCI and 3DCI for 8 hours. Efficiency of the p65-specific siRNA was evaluated with Western blot. Histogram demonstrates the levels of p65 subunit of NFκB in DOV13 transfected, or not, with control siRNA and p65 siRNA, as indicated. Average of 2 independent experiments presented; *p<0.05.
(C) Cells were collected, RNA extracted, cDNA synthesized, and CXCR4 RNA was detected using real time RT-PCR as described in Methods. CXCR4 RNA ratio was found with 2−ΔΔCt method 23, averaged (n=4) and plotted. Data representing the ratio of CXCR4 RNA on 3DCI compared to 2DCI are from Figure 1A and are displayed for comparison.
Table 2.
RNA Expression of CXCR4, p65, p50, and p52 Subunits of NFkB in Epithelial Ovarian Carcinoma and Normal Ovary Human Specimens.
| Diagnosis * | Tumor Grade * | Stage** | CXCR4 *** | p65 NFkB *** | p50 NFkB *** | p52 NFkB *** | CXCR4/NFkB **** |
|---|---|---|---|---|---|---|---|
| Adenocarcinoma of endometrium, papillary serous | FIGO G3: Poorly differentiated | 0 | no | yes | yes | yes | |
| Carcinoma of cervix, squamous cell | FIGO G3: Poorly differentiated | 0 | yes | no | yes | yes | |
| Abscess of tissue | Not Reported | 0 | no | yes | yes | yes | |
| Endometriosis | Not Reported | 0 | no | yes | yes | no | |
| Endometriosis | Not Reported | 0 | no | yes | yes | yes | |
| Endometriosis | Not Reported | 0 | no | no | no | no | |
| Endometriosis | Not Reported | 0 | no | yes | no | no | |
| Carcinoma of ovary, endometrioid | FIGO G2: Moderately differentiated | I | no | no | no | yes | |
| Adenocarcinoma of ovary, papillary serous | FIGO G2: Moderately differentiated | IA | yes | yes | yes | no | √ |
| Tumor of ovary, papillary serous, borderline | AJCC GB: Borderline malignancy | IA | no | no | no | no | |
| Tumor of ovary, papillary serous, borderline | AJCC GB: Borderline malignancy | IA | no | no | yes | no | |
| Carcinoma of ovary, endometrioid | FIGO G1: Well differentiated | IA | yes | yes | no | yes | √ |
| Tumor of ovary, serous, borderline | AJCC GB: Borderline malignancy | IA | yes | yes | no | yes | √ |
| Tumor of ovary, borderline | AJCC GB: Borderline malignancy | IA | no | yes | yes | yes | |
| Tumor of ovary, mucinous, borderline | AJCC GB: Borderline malignancy | IA | yes | yes | yes | yes | √ |
| Adenocarcinoma of ovary, mucinous | FIGO G3: Poorly differentiated | IB | no | yes | yes | yes | |
| Adenocarcinoma of ovary, endometrioid | FIGO G3: Poorly differentiated | IB | yes | no | yes | no | |
| Tumor of ovary, borderline | Not Reported | IB | yes | yes | yes | yes | √ |
| Tumor of ovary, mucinous, borderline | AJCC GB: Borderline malignancy | IC | no | yes | yes | yes | |
| Tumor of ovary, serous, borderline | AJCC GB: Borderline malignancy | IC | no | yes | yes | yes | |
| Tumor of ovary, serous, borderline | AJCC GB: Borderline malignancy | IC | no | no | yes | no | |
| Adenocarcinoma of ovary, mucinous | FIGO G2: Moderately differentiated | IC | no | yes | no | no | |
| Adenocarcinoma of ovary, endometrioid, squamous features | FIGO G2: Moderately differentiated | IC | yes | yes | no | yes | √ |
| Adenocarcinoma of ovary, serous | FIGO G3: Poorly differentiated | IIB | yes | yes | no | yes | √ |
| Adenocarcinoma of ovary, endometrioid | FIGO G3: Poorly differentiated | IIB | yes | yes | no | no | |
| Adenocarcinoma of ovary, endometrioid | FIGO G1: Well differentiated | IIC | yes | yes | no | yes | √ |
| Adenocarcinoma of ovary, papillary serous | FIGO G2: Moderately differentiated | III | yes | yes | yes | yes | √ |
| Adenocarcinoma of ovary, serous | FIGO G3: Poorly differentiated | III | yes | yes | yes | yes | √ |
| Carcinoma of ovary, endometrioid | FIGO G2: Moderately differentiated | IIIA | yes | yes | yes | yes | √ |
| Tumor of ovary, serous, borderline | AJCC GB: Borderline malignancy | IIIA | yes | yes | yes | yes | √ |
| Adenocarcinoma of ovary, papillary serous | FIGO G3: Poorly differentiated | IIIB | no | yes | no | no | |
| Adenocarcinoma of ovary, serous | FIGO G2: Moderately differentiated | IIIB | yes | yes | no | no | |
| Adenocarcinoma of ovary, endometrioid | FIGO G3: Poorly differentiated | IIIB | yes | yes | yes | no | √ |
| Adenocarcinoma of ovary, papillary serous | FIGO G2: Moderately differentiated | IIIB | yes | yes | yes | yes | √ |
| Adenocarcinoma of ovary, papillary serous | FIGO G3: Poorly differentiated | IIIB | yes | yes | no | no | |
| Tumor of ovary, serous, borderline | Not Reported | IIIB | no | yes | no | no | |
| Adenocarcinoma of ovary, metastatic | Not Reported | IIIB | yes | yes | yes | yes | √ |
| Adenocarcinoma of ovary, papillary serous | FIGO G1: Well differentiated | IIIC | no | yes | yes | yes | |
| Adenocarcinoma of ovary, papillary serous | FIGO G3: Poorly differentiated | IIIC | yes | yes | yes | no | √ |
| Adenocarcinoma of ovary, papillary serous | FIGO G3: Poorly differentiated | IIIC | yes | no | no | no | |
| Adenocarcinoma of ovary, papillary serous | FIGO G3: Poorly differentiated | IIIC | yes | no | yes | yes | |
| Adenocarcinoma of ovary, papillary serous | FIGO G3: Poorly differentiated | IIIC | yes | yes | no | yes | √ |
| Carcinoma of ovary | FIGO G3: Poorly differentiated | IIIC | yes | yes | yes | no | √ |
| Adenocarcinoma of ovary, papillary serous | Not Reported | IIIC | yes | no | no | yes | |
| Adenocarcinoma of ovary, serous | Not Reported | IIIC | yes | yes | yes | no | √ |
| Adenocarcinoma of ovary, papillary serous | FIGO G2: Moderately differentiated | IV | yes | yes | no | yes | √ |
| Adenocarcinoma of ovary, metastatic | Not Reported | IV | yes | yes | yes | no | √ |
| Adenocarcinoma of ovary, papillary serous | FIGO G3: Poorly differentiated | IV | yes | no | no | yes |
information obtained from the manufacturer (OriGene) regarding Ovarian Carcinoma Panel I
information on Stage is related to ovarian carcinoma
positive expression defined by Ct value below 35 is indicated ‘yes’; negative expression defined by the absence of a detectible signal or Ct value equal or higher that 35 is indicated ‘no’
cases that simultaneously express CXCR4 and p65/p50 or p65/p52 or both combinations of subunits combined into NFkB complex (marked √)
CXCR4-SDF1 Axis in Invasion of 3-Dimensional Collagen I Gels and Proliferation
To examine the potential functional consequences of CXCR4 activation by 3DCI, penetration of EOC cells through 3DCI gels was evaluated. This assay employed a modified Boyden chamber 3DCI invasion assay 25 containing SDF1 as a chemoattractant. Our previous data demonstrated that expression of SDF1 in EOC cells is not regulated by 3DCI 5. As ovarian carcinoma cells express matrix metalloproteinases that are able to enzymatically inactivate SDF1 27, instead of creating a solution containing SDF1, a constant source of SDF1 was introduced into the system. Monolayer COS-7 cells transfected with pBABE/SDF-1 were plated on the bottom of the invasion chamber receptacle, providing constant SDF1 in the system (Figure 5A). Transfection efficiency was monitored using green fluorescence emitting from co-transfected pEGFP-N1. COS-7 transfected with a vector control did not express SDF1 in contrast to the cells transfected with pBABE-SDF1 (Figure 5B). Ovarian carcinoma cells were seeded atop 3DCI and allowed to invade through collagen toward the lower chamber containing SDF1. Collagen invasion was significantly enhanced by the presence of SDF1 in the outer chamber compared to the control conditions containing only vector-transfected COS-7 cells (Figure 5C). Downregulation of CXCR4 expression with specific siRNAs markedly decreased cell invasion toward SDF1. SDF1-mediated invasion was dramatically reduced when DOV13 cells were pre-treated with CXCR4-blocking antibodies, while addition of non-specific IgG did not retard SDF1-mediated invasion (Figure 5C). Addition of a specific antagonist of CXCR4, AMD3100, also dramatically reduced SDF1-mediated invasion (Figure 5C). AMD 3100 is a small molecule inhibitor of CXCR4, binding of which to the receptor prevents SDF1 binding 20. In control experiments with cell invading toward COS7 not overexpressing SDF1 addition of either AMD3100 or CXCR4 function blocking antibodies only slightly reduced the levels of invasion. On the other hand, addition of the beta-1 integrin activating antibody CD29 33 increased invasion (Figure 5C). These data demonstrate that the CXCR4-SDF1 axis is activated through beta-1 integrin dependent signaling and it can regulate ovarian carcinoma invasive activity.
It has been demonstrated that SDF1 is produced by many cell types, including stromal fibroblasts, macrophages, and cancer cells themselves 18,34,35,36. Evaluation of SDF1 expression by human ovarian carcinoma specimens indicated that expression increased with disease progression, as only 16% of early stage (I–II) specimens were SDF1-positive compared to 41% SDF-positive for advanced stage (III–IV) specimens (Figure 5D). Soluble factors in ascites fluid provide an important contribution to the ovarian cancer microenvironment. Analysis of SDF1 levels in ascites using ELISA demonstrated that SDF1 levels were significantly elevated (more than 3-fold, p<0.05) in ascites from women with late stage (III and IV) EOC compared with early stage I and benign disease (Figure 5E). However, 3DCI did not affect SDF1 expression in EOC cells (5).
Our findings (Figure 5F) are in agreement with the previously published data demonstrating the effect of SDF1 on EOC cell proliferation 37. Interestingly, low levels of SDF1 (2.5 nM) found in non-malignant ascites did not induce a noticeable cell proliferation, whereas higher SDF1 levels (25 nM) characteristic of malignant ascites resulted in a significant increase in cell proliferation (Figure 5F).
DISCUSSION
Epithelial ovarian carcinoma is the most common gynecologic malignancy with the highest rate of mortality. Metastatic disease leads to death in the majority of patients, while early stage EOC can be effectively treated with a combination of chemotherapy and surgery. The lack of reliable early detection markers coupled with the anatomic location of the ovaries results in the prevalence of patients diagnosed with late stage disease, with a concomitant likelihood that micro- and macro-metastasis have already occurred. Metastatic ovarian carcinoma cells are empowered by a multitude of largely unknown mechanisms that support invasion, migration, and metastasis. Currently used treatments against EOC metastasis are ineffective and development of new treatments is limited by the lack of knowledge about the biology of metastasis.
The peritoneum is the primary site for metastatic anchoring and the size of metastases can exceed that of the primary tumor, suggesting the presence of a specific microenvironmental factor(s) that attracts disseminating cells to the peritoneum and supports proliferation. Collagen-rich matrix is a host tissue for EOC intraperitoneal metastasis. According to our data, interaction of EOC cells with 3D collagen leads to a dramatic remodeling of the gene expression machinery 5 and leads to engagement of integrins 25,38. It is impossible to either eliminate collagenous matrix from the metastatic sites or restrict EOC cell interaction with this matrix when the metastasis had occurred. However, comprehensive investigation into the possible gene expression change is important in order to approach the treatment of metastasis rationally.
Studies of many cancer types suggest the importance of the CXCR4-SDF1 axis in metastatic spread 39,40. In breast carcinoma CXCR4-SDF1 interaction results in development of lung, liver, and bone metastasis, due to high level of SDF1 in these organs 40. The CXCR4/SDF1 axis plays a key role in peritoneal seeding of gastric carcinoma as well 41. Our findings support a model for functional cooperation between malignant EOC cells and their microenvironment that results in retention in the peritoneum through engagement of CXCR4-SDF1 axis. EOC cells anchor secondary lesions in the collagen-rich submesothelial matrix of peritoneal organs. The current data and previous reports demonstrate that advanced and metastatic human ovarian carcinoma tissues express elevated CXCR4 37,42,43. Furthermore, interaction of multiple EOC cell types with organotypic three-dimensional collagen gels induces robust upregulation of CXCR4 in a β1-integrin and NFκB-dependent fashion, providing a mechanism for enhanced activation of the CXCR4-SDF1 axis. This is further supported by ELISA data showing that peritoneal ascites from women with ovarian cancer are rich in SDF1 that may be produced by a variety of cells including stromal macrophages. The host tissue is thereby primed to receive invading cells that can successfully colonize and proliferate, enhancing morbidity. Thus, the novel pathway of upregulation of CXCR4 by 3DCI through β1-intergrins and NFκB described in this report is particularly relevant to the EOC metastasis.
The abundance of CXCR4-positive advanced primary and metastatic tumor tissues combined with widespread SDF1 expression in malignant ascites makes CXCR4-SDF1 interaction an attractive target for anti-metastatic intervention. Moreover, elevated levels of SDF1 in malignant ascites indicate a possible strengthening of this axis in the metastatic stages of EOC.
Our studies, as well as those of others, demonstrate efficient inhibition of cell invasion upon addition of a specific CXCR4 antagonist, AMD3100 both in vitro 17,18 and in vivo19. Interestingly, manipulation of the CXCR4 expression or activity through specific siRNAs, function blocking antibodies, and AMD3100, led to decrease in cell invasion below the control levels (Figure 5C), suggesting that CXCR4 may play a role in other signaling pathways regulating cell migration and invasion. As our invasion assay is designed to measure both collagenolysis and cell migration, it is likely that expression of collagenolytic MT1-MMP and/or cytoskeletal proteins was concomitantly deregulated as a result of manipulation of CXCR4. MT1-MMP could be partially regulated through CXCR4 – SDF1, as previously suggested 44,45. The studies suggested that CXCR4 and MT1-MMP coordinate their actions during the process of melanoma metastasis in a way that supports the requirement of CXCR4 in early stages, when cells arrive at sites of metastasis, and necessity of MT1-MMP in late stages, when metastatic cells invade and disseminate 44. Furthermore G-protein coupled receptor CXCR4 regulates signaling of multiple pathways, including Akt pathway 46, which, in its turn, regulates expression of MT1-MMP 47, 48, 49. GPCRs are upstream regulations of Rho pathway 50, regulating cell migration 51. In light of these findings, it is interesting to speculate that reduced invasion of cells with blocked or silenced CXCR4 may also be due to perturbation of signaling pathways downstream of CXCR4.
Moreover, SDF1 is a known inducer of EOC cell proliferation 37. In our experiments, only the high levels of SDF1 found in malignant ascites were able to induce EOC cell proliferation. Our data demonstrate that the presence of CXCR4 on cell surface as well as the presence of elevated levels of SDF1 in late stage EOC leads to enhancement of at least two crucial properties necessary for metastatic cell survival, invasion and proliferation. These data suggest that disruption of CXCR4-SDF1 may retard peritoneal dissemination and proliferation of metastatic ovarian cancer, resulting in improved outcomes for women with ovarian cancer. Furthermore, therapeutic targeting of the intermediate players in this signaling cascade, such as NFκB and β1-integrin will provide additional options for directed exclusion of pathways that determine the well-being of the metastatic cell.
Acknowledgments
This work was supported by Ovarian Cancer Research Foundation (MVB), Penny Severns Breast, Cervical, and Ovarian Cancer Fund from Illinois Department of Public Health (MVB), and National Cancer Institute Research grants CA109545 (MSS) and CA86984 (MSS).
The authors thank Dr. Penzes for allowing access to a Zeiss confocal microscope. The authors wish to gratefully acknowledge the Robert H. Lurie Comprehensive Cancer Center Pathology Core Facility for ovarian tumor tissues and Dr. Brian P. Adley (Lutheran General Hospital, IL) for scoring of the immunohistochemical analyses.
Footnotes
DISCLOSURE OF POTENTIAL CONFLICT OF INTEREST
The authors declare no conflict of interest.
References
- 1.Jemal A, Siegel R, Ward E, et al. CA: a Cancer Journal for Clinicians. 2006;56(2):106. doi: 10.3322/canjclin.56.2.106. [DOI] [PubMed] [Google Scholar]
- 2.Cannistra SA. New England Journal of Medicine. 1993;329(21):1550. doi: 10.1056/NEJM199311183292108. [DOI] [PubMed] [Google Scholar]
- 3.Casey RC, Skubitz AP. Clinical & Experimental Metastasis. 2000;18(1):67. doi: 10.1023/a:1026519016213. [DOI] [PubMed] [Google Scholar]
- 4.Lessan K, Aguiar DJ, Oegema T, et al. American Journal of Pathology. 1999;154(5):1525. doi: 10.1016/s0002-9440(10)65406-5. [DOI] [PMC free article] [PubMed] [Google Scholar]
- 5.Barbolina MV, Adley BP, Kelly DL, Fought AJ, Scholtens DM, Shea LD, Stack MS. Lab Invest. 2008;88(6):602. doi: 10.1038/labinvest.2008.25. [DOI] [PMC free article] [PubMed] [Google Scholar]
- 6.Barbolina MV, Adley BP, Shea LD, et al. Cancer. 2008;112(7):1632. doi: 10.1002/cncr.23341. [DOI] [PubMed] [Google Scholar]
- 7.Barbolina MV, Adley BP, Ariztia EV, et al. J Biol Chem. 2007;282(7):4924. doi: 10.1074/jbc.M608428200. [DOI] [PubMed] [Google Scholar]
- 8.Feng Y, Broder CC, Kennedy PE, et al. Science. 1996;272(5263):872. doi: 10.1126/science.272.5263.872. [DOI] [PubMed] [Google Scholar]
- 9.Balkwill F. Nat Rev Cancer. 2004;4(7):540. doi: 10.1038/nrc1388. [DOI] [PubMed] [Google Scholar]
- 10.Luker KE, Luker GD. Cancer Letters. 2006;238(1):30. doi: 10.1016/j.canlet.2005.06.021. [DOI] [PubMed] [Google Scholar]
- 11.Zlotnik A. Contrib Microbiol. 2006;13:191. doi: 10.1159/000092973. [DOI] [PubMed] [Google Scholar]
- 12.Burger JA, Kipps TJ. Blood. 2006;107(5):1761. doi: 10.1182/blood-2005-08-3182. [DOI] [PubMed] [Google Scholar]
- 13.Koizumi K, Hojo S, Akashi T, et al. Cancer Science. 2007;98(11):1652. doi: 10.1111/j.1349-7006.2007.00606.x. [DOI] [PMC free article] [PubMed] [Google Scholar]
- 14.Lazarini F, Tham TN, Casanova P, et al. GLIA. 2003;42(2):139. doi: 10.1002/glia.10139. [DOI] [PubMed] [Google Scholar]
- 15.Stumm R, Hollt V. Journal of Molecular Endocrinology. 2007;38(3):377. doi: 10.1677/JME-06-0032. [DOI] [PubMed] [Google Scholar]
- 16.Weidt C, Niggemann B, Kasenda B, et al. Current Stem Cell Research & Therapy. 2007;2(1):89. doi: 10.2174/157488807779317008. [DOI] [PubMed] [Google Scholar]
- 17.Jiang YP, Wu XH, Xing HY, et al. Chinese Medical Journal. 2007;120(14):1251. [PubMed] [Google Scholar]
- 18.Scotton CJ, Wilson JL, Scott K, et al. Cancer Research. 2002;62(20):5930. [PubMed] [Google Scholar]
- 19.Kajiyama H, Shibata K, Terauchi M, et al. International Journal of Cancer. 2008;122(1):91. doi: 10.1002/ijc.23083. [DOI] [PubMed] [Google Scholar]
- 20.De Clercq E. Nature Reviews Drug Discovery. 2003;2(7):581. doi: 10.1038/nrd1134. [DOI] [PubMed] [Google Scholar]
- 21.Moser TL, Pizzo SV, Bafetti LM, et al. Int J Cancer. 1996;67(5):695. doi: 10.1002/(SICI)1097-0215(19960904)67:5<695::AID-IJC18>3.0.CO;2-4. [DOI] [PubMed] [Google Scholar]
- 22.Orimo A, Gupta PB, Sgroi DC, et al. Cell. 2005;121(3):335. doi: 10.1016/j.cell.2005.02.034. [DOI] [PubMed] [Google Scholar]
- 23.Livak KJ, Schmittgen TD. Methods. 2001;25(4):402. doi: 10.1006/meth.2001.1262. [DOI] [PubMed] [Google Scholar]
- 24.Meucci O, Fatatis A, Simen AA, et al. Proceedings of the National Academy of Sciences of the United States of America. 1998;95(24):14500. doi: 10.1073/pnas.95.24.14500. [DOI] [PMC free article] [PubMed] [Google Scholar]
- 25.Ellerbroek SM, Wu YI, Overall CM, et al. J Biol Chem. 2001;276(27):24833. doi: 10.1074/jbc.M005631200. [DOI] [PubMed] [Google Scholar]
- 26.Ellerbroek SM, Fishman DA, Kearns AS, et al. Cancer Res. 1999;59(7):1635. [PubMed] [Google Scholar]
- 27.McQuibban GA, Butler GS, Gong JH, et al. Journal of Biological Chemistry. 2001;276(47):43503. doi: 10.1074/jbc.M107736200. [DOI] [PubMed] [Google Scholar]
- 28.Barbolina MV, Adley BP, Kelly DL, et al. International Journal of Cancer. 2009;125(4):816. doi: 10.1002/ijc.24347. [DOI] [PMC free article] [PubMed] [Google Scholar]
- 29.Helbig G, Christopherson KW, 2nd, Bhat-Nakshatri P, et al. Journal of Biological Chemistry. 2003;278(24):21631. doi: 10.1074/jbc.M300609200. [DOI] [PubMed] [Google Scholar]
- 30.Huang YC, Hsiao YC, Chen YJ, et al. Biochemical Pharmacology. 2007;74(12):1702. doi: 10.1016/j.bcp.2007.08.025. [DOI] [PubMed] [Google Scholar]
- 31.Kukreja P, Abdel-Mageed AB, Mondal D, et al. Cancer Research. 2005;65(21):9891. doi: 10.1158/0008-5472.CAN-05-1293. [DOI] [PubMed] [Google Scholar]
- 32.Chen FE, Ghosh G. Oncogene. 1999;18(49):6845. doi: 10.1038/sj.onc.1203224. [DOI] [PubMed] [Google Scholar]
- 33.Takada Y, Puzon W. J Biol Chem. 1993;268(23):17597. [PubMed] [Google Scholar]
- 34.Begley L, Monteleon C, Shah RB, et al. Aging Cell. 2005;4(6):291. doi: 10.1111/j.1474-9726.2005.00173.x. [DOI] [PubMed] [Google Scholar]
- 35.Gear AR, Camerini D. Microcirculation. 2003;10(3–4):335. doi: 10.1038/sj.mn.7800198. [DOI] [PubMed] [Google Scholar]
- 36.Scotton C, Milliken D, Wilson J, et al. Br J Cancer. 2001;85(6):891. doi: 10.1054/bjoc.2001.2020. [DOI] [PMC free article] [PubMed] [Google Scholar]
- 37.Jiang YP, Wu XH, Shi B, et al. Gynecol Oncol. 2006;103(1):226. doi: 10.1016/j.ygyno.2006.02.036. [DOI] [PubMed] [Google Scholar]
- 38.Ellerbroek SM, Wu YI, Stack MS. Arch Biochem Biophys. 2001;390(1):51. doi: 10.1006/abbi.2001.2345. [DOI] [PubMed] [Google Scholar]
- 39.Kodama Hasengaowa J, Kusumoto T, et al. Annals of Oncology. 2007;1870(1) doi: 10.1093/annonc/mdl342. [DOI] [PubMed] [Google Scholar]; Liotta LA. Nature. 2001;410(6824):24. doi: 10.1038/35065180. [DOI] [PubMed] [Google Scholar]
- 40.Muller A, Homey B, Soto H, et al. Nature. 2001;410(6824):50. doi: 10.1038/35065016. [DOI] [PubMed] [Google Scholar]
- 41.Yasumoto K, Koizumi K, Kawashima A, et al. Cancer Research. 2006;66(4):2181. doi: 10.1158/0008-5472.CAN-05-3393. [DOI] [PubMed] [Google Scholar]
- 42.Furuya M, Suyama T, Usui H, et al. Human Pathology. 2007;38(11):1676. doi: 10.1016/j.humpath.2007.03.023. [DOI] [PubMed] [Google Scholar]
- 43.Oda Y, Ohishi Y, Basaki Y, et al. Cancer Science. 2007;98(7):1020. doi: 10.1111/j.1349-7006.2007.00492.x. [DOI] [PMC free article] [PubMed] [Google Scholar]
- 44.Bartolome RA, Ferreiro S, Miquilena-Colina ME, et al. American Journal of Pathology. 2009;174(2):602. doi: 10.2353/ajpath.2009.080636. [DOI] [PMC free article] [PubMed] [Google Scholar]
- 45.Bartolome RA, Galvez BG, Longo N, et al. Cancer Research. 2004;64(7):2534. doi: 10.1158/0008-5472.can-03-3398. [DOI] [PubMed] [Google Scholar]
- 46.Majka M, Ratajczak J, Kowalska MA, et al. Eur J Haematol. 2000;64(3):164. doi: 10.1034/j.1600-0609.2000.90112.x. [DOI] [PubMed] [Google Scholar]
- 47.Sroka IC, Nagle RB, Bowden GT. Neoplasia. 2007;9(5):406. doi: 10.1593/neo.07193. [DOI] [PMC free article] [PubMed] [Google Scholar]
- 48.Zhang D, Brodt P. Oncogene. 2003;22(7):974. doi: 10.1038/sj.onc.1206197. [DOI] [PubMed] [Google Scholar]
- 49.Zhang Z, Song T, Jin Y, et al. Int J Gynecol Cancer. 2009;19(6):998. doi: 10.1111/IGC.0b013e3181a83749. [DOI] [PubMed] [Google Scholar]
- 50.Pelletier S, Duhamel F, Coulombe P, et al. Molecular and cellular biology. 2003;23(4):1316. doi: 10.1128/MCB.23.4.1316-1333.2003. [DOI] [PMC free article] [PubMed] [Google Scholar]
- 51.Ridley AJ, Allen WE, Peppelenbosch M, et al. Biochemical Society symposium. 1999;65:111. [PubMed] [Google Scholar]