

Abstract
We have developed a multimodal imaging technique by integrating photoacoustic microscopy and spectral-domain optical coherence tomography to provide simultaneous volumetric microscopic imaging of both optical absorption and scattering contrasts in biological tissues. In the integrated system, the two imaging modalities share the same optical scanning and delivery mechanisms after their probing and illumination light beams are combined. By further synchronizing the image acquisitions, the images from the two modalities are intrinsically registered. The capabilities of this novel technique were demonstrated by imaging both the microanatomy and microvasculature in mouse ears in vivo.
Multimodal imaging takes advantages of combining different contrast mechanisms to provide comprehensive anatomical and functional information of biological tissues. A system that combines photoacoustic microscopy (PAM) [1–3] and optical coherence tomography (OCT) [4,5] can provide complementary contrasts for imaging biological tissues [6].
PAM is an optical-absorption-based microscopic imaging modality that detects laser-induced photoacoustic (PA) waves as a result of specific optical absorption. In the existing PAM [1–3], 3D images of tissues are acquired by the combination of time-resolved recording of the induced PA wave with a 2D scanning of the assembly of optical illumination and ultrasonic detection. As optical absorption is strongly associated with various physiological parameters (most notably, the hemoglobin oxygen saturation), PAM has drawn great interest from various biomedical research fields.
OCT is a low-coherence interferometer-based imaging modality that detects the interference in the interferometer in either the time domain or the spectral domain between the backreflected light from the sample and the reference arm. Various optical properties of biological tissues can provide contrasts for OCT, while the light scattering property predominates. Although optical Doppler tomography, a branch of OCT, can provide functional information of blood flow by measuring the Doppler shift impinging on the backscattered sample light, imaging hemoglobin oxygen saturation (sO2) is still beyond the reach of conventional OCT.
As a result, combining OCT with PAM can potentially provide comprehensive information of biological tissues, including the tissue anatomy, blood flow, and sO2 from a single instrument. However, the integration of PAM with OCT for simultaneous multimodal imaging has been hampered by the incompatible scanning mechanisms of PAM and OCT: the existing PAM systems require the 2D mechanical translation of the ultrasonic–optical assembly simultaneously, while OCT uses a 2D galvanometer to scan its probing light. To solve this incompatibility issue and to improve the achievable imaging speed, we developed laser scanning optical-resolution PAM [7], in which the ultrasonic transducer is kept stationary during data acquisition and only the laser light is scanned by an x–y galvanometer scanner. Laser scanning optical-resolution PAM makes the true integration of PAM with OCT possible.
In this Letter, we report our latest progress on integrating PAM with OCT to provide simultaneous in vivo multimodal imaging of biological tissues.
Figure 1 shows a schematic of the experimental system. The configuration of the PAM subsystem was reported in detail in [7]. Briefly, a tunable dye laser (Cobra, Sirah Laser and Plasmatchnik GmbH) pumped by a Nd:YLF laser system (IS8II-E, Edge-Wave GmbH, pulse duration 6 ns) was used as the irradiation source. The laser system worked in an external triggering mode with the following operating parameters: pulse repetition rate 1024 Hz, wavelength 580 nm, pulse energy 0.04 μJ. The output laser light from the dye laser was spatially filtered by an iris, expanded to reach a beam diameter of 8 mm, and then merged with the OCT probing light by a dichroic mirror (NT43-955, Edmund Optics). The combined light beams were scanned by an x–y galvanometer (QS-10, Nutfield Technology) and were focused on the sample by an achromatic lens (AC254-060-A1, Thorlabs).
Fig. 1.

(Color online) Schematic of the integrated PAM and OCT experimental system. SLD, superluminescent diode; PC, polarization controller; PD, photodiode; FOV, field of view; UT, ultrasonic transducer.
The induced PA waves were detected by an unfocused ultrasonic transducer (V313, Olympus NDT, 15 MHz, bandwidth 80%, active element diameter 6 mm). The detected PA signals were digitized and streamed to the computer by a data acquisition board (CS12400, Gage Applied) at a sampling rate of 200 mega samples/s. The energy of each laser pulse was also recorded by a photodiode to compensate for the pulse energy instability. The lateral and axial resolutions of the PAM subsystem are 7.8 and 50 μm, respectively [7].
The fiber-based spectral-domain OCT subsystem is similar to that reported in our previous publications [8]. The spectral-domain OCT consists of a broadband light source (SLD-371, Superlum Diodes, center wavelength 840 nm, FWHM bandwidth 50 nm), a 3 dB fiber coupler, a reference arm, a sample arm coupled with the PAM, and a spectrometer for detecting the interference signals in the spectral domain. The exposure time of the line-scan CCD camera (Aviiva, e2V, Chelmsford) in the spectrometer was 36 μs, which can acquire OCT images with a line rate of 24 kHz. The measured sensitivity was better than 95 dB. The calibrated depth resolution is 6 μm in tissue, and the lateral resolution is estimated to be 20 μm.
To ensure automatic registration of the two imaging modalities under all circumstances, the timing of the PAM laser triggering and data acquisition, the scanning of the galvanometer scanner, and the OCT data acquisition need to be controlled on the same time base. As shown in Fig. 1, we employed an analog-output board (PD2-AO-16, United Electronic Industries) to trigger the image acquisition board for the CCD camera, the PAM laser, and the galvanometer. The PAM data acquisition was triggered by the photodiode to avoid laser jittering. As a result, the two subsystems are synchronized despite the difference in their achievable imaging speed. The lateral alignment of the OCT and PAM light foci was verified by imaging a printed grid as in [7].
We applied the system to image the ears of a Swiss Webster mouse (body weight 20 g, Charles River Labs) in vivo. After the hairs on one of the ears were gently removed with commercial nonirritating hair-removing lotion (Surgi Cream, Ardell), the animal was placed on a homemade animal holder for imaging. During experiments, a mixture of 1% isoflurane with medical grade oxygen was ventilated to the animal through a commercial nonrebreathing anesthesia system (M3000, LEI Medical) at a flow rate of 1 l/min to keep the animal motionless. All experimental animal procedures conformed to the laboratory animal protocol approved by the Animal Care and Use Committee of the University of Wisconsin–Milwaukee.
The in vivo images are shown in Fig. 2. Figure 2(a) shows one typical cross-sectional OCT image consisting of 400 × 220 (depth × lateral) pixels at the location marked in Fig. 2(b). The image clearly depicts the microscopic structures of the mouse ear. Different anatomical layers, including epidermis, dermis, and the cartilaginous backbone, can be clearly seen [9,10]. There are also shadows on the images cast by either blood vessels or clusters of scatterers, presumably from various glands that blocked the light from probing tissues below them. Unlike OCT images of the retina, where shadows cast by blood vessels can be clearly recognized [8], we cannot tell the exact locations of the blood vessels.
Fig. 2.
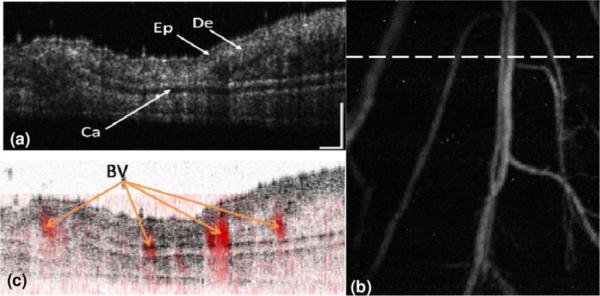
(Color online) Simultaneously acquired OCT and PAM images of a mouse ear. (a) OCT B-scan at the location marked in panel (b) by the dashed line (displayed dynamic range, 45 dB); (b) PAM image (average contrast-to-noise ratio 32 dB); (c) fused OCT and PAM B-scan images at the same location. Ep, epidermis; De, dermis; Ca, cartilaginous backbone; BV, blood vessels; bar, 200 μm.
Figure 2(b) shows the maximum-amplitude projection (MAP) of the simultaneously acquired PAM image in the same area in the mouse ear. Since the PAM image visualizes the distribution of optical energy deposition, only the blood vessels appear clearly in the image, whereas no information about skin anatomy can be observed. Figures 2(a) and 2(b) demonstrate the complementary nature of the contrasts contributing to OCT and PAM.
When PAM and OCT images are fused, both the skin anatomy and microvasculature can be visualized in a single volumetric image. Figure 2(c) shows the fused B-scan image at the location marked in Fig. 2(b). The registration of the two images along the lateral directions was automatic and was guaranteed by the system design. To register the two B-scan images along the axial direction, we first determined the depth relationship (pixel shift) between the two modalities by imaging the top surface of a printed mesh grid [7]. Then the PAM volumetric image was shifted accordingly along the axial direction to register with the OCT volumetric image. The OCT color map in Fig. 2(c) was inverted to highlight the blood vessels, and the blood vessels are pseudocolored red.
The volume rendering of the OCT image and the final fused image are shown in Fig. 3. Figure 3(a) shows the volume rendering of the OCT data by using commercial software (Volview, Kitware), where we cannot distinguish blood vessels except the shadows created by them. Figure 3(b) shows the volume rendering of the fused OCT and PAM data, where the vessels imaged by PAM agree with the shadows in the OCT image very well. The fused image shows clearly the spatial distributions of the tissue properties of scattering and absorption at wavelengths of the OCT and PAM, respectively, which are not available in either of the modalities alone. In addition to the image shown here, the integrated system has the potential to image the blood velocity by using optical Doppler tomography and sO2 by using multiple-wavelength PAM imaging [2].
Fig. 3.
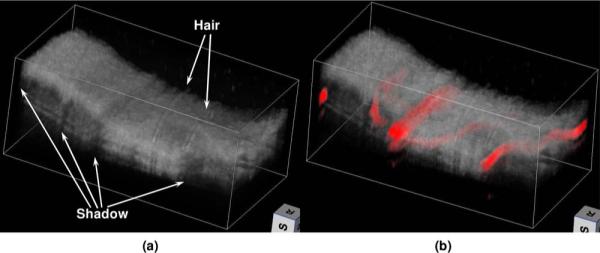
(Color online) Volume renderings of (a) the OCT data and (b) the final fused image. In the fused image, the blood vessels are pseudocolored red, and the opacity of the OCT voxels is set to 0.8.
The experimental results demonstrated the feasibility of integrating OCT and PAM in the most suitable configuration for high-speed simultaneous multimodal imaging. The imaging speed of the integrated system (60 s per volume acquisition) is determined by the PAM subsystem, which is currently limited by the pulse repetition rate of the tunable laser. By using a laser with a pulse repetition rate of 24 kHz, the PAM can match the maximal imaging speed of the current OCT subsystem.
The contrast-to-noise ratio in the current PAM configuration is lower than that of existing optical-resolution PAM because of the unfocused transducer used and the longer distance from the sample to the transducer [3]. This longer distance is necessary for potential applications in ophthalmic imaging, the most popular application for OCT. However, the contrast-to-noise ratio can be improved by optimizing the ultrasonic transducer.
In summary, we have developed a multimodal imaging technique by integrating PAM and spectral-domain OCT seamlessly. The technique provides 3D microscopic imaging of biological tissues with complementary contrast mechanisms (optical absorption and scattering) simultaneously, and the two modalities are intrinsically registered. Although the full potential of this technology has yet to be explored, the multimodal nature has been clearly demonstrated by in vivo imaging in small animals.
Acknowledgments
This work was supported in part by National Institutes of Health (NIH) grant 7R21EB008800-02 to S. Jiao, the University of Wisconsin–Milwaukee start-up fund, and a by grant from The Lynde and Harry Bradley Foundation to H. F. Zhang.
References
- 1.Zhang HF, Maslov K, Wang LV. Nat. Protoc. 2007;4:797. doi: 10.1038/nprot.2007.108. [DOI] [PubMed] [Google Scholar]
- 2.Zhang HF, Maslov K, Stoica G, Wang LV. Nat. Biotechnol. 2006;24:848. doi: 10.1038/nbt1220. [DOI] [PubMed] [Google Scholar]
- 3.Maslov K, Zhang HF, Hu S, Wang LV. Opt. Lett. 2008;33:929. doi: 10.1364/ol.33.000929. [DOI] [PubMed] [Google Scholar]
- 4.Huang D, Swanson EA, Lin CP, Schuman JS, Stinson WG, Chang W, Hee MR, Flotte T, Gregory K, Puliafito CA, Fujimoto JG. Science. 1991;254:1178. doi: 10.1126/science.1957169. [DOI] [PMC free article] [PubMed] [Google Scholar]
- 5.Wojtkowski M, Srinivasan V, Ko T, Fujimoto J, Kowalczyk A, Duker J. Opt. Express. 2004;12:2404. doi: 10.1364/opex.12.002404. [DOI] [PubMed] [Google Scholar]
- 6.Li L, Maslov KI, Ku G, Wang LV. Proc. SPIE. 2009;7177:71770I. [Google Scholar]
- 7.Xie Z, Jiao S, Zhang HF, Puliafito CA. Opt. Lett. 2009;28:3205. doi: 10.1364/ol.34.001771. [DOI] [PubMed] [Google Scholar]
- 8.Jiao S, Knighton R, Huang X, Gregori G, Puliafito C. Opt. Express. 2005;13:444. doi: 10.1364/opex.13.000444. [DOI] [PubMed] [Google Scholar]
- 9.Barker JH, Hammersen F, Bondàr I, Uhl E, Galla TJ, Menger MD, Messmer K. Plast. Reconstr. Surg. 1989;83:948. doi: 10.1097/00006534-198906000-00003. [DOI] [PubMed] [Google Scholar]
- 10.So PTC, Kim H, Kochevar IE. Opt. Express. 1998;3:340. doi: 10.1364/oe.3.000339. [DOI] [PubMed] [Google Scholar]