

Abstract
Background & Aims
The generation of oxidative stress and TGF-β1 production play important roles in liver fibrogenesis. We have previously shown that HCV increases hepatocyte TGF-β1 expression. However, the mechanisms by which this induction occurs have not been well studied. We explored the possibility that HCV infection regulates TGF-β1 expression through generation of reactive oxygen species (ROS), which act through one or more of the p38 MAPK, ERK, JNK, and NFκB signaling pathways to induce TGF-β1 expression.
Methods and Results
In this study, we demonstrated using the infectious JFH1 model that HCV induces ROS and TGF-β1 expression. We further found that JFH1 activates the phosphorylation of p38 MAPK, JNK, ERK, and NFκB. Through use of small molecule inhibitors and siRNAs to knock down these pathways, we found that HCV-mediated TGF-β1 enhancement occurs through a ROS-induced and p38 MAPK, JNK, ERK1/2, NFκB-dependent pathway.
Conclusions
These findings provide further evidence to support the hypothesis that HCV enhances hepatic fibrosis progression through the generation of ROS and induction of TGF-β1. Strategies to limit the viral induction of oxidative stress appear to be warranted to inhibit fibrogenesis.
Keywords: HCV, ROS, NFκB, TGF-β1
Introduction
HCV infects about 170 million people and is a leading cause of chronic liver disease worldwide1,2. It is a major cause of cirrhosis, a significant cause of hepatocellular carcinoma (HCC), and is the leading reason for liver transplantation worldwide. Transforming growth factor beta β1 (TGF-β1) is a regulatory cytokine with multifunctional effects on cell biological processes, including liver fibrogenesis. TGF-β1 is the most potent profibrogenic cytokine, accelerating liver fibrosis by triggering the proliferation and transformation of hepatic stellate cells (HSCs) in HCV-infected persons. It has been reported that HCV infection is associated with a significant increase in transforming growth factor beta β1 (TGF-β1) expression in both serum and liver3. Adenovirus encoded HCV core and NS3-NS5 protein expression has been shown to increase the secretion of TGF-β1 production4. HCV infection has also been demonstrated to increase hepatocyte TGF-β1 expression in cell culture models, including HCV replicon cells and JFH1 cells5,6. However, the mechanisms by which HCV increases TGF-β1 expression have not been well studied. HCV core and HCV subgenomic replicons have each been shown to increase reactive oxygen species (ROS) production in HCV expression and replicon models4,7-10. ROS may in turn induce hepatic stellate cell proliferation and TGF-β1 expression. ROS have also been shown to mediate TGF-β1 induced cellular responses11, thereby likely playing an important role in the development of liver fibrosis associated with HCV infection12. HCV core, E2, and HCV subgenomic replicons, have been demonstrated to increase phosphorylation of p38 mitogen activated protein kinase (p38 MAPK), extracellular signal regulated kinase (ERK), and activates nuclear factor κB (NFκB)13,14. However, most of this understanding was acquired using the HCV replicon system or HCV protein expression model15. It is still unclear how HCV infection effects ROS production and NFκB activation in cells that produce infectious HCV particles. Moreover, the mechanism by which HCV infection impacts ROS production, and subsequently TGF-β1 expression, is still not characterized. We hypothesized that HCV increases TGF-β1 expression through induction of ROS, and activation of the p38 MAPK, c-Jun N-terminal kinase (JNK), ERK, and NFκB pathway. We tested this hypothesis using the infectious JFH1 culture model16.
Methods
Cell cultures
Huh7.5.1 cells (human hepatocellular carcinoma)17 and HCV JFH1-infected Huh7.5.1 cells16 were grown in Dulbecco’s Modified Eagle’s Medium (DMEM) supplemented with 10% fetal bovine serum (FBS) medium. The JFH1-infected cells used in this study were analyzed between day 6 and 20 post-infection.
ROS measurements and cell viability assay
ROS levels were measured as previously described7,8,18. Briefly, Huh7.5.1 cells or JFH1 cells were seeded in 100 μl of 10% FBS DMEM in 96-well clear bottom white assay plate (Corning Incorporated, Corning, NY) (10,000 cell/well) overnight (14 hrs). The cells were washed with PBS and then incubated with 10 μM carboxy derivative of fluorescein (carboxy-H2DCFDA) (Invitrogen, Carlsbad, CA) in warm PBS for 1 hour according to the manufacturer’s protocol. The treated cells were washed with PBS, and then resuspended in 10% FBS. ROS were assessed by measured fluorescence with a BioTek Synergy 2 Microplate Reader (Winooski, VT) at an excitation of 485 nm and an emission of 528 nm. Cell viability was monitored by using Cell Titer-Glo Luminescent Cell Viability Assay (Promega, Madison, WI). ROS level was normalized by cell viability to calculate the ROS/Cell Viability Arbitrary Unit. ROS green fluorescent images were visualized using an Olympus fluorescent microscope (Olympus America Inc., Center Valley, PA) (excitation 488 nm; emission 505–530 nm), and the images were taken using Intelligent Imaging Innovation Slide Book (Intelligent Imaging Innovations, Inc., Philadelphia, PA) software.
Immunofluorescence analysis
To monitor the cell infectivity in the JFH1-infected cell population, we performed HCV core immunofluorescence staining in uninfected and JFH1 infected Huh7.5.1 cells (day 6 infection). Huh7.5.1 or JFH1 cells were fixed with 4% paraformaldehyde, permeabilized using 0.5% TritonX-100, and blocked with 3% BSA in PBS. The primary antibody was mouse anti-HCV core (ViroGen Co., Watertown, MA). The secondary antibody was goat anti-mouse-Alexa Fluor 488 (Invitrogen, Carlsbad, CA). TO-PRO-3 iodide (642/661) (Invitrogen, Carlsbad, CA) was added to the staining to monitor nuclear morphology. Immunofluorescence was observed using Nikon Eclipse 800 microscopy with the Bio-Rad Radiance 2000 confocal fluorescence microscope system (Bio-Rad Laboratories, Hercules, CA).
Reagents
To explore the possible pathways of HCV replication on ROS and TGF-β1 upregulation, Huh7.5.1 cells or JFH1cells were incubated with several pathway inhibitors including diphenyliodonium (DPI) (ROS inhibitor), SB 203580 (SB) (p38 MAP kinase inhibitor), SP600125 (SP) (JNK inhibitor), U0126 (ERK1/2 inhibitor), LY 294002 (LY) (PI3K inhibitor), or AQ, 6-amino-4-(4-phenoxyphenylethylamino) quinazoline (NFκB activation inhibitor). The inhibitors were purchased from EMD Chemicals, Inc., Gibbstown, NJ. The inhibitor stock solution was dissolved in 1% dimethyl sulfoxide (DMSO). The cells were incubated with different inhibitors at a final concentration of 20 μM for 14 hrs. 1% DMSO was used as a negative control.
Real time PCR
Total cellular RNA was harvested using the QIA shredder kit and RNeasy kit (Qiagen, Valencia, CA) according to the manufacturer’s protocol. Total cDNA was synthesized by reverse transcription using the GeneAmp RNA PCR Kit (Applied Biosystems, Branchburg, New Jersey). TGF-β1 and GAPDH mRNA levels were quantified by real time PCR. Human TGF-β1 (GeneBank#: NM_000660) was measured using the following primers: sense primer - GGC CAG ATC CTG TCC AAG C; antisense primer - GTG GGT TTC CAC CAT TAG CAC). Human glyceraldehyde-3-phosphate dehydrogenase (GAPDH) (GeneBank# BC026907; GAPDH sense primer: ACA GTC CAT GCC ATC ACT GCC; GAPDH antisense primer, GCC TGC TTC ACC ACC TTC TTG) was used as a control for basal RNA levels. TGF-β1 and GAPDH levels were quantified by real time PCR using the Bio-Rad IQ5 (Bio-Rad Laboratories, Hercules, CA) and Finnzymes SYBR green I dye (New England Biolabs, Ipswich, MA) for detection as previously described19.
TGF-β1 ELISA
TGF-β1 cytokine levels in supernatants were measured using the Quantikine Human TGF-β1 ELISA Kit (R&D Systems, Minneapolis, MN).
Protein sample preparation
At the time of harvest, cells were washed with phosphate buffered saline (PBS), and whole cell protein samples were extracted with radioimmunoprecipitation assay buffer (0.5% Nonidet p-40, 10 mM Tris, pH 7.4, 150 mM NaCl, 1% SDS) with a protease inhibitor cocktail (Sigma Life Science and Biochemicals, St. Louis, MO). Whole protein lysates were sonicated, boiled at 95° C for 5 min, and chilled on ice for 5 minutes before Western blot assay.
Western blot
Western blot was performed as previously reported19,20. Protein (20 μg/well) was separated by SDS-PAGE with precast NuPAGE Novex 4-12% Bis-Tris gradient gels (Invitrogen, Carlsbad, CA) and transferred to PVDF membranes. The primary antibodies used for the Western blots included phosphorylated and unphosphorylated p38 MAPK, JNK, ERK1/2, PI3K, and NFκB (p65) (Cell Signaling Technology, Inc., Danvers, MA); mouse anti-HCV NS5A (ViroGen Co., Watertown, MA); mouse anti-HCV core (Affinity BioReagents Inc., Golden, CO), and mouse anti-actin (Sigma Life Science and Biochemicals, St. Louis, MO). The secondary antibodies included HRP-conjugated ECL donkey anti-rabbit IgG, or HRP-conjugated ECL sheep anti-mouse IgG (Amersham Biosciences, Piscataway, NJ). The ECL Western Blotting Detection Kit (Amersham Biosciences, Piscataway, NJ) was used to detect Chemiluminescent signals.
Luciferase reporter assay
To assess the effect of JFH1 HCV infection on NFκB signaling, Huh7.5.1 cells or JFH1 infected Huh7.5.1 cells were co-transfected with an NFκB promoter construct expressing firefly (pNFκB-Luc) (Stratagene, La Jolla, CA) and construct pRL-TK expressing Renilla luciferase. FuGene HD Transfection Reagent (Roche Diagnostics, Indianapolis, IN) was used for plasmid transfection. Dual-luciferase assay (Promega, Madison, WI) was assessed for luciferase activity. Relative luciferase activity (RLA) was normalized by dividing the firefly luciferase value by the Renilla luciferase value.
siRNA and transfection
To further determine the specific molecular pathways of HCV replication on ROS production and TGF-β1 expression, we performed RNAi to knock down several pathway genes expression. The siRNAs were transfected into cells using HiPer-Fect Transfection Reagent (Qiagen, Valencia, CA). The siRNAs used for gene knock-down were as follows: SignalSilence p38 MAPK siRNA, SignalSilence p44/42 ERK siRNA, SignalSilence NFκB p65 siRNA (Cell Signaling Technology, Inc., Danvers, MA), On-Target SMARTpool JNK1 siRNA, On-Target SMARTpool PI3K siRNA (Dharmacon, Inc., Lafayette, CO). Qiagen AllStars Neg siRNA (Qiagen, Valencia, CA) was used as a negative control for siRNA transfection. The protein expression of each knock down gene was confirmed by Western blot.
Statistics
Data analysis was carried out using a 2-tailed Student’s t-test with pooled variance. Data are expressed as mean ± SD of at least four sample replicates, unless stated otherwise. In the Figures, * denoted P < 0.05, denoted ** P <0.01, and # denoted P <0.001.
Results
HCV increases TGF-β1 mRNA and ROS production in JFH1 cells
We first examined whether HCV infection has an effect on ROS production in JFH1 cells. We found a greater than 2-fold increase of ROS production in JFH1 cells compared to Huh7.5.1 cells (Figure 1A) (p=0.001). To visualize ROS activity in Huh7.5.1 cells and JFH1 cells, fluorescent images of the cells were obtained. We confirmed that live cells infected with JFH1 HCV contained higher levels of ROS than uninfected Huh7.5.1 cells (Figure 1B). We found that HCV infection enhances TGF-β1 expression in a previous report5. In this study, we confirmed again that HCV increases TGF-β1 expression by over 3-fold in JFH1 cells compared to Huh7.5.1 cells (Figure 1C) (p=0.007). Western blot for HCV NS5A and HCV core confirmed expression of viral proteins in JFH1 cells (Figure 1D). Using fluorescent microscopy, we found that there at least 95% of the cells were infected with JFH1 (Figure S1).
Figure 1. HCV increases TGF-β1 mRNA and ROS production in JFH1-infected Huh7.5.1 cells.

Figure 1A. JFH1 HCV induces ROS production. ROS level was normalized by cell viability to calculate the ROS/Cell Viability Arbitrary Unit. Empty bar: Huh7.5.1 cell, Gray bar: JFH1 cell. (n=4, P=0.001)
Figure 1B. JFH1 increased ROS fluorescence. ROS fluorescent images in Huh7.5.1 and JFH1 live cells.
Figure 1C. JFH1 HCV increases TGF-β1 expression. TGF-β1 level was normalized to GAPDH level to calculate the TGF-β1/GAPDH arbitrary unit. Empty bar: huh7.5.1 cell, Gray bar: JFH1 cell. (n=4, P=0.007).
Figure 1D. Western blot for HCV NS5A and HCV core. HCV NS5A, HCV core, and actin proteins levels were detected by Western blots. Lane #1: Huh7.5.1 cells; Lane#2: JFH1 cells.
HCV upregulation of TGF-β1 expression is ROS-dependent
To determine whether HCV induction of TGF-β1 expression is linked to ROS, we used a DPI, a blocker of ROS formation. We found that DPI completely blocked not only HCV induced ROS production but also abrogated TGF-β1 enhancement (Figure 2A, 2B).
Figure 2. The ROS inhibitor DPI blocks HCV upregulation of TGF-β1.

The inhibitors used including DPI, SB, SP, U0126, or LY. 1% DMSO was used as a negative control.
Figure 2A. DPI blocked JFH1 HCV mediated ROS generation. ROS level was normalized by cell viability to calculate the ROS/Cell Viability Arbitrary Unit. DPI completely blocked the HCV induced ROS production when compared to JFH1 in DMSO (P<0.001, n=4).
Figure 2B. DPI inhibited JFH1 HCV mediated TGF-β1 expression. TGF-β1 level was normalized to GAPDH level to calculate the TGF-β1/GAPDH arbitrary unit. DPI completely blocked the HCV stimulated TGF-β1 expression (P=0.002). SB, SP, or U0126 partially reduced TGF-β1 production by 29.5% (P=0.08), 32.2% (P=0.07), and 27.5% (P=0.1), respectively compare to JFH1 in DMSO (n=4). In contrast, LY had no effect on TGF-β1 expression.
Figure 2C. The ROS inhibitor DPI blocked phosphorylation of p38 MAPK, JNK, ERK. JFH1 HCV activated the phosphorylation of p38 MAPK, p42 ERK, and JNK (lane #2). ROS inhibitor DPI blocks phosphorylation of p38 MAPK, JNK, ERK to levels comparable to those seen with their specific inhibitors (Lane #3). Antibody to PI3K was directed against unphosphorylated protein. We found that HCV does not activate PI3K phosphorylation (data not shown). Lane#1: Huh7.5.1+DMSO; Lane#2 JFH1+DMSO; Lane#3 JFH1+DPI; Lane#4 JFH1+SB; #5 JFH1+SP; #6 JFH1+U0126; #7 JFH1+LY.
HCV-induced oxidative stress regulates TGF-β1 expression through p38 MAPK, JNK, and ERK
We then asked how ROS regulates TGF-β1 expression. Because ROS are possible upstream signaling molecules to the cellular kinases p38 MAPK, JNK, and ERK, we examined the interactions of ROS generation with these proteins in JFH1 cells. We monitored ROS production and TGF-β1 expression in Huh7.5.1 cells or JFH1 cells treated with several different pathway inhibitors. The p38 MAPK inhibitor SB, JNK inhibitor SP, or ERK inhibitor U0126 had no effect on HCV-induced ROS production (Figure 2A), but they partially blocked TGF-β1 expression in JFH1 cells (Figure 2B). In contrast, the PI3K inhibitor LY had no effect on HCV-mediated enhancement of TGF-β1 or ROS production (Figure 2A-B). Western blotting revealed that JFH1 induces the phosphorylation of p38 MAPK, JNK1/2, and p44/42 ERK (Figure 2C). Furthermore, the ROS inhibitor DPI blocked phosphorylation of p38 MAPK, JNK, ERK to levels comparable to those seen with their specific inhibitors (Figure 2C). These data therefore suggest that p38 MAPK, JNK, and ERK lie downstream of ROS. These results also indicate that HCV stimulates ROS generation, which in turn induce phosphorylation of p38 MAPK, JNK1/2, and p44/42 ERK. These intermediates ultimately contribute to the upregulation of TGF-β1 expression.
HCV-induced TGFβ1 expression is partially blocked by siRNA of p38 MAPK, JNK, or ERK
To further test the specific effects of HCV replication on ROS production and TGF-β1 expression pathways, we performed siRNA-mediated knockdowns of p38 MAPK, JNK, ERK, or PI3K. We then assessed ROS production and TGF-β1 expression in these cells. We found that siRNA knockdown of p38 MAPK, JNK, ERK, or PI3K had no effect on ROS production in JFH1 cells (Figure 3A). However, we found that TGF-β1 mRNA expression was partially reduced by p38 MAPK, JNK, or ERK siRNA knockdown (Figure 3B). In contrast, PI3K siRNA had no effect on TGF-β1 expression (Figure 3B). ELISA data demonstrated that the knockdown of p38 MAPK, JNK, or ERK significantly reduced TGF-β1 cytokine protein levels to 1105±88 pg/ml, 1102±95 pg/ml, and 1073±105 pg/ml, respectively, when compared to Neg siRNA in JFH1 cells (1571±111 pg/ml, Figure 3C). We confirmed successful knockdown of p38 MAPK, JNK, ERK, or PI3K via Western blotting (Figure 3D). These data further demonstrate that HCV activated ROS production and subsequently increased TGF-β1 mRNA and protein expression through the p38 MAPK, JNK, and ERK pathways.
Figure 3. Effects of siRNA to p38 MAPK, JNK, ERK, or PI3K on ROS production and TGF-β1 expression.

Figure 3A. siRNA to p38 MAPK, JNK, ERK, or PI3K do not effect JFH1 HCV stimulated ROS production. JFH1 cell increased ROS production by over two-fold compared to Huh7.5.1 cell. However, siRNA to p38 MAPK, JNK, ERK, PI3K had not effect on ROS production in JFH1 infected cells.
Figure 3B. siRNA to p38 MAPK, JNK, ERK, partially reduced JFH1 HCV activated TGF-β1 mRNA expression. HCV infection enhanced TGF-β1 expression by over 3 fold in JFH1 cells compared to Huh7.5.1 cells. The siRNA to p38 MAPK, JNK, or ERK partially inhibited TGFβ1 mRNA expression enhancement in JFH1 cells by 45.9% (P=0.035), 40.8% (P=0.070), and 41.4% (P=0.056), respectively, when compared to TGF-β1 mRNA in Neg siRNA in JFH1 (n=4). In contrast, PI3K or Neg siRNA had not effect on TGFβ1 expression in JFH1 cells.
Figure 3C. siRNA to p38 MAPK, JNK, ERK significantly inhibited JFH1 HCV-activated TGF-β1 cytokines. TGF-β1 levels in supernatants were measured according to Methods. siRNA to p38 MAPK, JNK, or ERK each significantly reduced TGF-β1 cytokine levels to 1105±88 pg/ml (P=0.015), 1102±95 pg/ml (P=0.016), and 1073±105 pg/ml (P=0.016), respectively, when compared to TGF-β1 levels in the presence of Neg siRNA in JFH1-infected cells (1571±111 pg/ml, n=4).
Figure 3D. siRNA to p38 MAPK, ERK, or JNK reduced HCV mediated NFκB phosphorylation. siRNA to p38 MAPK, JNK, ERK, or PI3K knocked down the correspondent protein expression. siRNA to p38 MAPK, JNK, ERK reduced HCV mediated NFκB activation. In contrast, PI3K siRNA has not effect on NFκB phosphorylation. Lane#1 Huh7.5.1, #2 JFH1 + Neg siRNA, #3JFH1+ p38 MAPK siRNA, #4 JFH1+ JNK siRNA, #5 JFH1+ ERK siRNA, #6 JFH1+ PI3K siRNA.
The combination of siRNA to p38MAPK and ERK cooperatively reduces TGF-β1 production
To assess the effect of both p38MAPK and ERK on TGF-β1 expression in JFH1 cells, we performed siRNA to knock down both p38MAPK and ERK. We found that the combination of siRNAs to p38MAPK and ERK additively reduced TGF-β1 mRNA expression (Figure 4A). TGF-β1 levels in supernatants were significantly lower in the combination siRNAs to p38MAPK and ERK (596±73 pg/ml) when compared to Neg siRNA in JFH1 cells (1571±111 pg/ml) (Figure 4B). Western blot confirmed the knockdown of p38MAPK and ERK proteins (Figure 4C). We also found a cooperative reduction of NFκB phosphorylation with the combination of siRNA to p38MAPK and ERK (Figure 4C).
Figure 4. The combination of siRNA to p38MAPK and ERK further reduced TGF-β1 production.

Figure 4A. The combination of siRNA to p38MAPK and siRNA to ERK cooperatively reduced TGF-β1 mRNA expression. TGF-β1 mRNA expression in JFH1-infected cells were partially inhibited by siRNAs to p38 MAPK (P=0.031) or ERK (P=0.046) compared to Neg siRNA. The combination of siRNA to p38MAPK and siRNA to ERK additively reduced TGF-β1 mRNA expression in JFH1 cell (P<0.001).
Figure 4B. The combination of siRNAs to p38MAPK and ERK significantly inhibited JFH1 HCV-activated TGF-β1 cytokines. TGF-β1 levels in supernatants were measured using the human TGF-β1 ELISA Kit. The combination of siRNAs to p38MAPK and ERK significantly inhibited TGF-β1 cytokine production (596±73 pg/ml, P<0.001) when compared for Neg siRNA in JFH1 cells (1571±111 pg/ml, n=4).
Figure 4C. The combination of siRNA to p38MAPK and siRNA to ERK further inhibited HCV-mediated NF-κB phosphorylation. Western blot confirmed that siRNA to p38 MAPK or ERK knocked down the corresponding protein expression. The combination of siRNA to p38 MAPK and ERK further reduced HCV-mediated NFκB activation. Lane#1 Huh7.5.1+ Neg siRNA, #2 JFH1 + Neg siRNA, #3 JFH1+ p38 MAPK siRNA, #4 JFH1+ ERK siRNA, #5 JFH1+ p38 MAPK siRNA+ ERK siRNA.
Inhibition of ROS blocks HCV-activated NF-κB signaling
To assess the possibility that HCV-mediated upregulation of TGF-β1 occurs through the NF-κB pathway, we monitored NF-κB promoter-driven luciferase activity in uninfected Huh7.5.1 or JFH1-infected cells treated with different pathway inhibitors. We found that JFH1 activated NFκB signaling (Figure 5A). The ROS inhibitor DPI completely abrogated NFκB signaling to a level comparable to that observed with the NFκB inhibitor AQ. We found that SB, SP, and U0126 also reduced NFκB signaling by 82.9%, 76.7%, and 52.1%, respectively. In contrast, LY did not affect NFκB signaling (Figure 5A). These data indicate that ROS induced NFκB signaling proceeds through p38 MAPK, JNK, and ERK. Western blotting demonstrated that JFH1 activated NFκB phosphorylation and that DPI inhibited JFH1-driven NFκB phosphorylation to a comparable degree as the NFκB inhibitor AQ. In parallel with the functional expression data, SB, SP, or U0126 also partially reduced JFH1-induced NF-κB phosphorylation. In contrast, LY had no effect on NF-κB phosphorylation (Figure 5B). It is possible that NFκB-luciferase reporter induction is more sensitive to DPI than is formation of phospho-NFκB, which correlates more strongly with TGF-β1 expression. In either event, the observation of a strong correlation between NFκB induction and TGF-β1 supports NFκB regulation of TGF-β1.
Figure 5. Effects of ROS inhibitor on NF-κB signaling pathway.

An NFκB promoter construct expressing firefly (pNFκB-Luc) and the control construct pRL-TK expressing Renilla luciferase were transfected into cells for 24 hours. The transfected Huh7.5.1 cells or JFH1 cells were incubated with 20 μM different inhibitors for 14 hours. The inhibitors used included DPI, SB, SP, AQ, U0126, or LY. 1% DMSO was used as a negative control. Designations are the same in Figure 5A and B.
Figure 5A. DPI blocks HCV-activated NFκB signaling. Relative luciferase activity (RLA) was normalized by dividing the firefly luciferase value by the Renilla luciferase value. HCV increased NFκB promoter signaling by over two fold. DPI and AQ completely blocked NFκB signaling. SB, SP, and U0126 reduced NFκB signaling by 82.9%, 76.7%, and 52.1%, respectively. In contrast, LY 294002 had no effect on NFκB signaling.
Figure 5B. DPI blocked HCV-mediated NFκB phosphorylation. HCV activated NFκB phosphorylation in JFH1 cells compared to Huh7.5.1 cells. DPI and AQ blocked NFκB phosphorylation. SB, SP, or U0126 partially reduced NFκB phosphorylation. In contrast, LY had no effect on NFκB phosphorylation. Lane#1 Huh7.5.1, #2 JFH1, Lane#3 JFH1+DPI; Lane#4 JFH1+SB; #5 JFH1+SP; #6 JFH1+AQ; #7 JFH1+U0126; #8 JFH1+LY.
HCV-induced TGF-β1 expression is abrogated by NFκB siRNA
To demonstrate that NFκB participates in HCV-mediated enhancement of TGF-β1 expression, we performed siRNA-mediated knockdown of NFκB. We found that JFH1 HCV-mediated enhancement of TGF-β1 expression was blocked by NFκB specific siRNA, but not by a negative control siRNA (Figure 6A). We also confirmed that NFκB siRNA significantly inhibited JFH1 HCV-activated TGF-β1 cytokine protein production (Figure 6B). This data confirm that HCV-mediated enhancement of TGF-β1 was dependent on NFκB activation. However, we found that HCV mediated ROS production was not inhibited by NFκB siRNA (Figure6C), indicating that ROS production was independent of NF-κB activation. We also found that JFH1-activated NFκB signaling was inhibited by NFκB siRNA but not by a negative control siRNA (Figure 6D). Western blotting confirmed that NFκB protein expression was knocked down by NFκB siRNA but not by a negative control siRNA (Figure 6E).
Figure 6. Effects of NFκB siRNA on ROS production and TGF-β1 expression.
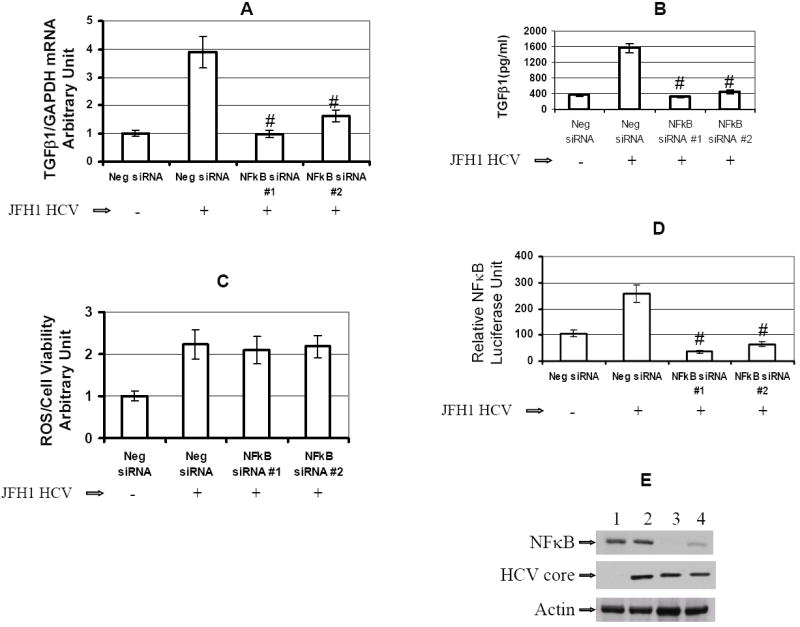
The siRNAs were transfected into Huh7.5.1 cells or JFH1 cells in 96-well plate for 72 hr. The siRNAs used for gene knocked down included Neg siRNA, NFκB siRNA#1, or NFκB siRNA#2. ROS generation and TGF-β1 expression were assessed in these siRNA transfected cells.
Figure 6A. NFκB siRNA reduced JFH1 HCV activated TGF-β1 mRNA expression. TGF-β1 expression was assessed in these siRNA transfected cells. HCV enhanced TGF-β1 expression by over 3 fold in JFH1-infected cells compared to Huh7.5.1 cells. NFκB specific siRNA#1 or siRNA#2 inhibited enhancement of TGF-β1 expression in JFH1 cells.
Figure 6B. NFκB siRNA significantly inhibited HCV-activated TGF-β1 cytokine production. TGF-β1 cytokine levels in supernatants were measured by ELISA. Both NFκB-specific siRNA #1 and siRNA #2 significantly reduced JFH1-induced TGF-β1 cytokine levels to 325±30 pg/ml (P<0.001), and 440±48 pg/ml (P<0.001), respectively, when compared to Neg siRNA in JFH1-infected cells (1571±111 pg/ml, n=4).
Figure 6C. NFκB siRNA had no effect on JFH1 HCV stimulated ROS production. ROS generation was measured in these siRNA transfected cells. HCV increased ROS production by over 2 fold in JFH1 cells. However, NFκB siRNA#1 or siRNA#2 had not effect on ROS production in JFH1 cells.
Figure 6D. NFκB siRNA inhibited NFκB signaling. To monitor the effect of NFκB siRNA on NFκB signaling, at 48 hours after siRNA transfection, NFκB promoter construct expressing firefly (pNFκB-Luc) and construct pRL-TK expressing Renilla luciferase were transfected into these siRNA transfected cells. Cell lysates were harvested for the luciferase assay after 24 hours of NFκB promoter transfection. Firefly and Renilla dual-luciferase activity was measured. RLA was normalized by dividing the firefly luciferase value by the Renilla luciferase value. Both NFκB siRNA #1 and siRNA #2 inhibited the HCV mediated NFκB signaling.
Figure 6E. NFκB siRNA knocked down NFκB protein expression. NFκB siRNA#1 or siRNA#2 knocked down the NFκB protein expression. Lane#1 Huh7.5.1+ Neg siRNA, #2 JFH1 + Neg siRNA, #3 NFκB siRNA #1, #4 NFκB siRNA #2.
Discussion
HCV infection can lead to liver fibrosis, cirrhosis, and HCC through multiple mechanisms. HCV induced TGF-β1 production appears to play a key role in hepatic fibrosis development. TGF-β1 is the most potent known profibrogenic factor. However, the molecular mechanism by which HCV induces TGF-β1 is not well characterized. It has been hypothesized that oxidative stress could contribute to the development of liver fibrosis by inducing the overproduction of TGF-β1 and angiotensin II21,22.
Using an infectious cell culture model of HCV, we demonstrate for the first time that HCV induces TGF- β1 through the generation of reactive oxygen species (ROS). Our data further indicate that ROS induce TGF-β1 through the activation of p38 MAPK, JNK, and ERK pathways, which in turn stimulate NFκB phosphorylation. The activated NFκB subsequently induces TGF-β1 expression. Our data provide new insights into a direct mechanism of liver fibrogenesis by HCV infection through the induction of ROS, NFκB, and TGF-β1.
It has been previously shown that HCV can induce ROS production in HCV core, NS3, and NS5 protein expression models, and in HCV replicon models4,6-8. HCV core expression has also been shown to induce the activation of JNK, p38 MAPK, and ERK pathways in the regulation of TGF-β2 and VEGF proteins23. HCV infection has also been linked to ER stress, which is associated with ROS production in chronically infected patients15. ROS can induce the proliferation of hepatic stellate cells and release of TGF-β1. ROS have also been shown to mediate TGF-β1 induced cellular responses in renal cells11. This likely plays an important role in the development of liver fibrosis associated with the HCV infection12. ROS-mediated activation of the p38 MAPK, JNK, ERK and NFκB pathways have been reported in multiple in vitro and in vivo models. It has been demonstrated that ROS is required to activate p38/Smad3 signaling and the release of active and latent TGF-β1 in stromal cells24. Elevation of ROS has also been reported to induce phosphorylation of p38 MAPK in hematopoietic stem cells25. ROS has also been demonstrated to increase TGF-β1 expression in rat HSC through activation of the MAPK pathway including p38 MAPK, JNK, ERK, and NFκB26,27. Our study, unlike previous work, is the first systematic investigation of the mechanisms of HCV-induced ROS generation and TGF-β1 production using the JFH1 infectious HCV model16,17. The finding that HCV directly induces profibrogenic cytokine release from hepatocytes in a ROS-dependent, p38 MAPK, JNK, and ERK-dependent manner is a novel one.
NFκB is one of the major signal-transduction molecules activated in response to oxidant stress. Activation of NFκB and its target genes is crucial for induction of immune responses and cell proliferation28,29. It has been reported that the NFκB pathway may regulate TGF-β1 production during the resolution of inflammation in vivo ; inhibition of NFκB reduced TGF-β1 expression in leukocytes30. Our study now demonstrates that ROS-induced NF-kB regulates TGF-β1 expression in the HCV-infected hepatocyte.
It should be noted that TGF-β1 is highly pleiotropic, and could also produce beneficial effects on suppression of proliferative activity31,32, so that not all effects of viral infection may be maladaptive. Nonetheless, the central role of TGF-β1 in fibrogenesis makes its predominant effect profibrogenic. While it has been reported that viral protein expression can inhibit TGF-β reporter gene activity through a direct interaction between HCV core and Smad331, our data strongly support that in the context of whole viral infection, there is strong induction of TGF-β1.
Our study provides new evidence, using an infectious tissue culture model, that HCV directly increases ROS and TGF-β1 expression. We propose a unique model in which HCV induces ROS generation, which in turn activates the phosphorylation of p38 MAPK, JNK, and ERK. The phosphorylated p38 MAPK, JNK, and p42/44 ERK subsequently induces the phosphorylation of NFκB. The activated NFκB translocates to the nucleus, upregulating cytokine genes, including TGF-β1 (Figure 7). We conclude that the HCV mediated TGF-β1 enhancement occurs through a ROS-induced and p38 MAPK, JNK, ERK1/2,- NFκB -dependent pathway. These results support the hypothesis that HCV enhances hepatic fibrosis progression through the generation of ROS and induction of TGF-β1. With demonstration of a direct link between viral infection, generation of oxidative stress, and profibrogenic cytokine release, it would appear that strategies to limit the viral induction of oxidative stress are warranted to inhibit hepatic fibrosis.
Figure 7. Schematic model of possible pathway of HCV increases TGF-β1 expression through generation of ROS and NFκB activation.
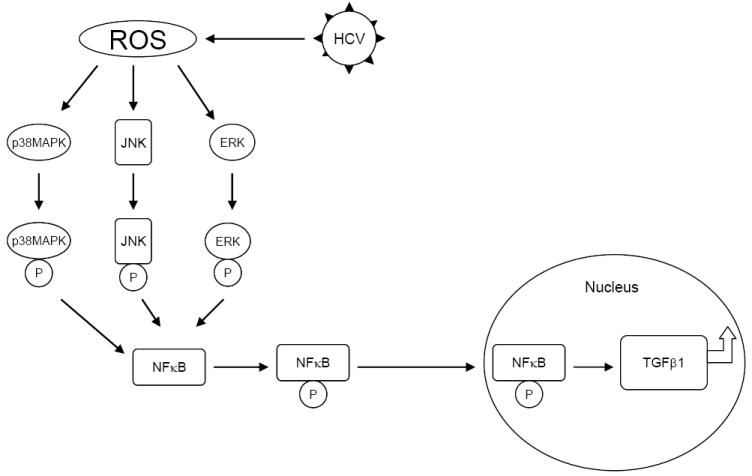
HCV infection induces ROS generation. ROS activate the phosphorylation of p38 MAPK, JNK, and ERK. The phosphorylated p38 MAPK, JNK, and p42/44 MEK subsequently activate the phosphorylation of NFκB. The activated NFκB translocates to the nucleus to upregulate large amount of cytokine genes including TGF-β1 production.
Supplementary Material
Acknowledgments
We are grateful to these investigators and institutes for supplying the reagents listed here: Dr. Ralf Bartenschlager, University Heidelberg, Germany; and Dr. Takaji Wakita, Second Department of Virology, National Institute of Infectious Diseases, Tokyo, Japan (infectious HCV virus JFH1 DNA construct); and Dr. Frank Chisari, Scripps Institute, CA (Hu7.5.1 cells). This work was support by NIH grant R01 AI069939 and U19 AI082630 (to RTC).
Footnotes
List of author contribution:
Wenyu Lin: study concept and design; acquisition of data; analysis and interpretation of data; drafting of the manuscript; critical revision of the manuscript for important intellectual content; statistical analysis; obtained funding; , technical and material support.
Wei-Lun Tsai: acquisition of data; analysis and interpretation of data, technical and material support.
Run-Xuan Shao: acquisition of data; analysis and interpretation of data, technical and material support.
Guoyang Wu: acquisition of data; analysis and interpretation of data, technical and material support.
Lee F. Peng: critical revision of the manuscript for important intellectual content.
Lydia L. Barlow: critical revision of the manuscript for important intellectual content.
Woo Jin Chung: technical and material support.
Leiliang Zhang: technical and material support.
Hong Zhao: technical and material support.
Jae-Young Jang: technical and material support.
Raymond T. Chung: study concept and design; analysis and interpretation of data; critical revision of the manuscript for important intellectual content; obtained funding; study supervision.
There is no conflict to disclose for the authors.
Publisher's Disclaimer: This is a PDF file of an unedited manuscript that has been accepted for publication. As a service to our customers we are providing this early version of the manuscript. The manuscript will undergo copyediting, typesetting, and review of the resulting proof before it is published in its final citable form. Please note that during the production process errors may be discovered which could affect the content, and all legal disclaimers that apply to the journal pertain.
References
- 1.Alter MJ. Epidemiology of viral hepatitis and HIV co-infection. J Hepatol. 2006;44:S6–9. doi: 10.1016/j.jhep.2005.11.004. [DOI] [PubMed] [Google Scholar]
- 2.Lauer GM, Walker BD. Hepatitis C virus infection. N Engl J Med. 2001;345:41–52. doi: 10.1056/NEJM200107053450107. [DOI] [PubMed] [Google Scholar]
- 3.Blackard JT, Kang M, Sherman KE, Koziel MJ, Peters MG, Chung RT. Effects of HCV treatment on cytokine expression during HCV/HIV coinfection. J Interferon Cytokine Res. 2006;26:834–8. doi: 10.1089/jir.2006.26.834. [DOI] [PMC free article] [PubMed] [Google Scholar]
- 4.Bataller R, Paik YH, Lindquist JN, Lemasters JJ, Brenner DA. Hepatitis C virus core and nonstructural proteins induce fibrogenic effects in hepatic stellate cells. Gastroenterology. 2004;126:529–40. doi: 10.1053/j.gastro.2003.11.018. [DOI] [PubMed] [Google Scholar]
- 5.Lin W, Weinberg EM, Tai AW, Peng LF, Brockman MA, Kim KA, Kim SS, Borges CB, Shao RX, Chung RT. HIV increases HCV replication in a TGF-beta1-dependent manner. Gastroenterology. 2008;134:803–11. doi: 10.1053/j.gastro.2008.01.005. [DOI] [PubMed] [Google Scholar]
- 6.Schulze-Krebs A, Preimel D, Popov Y, Bartenschlager R, Lohmann V, Pinzani M, Schuppan D. Hepatitis C virus-replicating hepatocytes induce fibrogenic activation of hepatic stellate cells. Gastroenterology. 2005;129:246–58. doi: 10.1053/j.gastro.2005.03.089. [DOI] [PubMed] [Google Scholar]
- 7.Otani K, Korenaga M, Beard MR, Li K, Qian T, Showalter LA, Singh AK, Wang T, Weinman SA. Hepatitis C virus core protein, cytochrome P450 2E1, and alcohol produce combined mitochondrial injury and cytotoxicity in hepatoma cells. Gastroenterology. 2005;128:96–107. doi: 10.1053/j.gastro.2004.10.045. [DOI] [PubMed] [Google Scholar]
- 8.Miura K, Taura K, Kodama Y, Schnabl B, Brenner DA. Hepatitis C virus-induced oxidative stress suppresses hepcidin expression through increased histone deacetylase activity. Hepatology. 2008;48:1420–9. doi: 10.1002/hep.22486. [DOI] [PubMed] [Google Scholar]
- 9.Okuda M, Li K, Beard MR, Showalter LA, Scholle F, Lemon SM, Weinman SA. Mitochondrial injury, oxidative stress, and antioxidant gene expression are induced by hepatitis C virus core protein. Gastroenterology. 2002;122:366–75. doi: 10.1053/gast.2002.30983. [DOI] [PubMed] [Google Scholar]
- 10.Machida K, Cheng KT, Lai CK, Jeng KS, Sung VM, Lai MM. Hepatitis C virus triggers mitochondrial permeability transition with production of reactive oxygen species, leading to DNA damage and STAT3 activation. J Virol. 2006;80:7199–207. doi: 10.1128/JVI.00321-06. [DOI] [PMC free article] [PubMed] [Google Scholar]
- 11.Rhyu DY, Yang Y, Ha H, Lee GT, Song JS, Uh ST, Lee HB. Role of reactive oxygen species in TGF-beta1-induced mitogen-activated protein kinase activation and epithelial-mesenchymal transition in renal tubular epithelial cells. J Am Soc Nephrol. 2005;16:667–75. doi: 10.1681/ASN.2004050425. [DOI] [PubMed] [Google Scholar]
- 12.Choi J, Ou JH. Mechanisms of liver injury. III. Oxidative stress in the pathogenesis of hepatitis C virus. Am J Physiol Gastrointest Liver Physiol. 2006;290:G847–51. doi: 10.1152/ajpgi.00522.2005. [DOI] [PubMed] [Google Scholar]
- 13.Dolganiuc A, Oak S, Kodys K, Golenbock DT, Finberg RW, Kurt-Jones E, Szabo G. Hepatitis C core and nonstructural 3 proteins trigger toll-like receptor 2-mediated pathways and inflammatory activation. Gastroenterology. 2004;127:1513–24. doi: 10.1053/j.gastro.2004.08.067. [DOI] [PubMed] [Google Scholar]
- 14.Zhao LJ, Zhao P, Chen QL, Ren H, Pan W, Qi ZT. Mitogen-activated protein kinase signalling pathways triggered by the hepatitis C virus envelope protein E2: implications for the prevention of infection. Cell Prolif. 2007;40:508–21. doi: 10.1111/j.1365-2184.2007.00453.x. [DOI] [PMC free article] [PubMed] [Google Scholar]
- 15.Tardif KD, Waris G, Siddiqui A. Hepatitis C virus, ER stress, and oxidative stress. Trends Microbiol. 2005;13:159–63. doi: 10.1016/j.tim.2005.02.004. [DOI] [PubMed] [Google Scholar]
- 16.Wakita T, Pietschmann T, Kato T, Date T, Miyamoto M, Zhao Z, Murthy K, Habermann A, Krausslich HG, Mizokami M, Bartenschlager R, Liang TJ. Production of infectious hepatitis C virus in tissue culture from a cloned viral genome. Nat Med. 2005;11:791–6. doi: 10.1038/nm1268. [DOI] [PMC free article] [PubMed] [Google Scholar]
- 17.Zhong J, Gastaminza P, Cheng G, Kapadia S, Kato T, Burton DR, Wieland SF, Uprichard SL, Wakita T, Chisari FV. Robust hepatitis C virus infection in vitro. Proc Natl Acad Sci U S A. 2005;102:9294–9. doi: 10.1073/pnas.0503596102. [DOI] [PMC free article] [PubMed] [Google Scholar]
- 18.Zhu Z, Wilson AT, Mathahs MM, Wen F, Brown KE, Luxon BA, Schmidt WN. Heme oxygenase-1 suppresses hepatitis C virus replication and increases resistance of hepatocytes to oxidant injury. Hepatology. 2008;48:1430–9. doi: 10.1002/hep.22491. [DOI] [PMC free article] [PubMed] [Google Scholar]
- 19.Lin W, Choe WH, Hiasa Y, Kamegaya Y, Blackard JT, Schmidt EV, Chung RT. Hepatitis C virus expression suppresses interferon signaling by degrading STAT1. Gastroenterology. 2005;128:1034–41. doi: 10.1053/j.gastro.2005.02.006. [DOI] [PubMed] [Google Scholar]
- 20.Lin W, Kim SS, Yeung E, Kamegaya Y, Blackard JT, Kim KA, Holtzman MJ, Chung RT. Hepatitis C virus core protein blocks interferon signaling by interaction with the STAT1 SH2 domain. J Virol. 2006;80:9226–35. doi: 10.1128/JVI.00459-06. [DOI] [PMC free article] [PubMed] [Google Scholar]
- 21.Bataller R, Brenner DA. Liver fibrosis. J Clin Invest. 2005;115:209–18. doi: 10.1172/JCI24282. [DOI] [PMC free article] [PubMed] [Google Scholar]
- 22.Urtasun R, Cubero FJ, Vera M, Nieto N. Reactive nitrogen species switch on early extracellular matrix remodeling via induction of MMP1 and TNFalpha. Gastroenterology. 2009;136:1410–22. e1–4. doi: 10.1053/j.gastro.2008.12.065. [DOI] [PubMed] [Google Scholar]
- 23.Hassan M, Selimovic D, Ghozlan H, Abdel-kader O. Hepatitis C virus core protein triggers hepatic angiogenesis by a mechanism including multiple pathways. Hepatology. 2009;49:1469–82. doi: 10.1002/hep.22849. [DOI] [PubMed] [Google Scholar]
- 24.Wang L, Clutter S, Benincosa J, Fortney J, Gibson LF. Activation of transforming growth factor-beta1/p38/Smad3 signaling in stromal cells requires reactive oxygen species-mediated MMP-2 activity during bone marrow damage. Stem Cells. 2005;23:1122–34. doi: 10.1634/stemcells.2004-0354. [DOI] [PubMed] [Google Scholar]
- 25.Ito K, Hirao A, Arai F, Takubo K, Matsuoka S, Miyamoto K, Ohmura M, Naka K, Hosokawa K, Ikeda Y, Suda T. Reactive oxygen species act through p38 MAPK to limit the lifespan of hematopoietic stem cells. Nat Med. 2006;12:446–51. doi: 10.1038/nm1388. [DOI] [PubMed] [Google Scholar]
- 26.Itagaki T, Shimizu I, Cheng X, Yuan Y, Oshio A, Tamaki K, Fukuno H, Honda H, Okamura Y, Ito S. Opposing effects of oestradiol and progesterone on intracellular pathways and activation processes in the oxidative stress induced activation of cultured rat hepatic stellate cells. Gut. 2005;54:1782–9. doi: 10.1136/gut.2005.053278. [DOI] [PMC free article] [PubMed] [Google Scholar]
- 27.Popov Y, Patsenker E, Bauer M, Niedobitek E, Schulze-Krebs A, Schuppan D. Halofuginone induces matrix metalloproteinases in rat hepatic stellate cells via activation of p38 and NFkappaB. J Biol Chem. 2006;281:15090–8. doi: 10.1074/jbc.M600030200. [DOI] [PubMed] [Google Scholar]
- 28.Fredericksen B, Akkaraju GR, Foy E, Wang C, Pflugheber J, Chen ZJ, Gale M., Jr Activation of the interferon-beta promoter during hepatitis C virus RNA replication. Viral Immunol. 2002;15:29–40. doi: 10.1089/088282402317340215. [DOI] [PubMed] [Google Scholar]
- 29.Mehta S, Cox A, Hoover D, Wang X, Mao Q, Ray S, Strathdee S, Vlahov D, Thomas D. Protection against persistence of hepatitis C. Lancet. 2002;359:1478–1483. doi: 10.1016/S0140-6736(02)08435-0. [DOI] [PubMed] [Google Scholar]
- 30.Lawrence T, Gilroy DW, Colville-Nash PR, Willoughby DA. Possible new role for NF-kappaB in the resolution of inflammation. Nat Med. 2001;7:1291–7. doi: 10.1038/nm1201-1291. [DOI] [PubMed] [Google Scholar]
- 31.Pavio N, Battaglia S, Boucreux D, Arnulf B, Sobesky R, Hermine O, Brechot C. Hepatitis C virus core variants isolated from liver tumor but not from adjacent non-tumor tissue interact with Smad3 and inhibit the TGF-beta pathway. Oncogene. 2005;24:6119–32. doi: 10.1038/sj.onc.1208749. [DOI] [PubMed] [Google Scholar]
- 32.Battaglia S, Benzoubir N, Nobilet S, Charneau P, Samuel D, Zignego AL, Atfi A, Brechot C, Bourgeade MF. Liver cancer-derived hepatitis C virus core proteins shift TGF-beta responses from tumor suppression to epithelial-mesenchymal transition. PLoS One. 2009;4:e4355. doi: 10.1371/journal.pone.0004355. [DOI] [PMC free article] [PubMed] [Google Scholar]
Associated Data
This section collects any data citations, data availability statements, or supplementary materials included in this article.