We explore here for the first time the direct potentiometric detectability of calcium, lead, and silver ions in amounts on the order of 300 attomoles at 100 picomolar concentrations without any preconcentration, analyte recycling, or electrocatalytic signal enhancement. For nearly all analytical techniques, the effective detection limits are known to deteriorate when samples drastically decrease in volume. Potentiometry with ion-selective electrodes is, at least in principle, not limited by such scaling laws as the observed potential is a direct function of the sample ion activity, independent of the sample volume. Indeed, intracellular analysis with ion-selective microelectrodes has been performed successfully for many years.1 Fundamental limits of measurable total quantities must exist for potentiometric sensors, but are still poorly explored. They may involve instrumental perturbations during the potential measurement, and, ultimately, limits imposed by decreasing the sample dimensions to under the Debye length where violations of the electroneutrality condition are allowed for the sample.
In recent years, potentiometric sensors based on polymeric membranes containing selective chemical receptors (ionophores) have been shown to reach detection limits in the subnanomolar concentration range, without the presence of metal ion buffers.2,3 This has been achieved by drastically reducing zero-current ion fluxes from the membrane in direction of the sample that historically have biased the detection limits and observed selectivities of such sensors by many orders of magnitude.4 Recent approaches include the development of trace level potentiometric sensing membranes backside contacted with conducting polymers as ion to electron transducers,5,6 monolithic columns as membrane supports,7 and more traditional polymeric membranes with optimized aqueous inner solutions.8
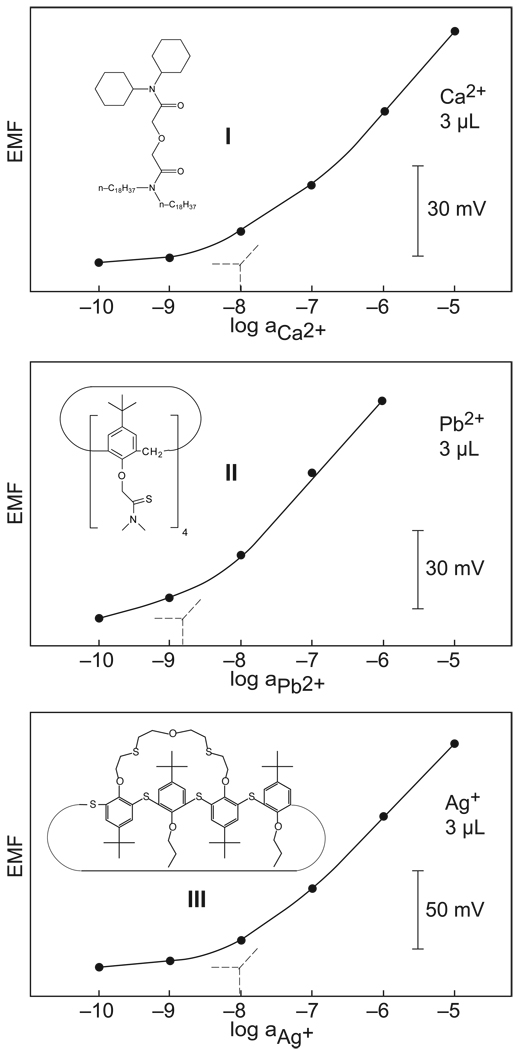
Three different types of ion-selective electrodes, selective for calcium, lead, and silver ions, respectively, were here prepared and explored. They were based on the ionophores I–III (see Figure 1) selective for Ca2+,9 Pb2+,9,10 and Ag+,11 respectively, which have been characterized earlier in macroelectrodes with detection limits in the subnanomolar range. The membranes were prepared in conventional polypropylene micropipette tips, see Figure 2, and back-side contacted with the appropriate inner solution (see supporting information). Calibration curves in large, 100-mL samples obtained by sequential dilution of the sample with 10−5 or 10−6 M sodium nitrate background electrolyte revealed detection limits of 1.5 × 10⁻⁹ (Ca2+), 2.7 × 10⁻⁹ (Pb2+, pH 4.0), and 3.4 × 10⁻⁹ M (Ag+), (see supporting information). The detection limit of potentiometric sensors is obtained as the activity where the extrapolated Nernstian response function intersects the potential for the electrolyte background. This is in accordance to accepted IUPAC recommendations12 and stands in contrast to the detection limit definition of most other analytical techniques, which is defined as the analyte concentration that gives a signal three times the background noise.13 We will use this other definition further below to assess the detectability of ions in confined samples.
Figure 1.
Calibration curves for potentiometric sensors selective for calcium, lead, and silver ions on the basis of the indicated ionophores, measured by sequential dilution in 3-µL samples without any metal ion buffer (see supporting information for potential–time traces).
Figure 2.
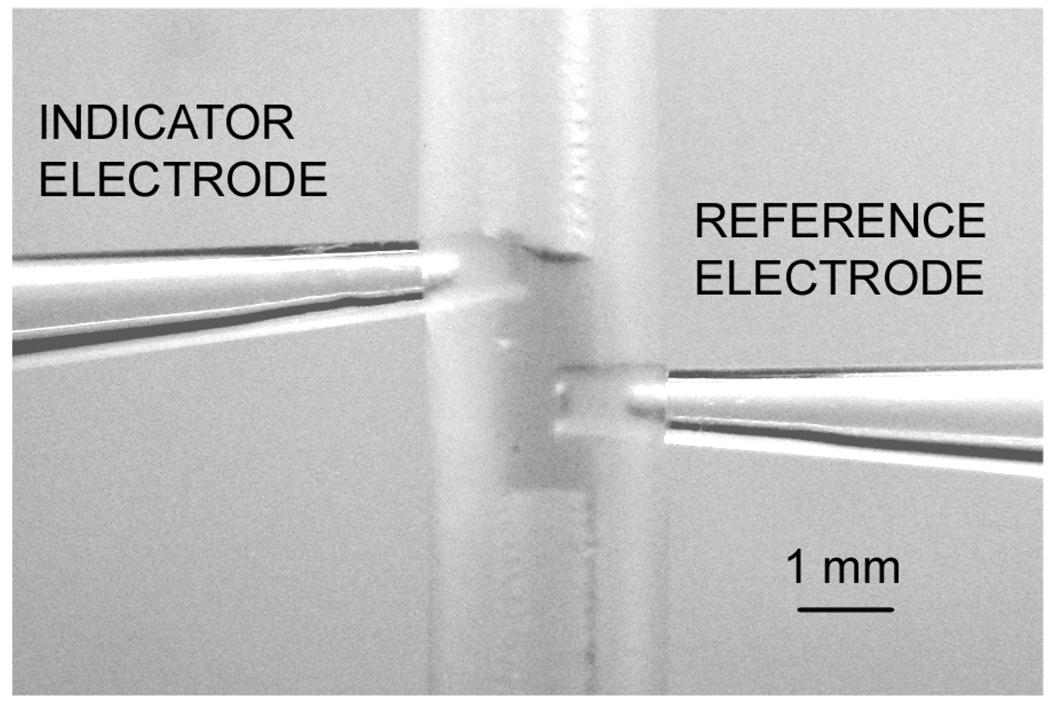
Detail of the 3-µL measuring cell. The indicator electrode (left) and sodium-selective pseudo-reference electrode (right) are inserted into a 1-mm i.d. silicone tube and placed in contact with the aqueous sample plug.
Figure 1 presents calibration curves of the three systems under study in samples of volumes on the order of 3 µL or less. This was achieved by mechanically inserting the pipette tip electrodes into a 1-mm i.d. silicone tubing and measuring a single plug of sample separated on either side from aqueous solutions by a plug of air (Figure 2). This arrangement, similar to that used in sequential analysis, eliminates evaporation loss and helps confine the sample to the desired volume. The calibration curves showed detection limits of 1.0 × 10⁻⁸ (Ca2+), 1.5 × 10⁻⁹ (Pb2+), and 1.0 × 10⁻⁸ M (Ag+) (traditional definition), similar as or somewhat less good than the ones observed in large sample volumes. This confirms the expectations formulated above that potentiometric sensors are not subject to scaling laws under the experimental conditions studied here. To achieve this result, care was taken to avoid contamination from the reference electrode. A sodium-selective electrode, constructed in similar fashion as the indicator electrodes, served as pseudo reference since the background sodium concentration was known and constant. This electrode was separately calibrated for sodium in a 100-mL sample, and showed a detection limit of 5.9 × 10⁻⁸ M Na+ with a Nernstian response slope (see supporting information). This is the lowest detection limit for a potentiomeric sodium sensor reported thus far, only a recently reported monolithic column electrode exhibiting similar characteristics.7
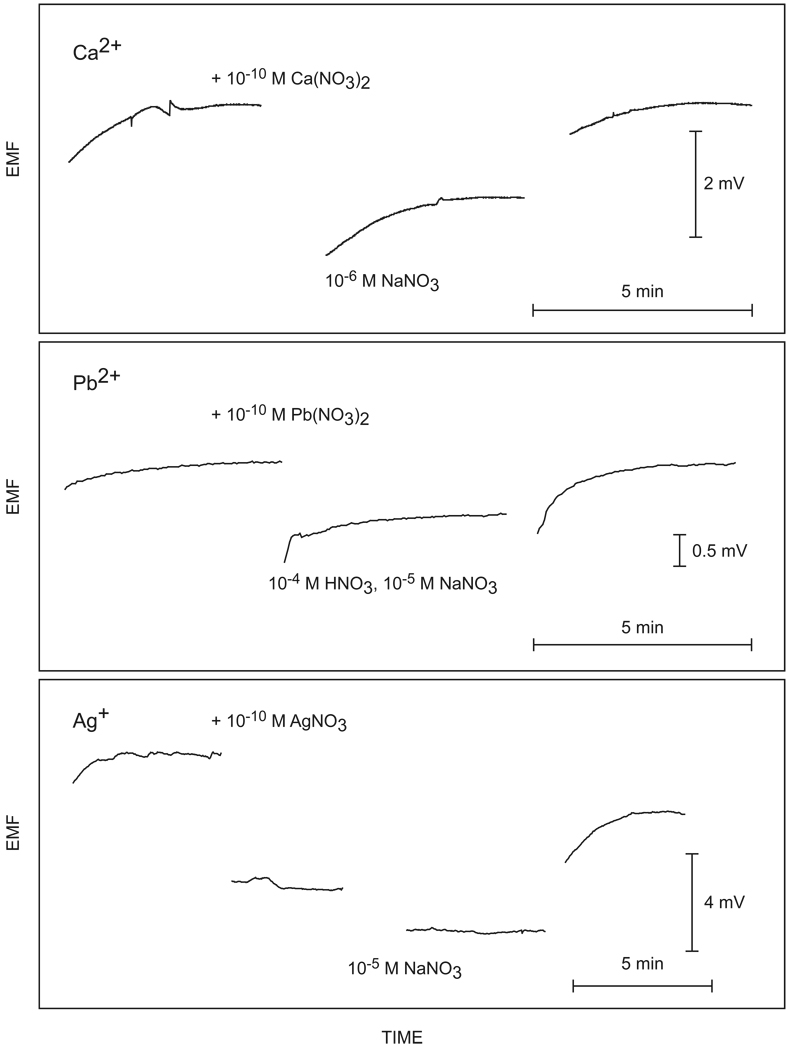
The detection limit definition applied above gives rather conservative limits that do not reflect the ultimate detectability of ions in solution. To explore this further, the accepted universal definition of the detection limit (three times the background noise) was also explored here. Figure 3 presents the potential–time traces for the measurement of the 10−5 or 10−6 M sodium nitrate background with and without a 100 picomolar concentration of the nitrate salt of each ion of interest. This corresponds to an amount of about 300 attomoles of sample. To eliminate any contamination, the cell was washed three times with the sample (ca. 5 µL each) at low flow rate between measurements. The samples can be clearly distinguished from the background in all cases, with signals that are significantly larger than the background noise. For the measurement of calcium, the standard deviation of the background noise was found as 5 µV (Figure 3), whereas addition of analyte increased the potential by 1.682 ± 0.008 mV. The ISE response function was extrapolated to three times the standard deviation of the background noise using the established approximation E = K + s log(aI + BG), where K is a constant, s is the theoretically predicted electrode slope, and BG is is the nominal primary ion background. This gives a predicted detection limit of 8.4 × 10⁻¹³ M, or 2.5 attomoles.
Figure 3.
Detectability of 100 pM (300 amol) of the indicated ions in 3 µL samples with the three ion-selective electrode systems used here. See text for calculated detection limits for these experiments.
Analogous experiments were performed for the detection of lead and silver ions, see Figure 3. For lead ions, the SD of the background noise was found as 11 µV, with a 0.425 ± 0.035 mV potential increase for the addition of 10−10 M lead nitrate to the background solution buffered to pH 4 with nitric acid. Extrapolation to three times the standard deviation gives a calculated detection limit of 23 attomoles (7.6 × 10⁻¹² M). For silver, the standard deviation of 60 µV compared to a signal change of 5.23 ± 0.29 mV, and the extrapolated detection limit was calculated as 0.98 zeptomoles (3.3 × 10⁻¹⁶ M).
The results presented above were achieved by direct potentiometry, without any analyte accumulation or catalytic enhancement processes that are often used in electroanalysis to improve detection limits. Direct potentiometry also offers the possibility to recover the sample, since it is essentially a perturbation-free method. The results presented here place zero-current potentiometry among the most sensitive electrochemical methods available.
Supplementary Material
ACKNOWLEDGMENTS
The authors are grateful for the National Institutes of Health (R01-EB002189) and ETH Zurich (internal research grant) for financial support of this research and Professor Istvan Bitter for providing a sample of the silver-selective ionophore.
Footnotes
Supporting Information Available: Calibration curves in large, 100-mL samples, potential–time traces for all calibrations, response characteristics of the sodium-selective pseudo-reference electrode, and experimental details. This information is available free of charge at http://www.pubs.acs.org.
REFERENCES
- 1.Thomas RC, Simon W, Oehme M. Nature. 1975;258:754–756. doi: 10.1038/258754a0. [DOI] [PubMed] [Google Scholar]
- 2.Sokalski T, Ceresa A, Zwickl T, Pretsch E. J. Am. Chem. Soc. 1997;119:11347–11348. [Google Scholar]
- 3.Bakker E, Pretsch E. Trends Anal. Chem. 2005;24:199–207. doi: 10.1016/j.trac.2005.01.003. [DOI] [PMC free article] [PubMed] [Google Scholar]
- 4.Bakker E, Pretsch E. Anal. Chem. 2002;74:420A–426A. doi: 10.1016/j.trac.2006.10.006. [DOI] [PMC free article] [PubMed] [Google Scholar]
- 5.Sutter J, Radu A, Peper S, Bakker E, Pretsch E. Anal. Chim. Acta. 2004;523:53–59. [Google Scholar]
- 6.Chumbimuni-Torres KY, Rubinova N, Radu A, Kubota LT, Bakker E. Anal. Chem. 2006;78:1318–1322. doi: 10.1021/ac050749y. [DOI] [PMC free article] [PubMed] [Google Scholar]
- 7.Vigassy T, Huber CG, Wintringer R, Pretsch E. Anal. Chem. 2005;77:3966–3970. doi: 10.1021/ac050424h. [DOI] [PubMed] [Google Scholar]
- 8.Ceresa A, Radu A, Peper S, Bakker E, Pretsch E. Anal. Chem. 2002;74:4027–4036. doi: 10.1021/ac025548y. [DOI] [PubMed] [Google Scholar]
- 9.Sokalski T, Ceresa A, Fibbioli M, Zwickl T, Bakker E, Pretsch E. Anal. Chem. 1999;71:1210–1214. [Google Scholar]
- 10.Malinowska E, Brzózka Z, Kasiura K, Egberink RJM, Reinhoudt DN. Anal. Chim. Acta. 1994;298:253–258. [Google Scholar]
- 11.Szigeti Z, Malon A, Vigassy T, Csokai V, Grün A, Wygladacz K, Ye N, Xu C, Chebny VJ, Bitter I, Rathore R, Bakker E, Pretsch E. Anal. Chim. Acta. 2006 doi: 10.1016/j.aca.2006.05.009. submitted. [DOI] [PMC free article] [PubMed] [Google Scholar]
- 12.Guilbault GG, Durst RA, Frant MS, Freiser H, Hansen EH, Light TS, Pungor E, Rechnitz G, Rice NM, Rohm TJ, Simon W, Thomas JDR. Pure Appl. Chem. 1976;48:127–132. [Google Scholar]
- 13.Midgley D. Analyst. 1979;104:248–257. [Google Scholar]
Associated Data
This section collects any data citations, data availability statements, or supplementary materials included in this article.


