

Abstract
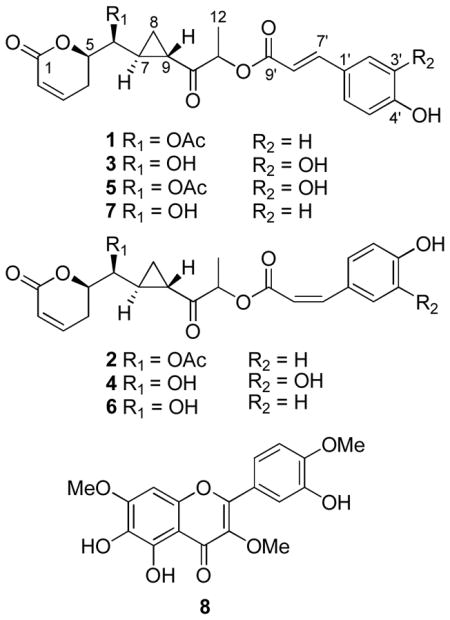
Six new 5,6-dihydro-α-pyrone derivatives (1–6), namely, brevipolides A–F, together with seven known compounds, including a 5,6-dihydro-α-pyrone derivative (7), three flavonoids, a steroid glycoside, and two triterpenoids, were isolated from the entire plant of Hyptis brevipes. Compounds 1–7 were assigned with the absolute configuration, 5R, 6S, 7S, and 9S, as elucidated by analysis of data obtained from their CD spectra and by Mosher ester reactions. Compounds 2, 6, and 7 exhibited ED50 values of 6.1, 6.7 and 3.6 μM against MCF-7 cells, and compounds 1, 2, 6, and 8 (the known 5,6,3′-trihydroxy-3,7,4′-trimethoxyflavone) gave ED50 values of 5.8, 6.1 7.5, and 3.6 μM against HT-29 cells, respectively. However, no significant cytotoxicity was found against Lu1 cells for any of the compounds isolated. When these compounds were subjected to evaluation in a panel of mechanism-based in vitro assays, compound 7 were found to be active in an enzyme-based ELISA NF-κB assay, with an ED50 value of 15.3 μM. In a mitochondrial transmembrane potential assay, compounds 3, 7, and 8 showed ED50 values of 8.5, 75, and 310 nM, respectively. However, no potent activity was found in a proteasome inhibition assay for any of the isolated compounds.
The genus Hyptis (Lamiaceae) is composed of approximately 350–400 species in the form of small herbs to large bushes, which are distributed in the tropics and warmer temperate regions all over the world. Previous studies on the constituents of species of the genus Hyptis have revealed diterpenoids,1,2 flavonoids,3,4 lignans,4,5 and α-pyrone derivatives.6,7 Hyptis brevipes Piot. originated from tropical America but is now widely distributed in other tropical regions of the world as an alien invasive species. Biological studies on crude extracts of this plant have shown inhibitory activities against bacterial and fungal growth, as well as DNA intercalation activity.8,9 There has been no previous report on the phytochemical evaluation of this plant to date.
As part of a collaborative, multi-disciplinary approach to the discovery of new naturally occurring anticancer drugs,10,11 the entire plant of H. brevipes was selected for further investigation, following initial cytotoxicity screening using the MCF-7 human breast cancer cell line. Cytotoxicity assay-guided fractionation and purification of the chloroform-soluble extract of H. brevipes led to the isolation and biological evaluation of six new (1–6) and one known (7) 5,6-dihydro-α-pyrone derivatives, as well as three known flavonoids, a steroid glycoside, and two triterpenoids. Compounds 1–6, bearing a cyclopropane moiety, belong to a novel skeletal class that was first reported in 2004, when 7 and several analogues were found to be chemokine receptor 5 (CCR5) inhibitors.12 The structures of the other known compounds isolated in the present study were identified by physical and spectroscopic measurements ([α]D, 1H NMR, 13C NMR, DEPT, 2D-NMR, and MS) and by comparing the data obtained with published values, as daucosterol,13 ursolic acid,14 2α-hydroxyursolic acid (maslinic acid),14 5,3′-dihydroxy-3,7,4′-trimethoxyflavone (ayanin),15 3,5,3′-trihydroxy-7,4′-dimethoxyflavone (ombuin),16 and 5,6,3′-trihydroxy-3,7,4′-trimethoxyflavone (8).17
The development of cancer involves a wide spectrum of changes at the molecular level, which include, but are not limited to, sustained activation of proteasome and nuclear factor κB (NF-κB), as well as resistance to apoptosis. Proteasomes present in the cytoplasm and nucleus of eukaryotic cells serve a key role in regulating cell cycle progression, signal transduction, transcription regulation, and apoptosis. Proteasome inhibition has been demonstrated as a relatively new approach to treating cancer.18,19 NF-κB is a tightly-regulated transcription factor that is maintained in an inactive form under most basal conditions. Previous studies have shown that constitutively activated NF-κB is associated with many spontaneous and virally induced oncogenesis events in humans, leading to cancer cell proliferation and survival, as well as being related to angiogenesis and metastasis. Therefore, chemotherapy targeting the NF-κB signal transduction pathway has been proposed for anticancer drug development.20–22 One of the most important mechanisms for cancer cell survival is evasion from apoptosis, and chemical agents that can induce programmed cell death may be effective against many types of cancers.23,24 During apoptosis, several key events occur in the mitochondria, including the loss of mitochondrial transmembrane potential (ΔΨm). Thus, ΔΨm measurement can be used as an indicator of cellular health.25 Accordingly, the extracts, chromatographic fractions and pure isolates from H. brevipes were subjected to testing in the MCF-7 cytotoxicity assay, as well as in proteasome inhibition, NF-κB inhibition, and mitochondrial transmembrane potential assays.
Results and Discussion
Compound 1 was obtained as a colorless gum and afforded a sodiated molecular ion peak at m/z 451.1354 (calcd for C23H24O8Na, 451.1369) in the HRESIMS. The 1H NMR spectroscopic data of 1 (Table 1) showed a characteristic AA′BB′ system of a para-substituted benzene ring at δH 7.35 (2H, d, J = 8.5 Hz, H-2′, H-6′) and 6.83 (2H, d, J = 8.5 Hz, H-3′, H-5′). Resonance signals at δH 7.62 (1H, d, J = 16.0 Hz, H-7′) and 6.27 (1H, d, J = 16.0 Hz, H-8′) suggested the presence of a trans double bond. Signals of a cis double bond adjacent to a methylene group were also observed at δH 6.95 (1H, ddd, J = 9.4, 6.6, 2.3 Hz, H-3), 6.05 (1H, dd, J = 9.4, 2.6 Hz, H-2), 2.65 (1H, m, H-4β), and 2.48 (1H, m, H-4α). In the COSY spectrum, two oxygenated methine groups were found to be connected to one another, which was substantiated by analyzing coupling constants of the resonance signals at δH 4.70 (1H, dd, J = 8.7, 3.7 Hz, H-6) and 4.61 (1H, dt, J = 12.2, 3.7 Hz, H-5), Also, using the COSY spectrum, another oxygenated methine group was determined to be connected to a methyl functionality from correlations between signals at δH 5.25 (1H, q, J = 7.0 Hz, H-11) and 1.50 (3H, d, J = 7.0 Hz, H-12). The methylene signals occuring in the upfield region at δH 1.41 (1H, m, H-8α) and 1.08 (1H, m, H-8β), together with signals at δH 2.33 (1H, m, H-9) and 1.69 (1H, m, H-7), were attributed to the presence of a cyclopropane ring.26 A singlet signal at δH 2.14 (3H, s, OAc) suggested the presence of an acetyl group. Consistent with the 1H NMR data, the 13C NMR and DEPT135 spectroscopic data of 1 also showed signals of a para-substituted benzene ring at δC 158.9 (C-4′), 126.1 (C-1′), 130.1 (C-2′, 6′), and 116.0 (C-3′, 5′), two double bonds at δC 146.0 (C-7′), 145.1 (C-3), 121.0 (C-2), and 113.6 (C-8′), three oxygenated methine carbons at δC 77.9 (C-5), 75.0 (C-11), and 74.5 (C-6), two methine carbons at δC 25.2 (C-7) and 22.5 (C-9), two methylene carbons at δC 24.3 (C-4) and 14.4 (C-8), as well as two methyl carbons at 20.9 (OAc) and 15.9 (C-12). Furthermore, four carbonyl carbon signals at δC 207.3 (C-10), 170.5 (OAc), 168.8 (C-9′), and 163.7 (C-1), could be assigned, in turn, to a ketone, an acetyl, an α,β-unsaturated ester, and an α,β-unsaturated lactone functionality. In the 1H-1H COSY spectrum of compound 1 (Figure 1), correlations from H-5 and H-7 to H-6 indicated the lactone and cyclopropane moieties to be connected through C-6. Other 2D NMR spectroscopic correlations observed in the HMBC experiment (Figure 1) were supportive of the proposed planar structure.
Table 1.
1H NMR Chemical Shifts of 1–6 (δH, mult., J in Hz)
| Position | 1a | 2a | 3b | 4b | 5c | 6b |
|---|---|---|---|---|---|---|
| 2 | 6.05, dd, 9.4, 2.6 | 6.03, dd, 7.9, 1.2 | 5.92, dd, 9.9, 1.5 | 5.92, ddd, 10.8, 1.7, 1.7 | 5.99, d, 7.9 | 5.92, ddd, 9.5, 1.9, 1.9 |
| 3 | 6.95, ddd, 9.4, 6.6, 2.3 | 6.93, m | 7.08 (overlapped with H-5′) | 7.06, ddd, 10.2, 4.5, 4.5 | 7.07 (overlappped with H-5′) | 7.05, dt, 9.5, 4.3 |
| 4 | 2.48, m; 2.65, m | 2.39, m; 2.62, m | 2.61, m (2H) | 2.62, m (2H) | 2.60, m (2H) | 2.63, m (2H) |
| 5 | 4.61, dt, 12.2, 3.7 | 4.59, dt, 12.2, 3.7 | 4.50, ddd, m | 4.49, ddd, 8.0, 8.0, 4.5 | 4.59, dt, 10.8, 3.9 | 4.50, ddd, 8.0, 8.0, 4.3 |
| 6 | 4.70, dd, 8.7, 3.7 | 4.68, dd, 8.6, 3.7 | 3.72, t, 4.7 | 3.73, t, 4.5 | 4.77, dd, 8.4, 3.9 | 3.74, t, 4.3 |
| 7 | 1.69, m | 1.68, m | 1.61, m | 1.62, m | 1.64, m | 1.61, m |
| 8 | 1.08, m; 1.41, m | 1.03, m; 1.41, m | 1.14, m (2H) | 1.15, m (2H) | 1.16, m; 1.31, m | 1.13, m (2H) |
| 9 | 2.41, m | 2.35, m | 2.36, m | 2.36, m | 2.35, m | 2.36, m |
| 11 | 5.25, q, 7.0 | 5.16, q, 7.0 | 5.30, q, 7.0 | 5.26, q, 7.1 | 5.21, q, 7.1 | 5.28, q, 7.1 |
| 12 | 1.50, d, 7.0 | 1.43, d, 7.0 | 1.49, d, 7.0 | 1.46, d, 7.1 | 1.46, d, 7.1 | 1.46, d, 7.1 |
| 2′ | 7.35, d, 8.5 | 7.57, d, 8.2 | 7.19, br. s | 7.64, d, 1.8 | 7.07, br. s | 7.77, d, 8.5 |
| 3′ | 6.83, d, 8.5 | 6.79, d, 8.2 | — | — | — | 6.85, d, 8.5 |
| 5′ | 7.35, d, 8.5 | 7.57, d, 8.2 | 6.88, d, 8.2 | 6.82, d, 8.2 | 6.80, d, 8.1 | 7.77, d, 8.5 |
| 6′ | 6.83, d, 8.5 | 6.79, d, 8.2 | 7.08, d, 8.2 | 7.16, dd, 8.2, 1.8 | 6.97, dd, 8.1, 1.6 | 6.85, d, 8.5 |
| 7′ | 7.62, d, 16.0 | 6.89, d, 12.7 | 7.60, d, 15.9 | 6.89, d, 12.9 | 7.60, d, 16.0 | 6.97, d, 12.9 |
| 8′ | 6.27, d, 16.0 | 5.86, d, 12.7 | 6.36, d, 15.9 | 5.85, d, 12.9 | 6.32, d, 16.0 | 5.87, d, 12.9 |
| OAc | 2.14, s | 2.06, s | — | — | 2.13, s | — |
In CDCl3.
In acetone-d6.
In CD3OD.
Figure 1.
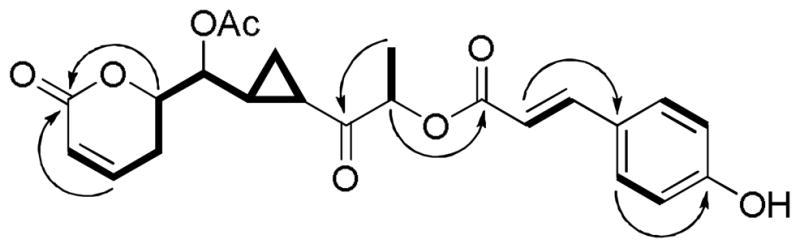
Selected 1H-1H COSY ( ) and HMBC (↷) correlations observed for 1.
The relative configuration of compound 1 at the C-5, C-6 and C-7 positions was determined by correlations from H-7 to H-4α, H-5 and H-8α, as well as from H-6 to H-8β and H-9 in the NOESY spectrum (Figure 2), and by comparison with the data of reported analogues.12 The CD spectrum of compound 1 exhibited a positive Cotton effect at 259.5 nm. According to the published observations between chirality in α,β-unsaturated δ-lactones and the Cotton effect around 260 nm, the absolute configuration of compound 1 at the C-5 position could be determined as R.27 Thus, the structure of the new compound 1 was established as depicted, and it was assigned the trivial name, brevipolide A.
Figure 2.
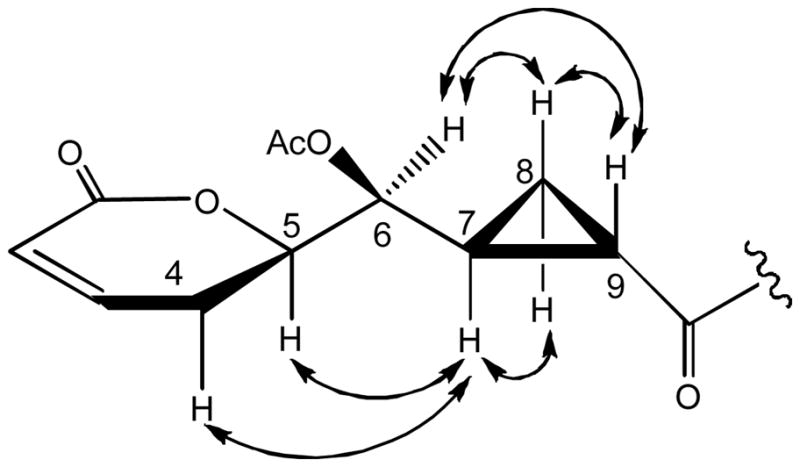
Selected NOESY ( ) correlations observed for 1.
The HRESIMS of compound 2 provided a sodiated molecular ion peak at m/z 451.1343, corresponding to an elemental formula of C23H24O8Na (calcd for 451.1369), the same as that of compound 1. In addition, the UV, CD, IR, and NMR spectra of compound 2 were found to be closely comparable to those of compound 1, indicating that these two compounds are geometrical isomers. The coupling constant values of the resonance signals at δH 6.89 (1H, d, J = 12.7 Hz, H-7′) and 5.86 (1H, d, J = 12.7 Hz, H-8′) suggested that 2 is a Z isomer of compound 1 at the phenylpropanoid double bond position. Accordingly, the new compound, brevipolide B (2), was assigned as shown.
Compound 3 (brevipolide C) was obtained as a colorless gum. Its HRESIMS exhibited a sodiated molecular ion peak at m/z 425.1216 (calcd for C21H22O8Na, 425.1212). The structure of compound 3 was found to be similar to that of compound 1. However, the 1H NMR spectrum of 3 (Table 1) showed 1,3,4-trisubstitued aromatic proton signals at δH 7.19 (1H, br s, H-2′), 7.08 (1H, d, J = 8.2 Hz, H-6′) and 6.88 (1H, d, J = 8.2 Hz, H-5′), indicating the presence of a caffeoyl moiety. The absence of acetyl functionality signals in both the 1H and 13C NMR spectra, as well as an upfield shift of the H-6 signal in the 1H NMR spectrum to δH 3.72 in compound 3, when compared with δH 4.70 in compound 1, suggested the occurrence of a free hydroxy group at the C-6 position. Therefore, a planar structure could be proposed for 3.
The absolute configuration at C-6 of compound 3 was determined using the Mosher ester procedure.28–31 The chemical shift difference values [ΔδS-δR, H-2 (+0.06), H-3 (+0.11), H-4 (+0.2), H-5 (+0.11), H-6 (+0.01), H-7 (−0.11), H-8 (−0.06 and −0.11), H-9 (−0.03), H-11 (−0.04)] obtained by comparing the relevant 1H NMR data of the R- and S-MTPA esters of compound 3 indicated the absolute configuration of C-6 to be S. Hydrolysis reactions catalyzed by different acids and bases, as well as the esterase enzyme, were carried out in an attempt to produce a derivative of 3 with a free C-11 hydroxy group, so that this could be used for a Mosher ester reaction to determine the configuration of this position. However, all the hydrolysis products obtained racemized at the C-11 position, probably due to the formation of enol intermediates during the reactions.
The molecular formula of compound 4 was determined as C21H22O8, from the sodiated molecular ion peak at m/z 425.1187 (calcd for C21H22O8Na, 425.1212) in the HRESIMS. Its 1H and 13C NMR spectra were similar to those of compound 3 except for a difference due to the double bond in the caffeoyl moiety. A cis double bond in compound 4 was concluded according to the coupling constant values of resonance signals at δH 6.89 (1H, d, J = 12.9 Hz, H-7′) and 5.85 (1H, d, J = 12.9 Hz, H-8′), compared to the value of J7′8′ = 15.9 Hz in the trans form in compound 3. Therefore, the structure of brevipolide D was assigned as 4.
Compound 5 was obtained as a colorless gum. The HRESIMS showed a sodiated molecular ion peak at m/z 467.1293, consistent with an elemental formula of C23H24O9Na (calcd 467.1318). The 1H and 13C NMR spectra of compound 5 exhibited closely related signals to those of compound 3, but with signals of an additional acetyl group at δH 2.13 (3H, s) and δC 172.1 and 21.0. The downfield shift of the proton resonance at δH 4.77 (1H, dd, J = 8.4, 3.9 Hz, H-6), when compared with that in compound 3, suggested that this acetyl group is substituted at the C-6 hydroxy functionality. Thus, the new brevipolide E was assigned with the structure 5.
A sodiated molecular ion peak for compound 6 was observed at m/z 409.1263 (calcd for C21H22O7Na, 409.1263) in the HRESIMS. The 1H and 13C NMR spectra of compound 6 were closely comparable to those of compound 2. However, the absence of acetyl functionality signals, and the migration of H-6 signals from δH 4.68 of compound 2 to δH 3.74 in the 1H NMR spectrum indicated the presence of a free hydroxy group at the C-6 position. Therefore, brevipolide F was established structurally as 6.
Based on the similar CD spectroscopic profiles and NOESY NMR correlations of all the new compounds and of the known compound 7, it could be assumed that all of these substances have the same absolute configuration. Therefore, the absolute configuration of compounds 1–7 was determined as 5R, 6S, 7S, and 9S, with the C-11 position unresolved in each case.
All the isolated compounds were evaluated for their cytotoxicity against MCF-7 human breast cancer cells, HT-29 human colon cancer cells, and Lu1 human lung cancer cells, performed according to standard protocols.32 Of these thirteen isolates, compounds 2, 6, and 7 were found to be active principles, with ED50 values of 6.1, 6.7, and 3.6 μM against MCF-7 cells, and compounds 1, 2, 6, and 8 with ED50 values of 5.8, 6.1, 7.5, and 3.6 μM against HT-29 cells, respectively. No significant activity was found against Lu1 cells for any of the compounds tested. The ED50 values of compounds 1, and 3–5 against MCF-7 cells were >10 μM in each case. These data suggest that the cis isomers are more cytotoxic than their trans counterparts for this cell line, and esterification at the C-6 position in compounds 1 and 2, as well as hydroxy substitution at the C-3′ position in compounds 3 and 4 may led the decrease of activity when compared to compounds 6 and 7. It is also apparent that hydroxy substitution at the C-3′ position led to decreased cytotoxicity for these 5,6-dihydro-α-pyrones against HT-29 cells.
All compounds were subjected to evaluation in a panel of mechanism-based in vitro assays. However, only compounds 3, 4 and 8 were found to be show any measurable activity at all in a proteasome inhibition assay, with ED50 values of 38.0, 44.5 and 17 μM, respectively.33,34 In an enzyme-based ELISA NF-κB assay, compound 7 demonstrated an ED50 value of 15.3 μM, compared with ED50 values of >50 μM for the remaining compounds.35,36 In a mitochondrial transmembrane potential (MTP) assay, only compounds 3, 7, and 8 showed activity, with ED50 values of 8.5, 75, and 310 nM, respectively.25 From these data, it can be proposed that the presence of a free hydroxy group at C-6 and a cis configuration in the phenylpropanoid moiety of the 5,6-dihydro-α-pyrone compounds are required for activity in this mechanistic assay.
Experimental Section
General Experimental Procedures
Optical rotations were obtained on a Perkin-Elmer 343 automatic polarimeter. UV spectra were measured with a Perkin-Elmer Lambda 10 UV/vis spectrometer. CD spectra were measured on a JASCO J-810 spectrometer. IR spectra were run on a Thermo Scientific Nicolet 6700 FT-IR spectrometer. NMR spectroscopic data were recorded at room temperature on a Bruker Avance DPX-300 or DRX-400 spectrometer. Column chromatography was performed with 65–250 or 230–400 mesh silica gel (Sorbent Technologies, Atlanta, GA). Analytical thin-layer chromatography was conducted on 250 μm thickness Partisil® silica gel 60 F254 glass plates (Whatman, Clifton, NJ). Analytical and semi-preparative HPLC were carried out on a Waters system composed of a 600 controller, a 717 plus autosampler, and a 2487 dual wavelength absorbance detector, with Waters Sunfire analytical (4.6 × 150 mm) and preparative (19 × 150 mm) C18 columns. All other chemicals and reagents were purchased from Sigma-Aldrich (St. Louis, MO).
Plant Material
The entire plants of H. brevipes were collected from Tawangmangu village, Karanganyar, Central Java, Indonesia, in February 2003. The plant was identified by Dr. Sugeng Sugiarso, Research Center for Indonesian Medicinal Plants, Ministry of Health, Indonesia. A voucher specimen (accession number P4046) has been deposited at the Field Museum of Natural History, Chicago, Illinois.
Extraction and Isolation
The air-dried whole plants of H. brevipes (716 g) were ground and extracted with methanol overnight (3 × 3 L). The macerate was concentrated in vacuo (46.5 g) and partitioned to afford a hexane extract (12.0 g), a chloroform extract (10.3 g), and an aqueous extract (21.9 g). The chloroform extract was fractionated using silica gel vacuum-liquid chromatography (Aldrich, Si gel 60, 63–200 mesh, 8.5 × 19 cm) using pure hexane initially, followed in turn by a gradient of increasing polarity using hexane-ethyl acetate and ethyl acetate-methanol. The column was then washed with 100% methanol. Altogether, ten pooled fractions (F06-F15) were collected. Ursolic acid (15 mg) was obtained as a precipitate from F07. A yellow solid precipitated from fraction F08, which was chromatographed further using silica gel (Aldrich, Si gel 60, 230–400 mesh, 3.0 × 52 cm), beginning with 5:1 hexane-acetone, followed by a gradient of increasing polarity, and washed with 100% methanol to afford purified ayanin (30 mg). Daucosterol (11 mg) was obtained as a precipitate from F12.
Fraction F08 (1.03 g) was found to be the most active for the MCF-7 breast cancer cell line (ED50 6.0 μg/mL) and was fractionated by passage on silica gel (5.0 × 58 cm, 230–400 mesh) using the following solvent systems: 100% CH2Cl2 (1.5 L), 2% MeOH-CH2Cl2 (1 L); 3% MeOH-CH2Cl2 (1 L), 5% MeOH-CH2Cl2 (500 mL), 15% MeOH-CH2Cl2 (1 L), 50% MeOH-CH2Cl2 (1 L), and 100% MeOH (1.5 L), with eleven pooled fractions obtained (F08F1–F08F11). Ombuin (13 mg) was isolated from the mother liquor of F08F5. Maslinic acid (20 mg) was obtained as a precipitate from F08F9. Fraction F09 was partitioned on a Sephadex LH-20 column (4 × 50 cm) using pure MeOH to give three subfractions (F0901-F0903). A mixture (60 mg) obtained from subfraction F0902 (1.2 g) by repeated silica gel chromatography was purified by preparative HPLC to give the new compounds 1 (tR 26.1 min, 34 mg) and 2 (tR 27.7 min, 10 mg), using MeCN-H2O (28:72, 10 mL/min) as eluting solvent. Fraction F10 (1.27 g) was fractionated using a Sephadex LH-20 column (230–400 mesh, 3.0 × 100 cm) eluted with pure MeOH, and seven pooled fractions (F10F1–F10F7) were obtained. Fraction F10F2 (560 mg) was chromatographed over a fine silica gel column (230–400 mesh, 2.0 × 45 cm) eluted with CHCl3-acetone from 10:1 to 6:1, to give a mixture (110 mg). The obtained mixture was subjected to preparative HPLC with MeCN-H2O (30:70, 10 mL/min) as solvent to give 7 (tR 21.2 min, 28 mg), 6 (tR 24.1 min, 7 mg F10F2K2), and 5 (tR 36.3 min, 4 mg). 5,6,3′-Trihydroxy-2,7,4′-trimethoxyflavone (8, 108 mg) was purified from F10F4 by repeated silica gel column chromatography (230–400 mesh, 4 × 50 cm) eluted with CHCl3-MeOH (from 10:1 to 5:1). Fractions F12 and F13 were combined and the new bulked fraction F12′ (1.8 g) was chromatographed over a Sephadex LH-20 column (4.5 × 50 cm) using pure MeOH as eluting solvent to give five sub-fractions (F12′F1-F12′F5). Sub-fraction F12′F4 (460 mg) was passaged over a silica gel column (230–400 mesh, 1 × 40 cm), eluted with CHCl3-acetone (4:1) to give a mixture (60 mg). This mixture was separated by preparative HPLC, using MeCN-0.5% formic acid water solution (25:75, 10 mL/min) as solvent system, to afford the new compounds 3 (tR 21.8 min, 42 mg) and 4 (tR 23.2 min, 11 mg).
Brevipolide A (1): colorless gum; [α]20D +6.3 (c 0.2, MeOH); CD (c 1.1×10⁻⁵ M, MeOH) λmax (Δε) 232 (−0.75), 259.5 (+2.27), 279 (+0.95), 300 (+2.14) nm; UV (MeOH) λmax (log ε) 208 (0.93), 316 (0.90) nm; IR (film) νmax 3355 (br), 3018, 2938, 1703, 1623, 1605, 1582, 1514, 1438, 1370, 1229, 1165, 1066, 1039, 816, 752 cm−1; 1H NMR (400 MHz, CDCl3) data, see Table 1; 13C NMR (100 MHz, CDCl3) data, see Table 2; HRESIMS m/z 451.1354 [M+Na]+ (calcd for C23H24O8Na, 451.1369).
Table 2.
13C NMR Chemical Shifts of 1–6
| position | 1a | 2a | 3b | 4b | 5c | 6b |
|---|---|---|---|---|---|---|
| 1 | 163.7 | 163.9 | 164.4 | 164.2 | 166.0 | 164.1 |
| 2 | 121.0 | 121.1 | 121.5 | 121.2 | 121.4 | 121.2 |
| 3 | 145.1 | 145.1 | 147.4 | 147.3 | 148.0d | 147.1 |
| 4 | 24.3 | 24.6 | 25.2 | 24.9 | 25.7 | 24.8 |
| 5 | 77.9 | 78.1 | 81.8 | 81.5 | 79.8 | 81.6 |
| 6 | 74.5 | 74.5 | 72.1 | 71.6 | 76.0 | 71.6 |
| 7 | 25.2 | 25.2 | 28.0 | 27.6 | 26.6 | 27.7 |
| 8 | 14.4 | 14.7 | 14.5 | 14.3 | 15.1 | 14.2 |
| 9 | 22.5 | 22.6 | 21.4 | 21.0 | 23.5 | 21.1 |
| 10 | 207.3 | 207.3 | 207.3 | 207.1 | 208.9 | 207.1 |
| 11 | 75.0 | 75.0 | 76.1 | 75.9 | 76.6 | 75.8 |
| 12 | 15.9 | 15.8 | 16.8 | 16.4 | 16.4 | 16.4 |
| 1′ | 126.1 | 126.8 | 127.8 | 127.8 | 127.7 | 131.1 |
| 2′ | 130.1 | 132.3 | 115.6 | 115.6 | 115.3 | 133.9 |
| 3′ | 116.0 | 115.1 | 149.3 | 148.4 | 150.0 | 115.7 |
| 4′ | 158.9 | 157.6 | 146.6 | 145.1 | 147.0 | 159.9 |
| 5′ | 116.0 | 115.1 | 116.7 | 118.5 | 116.7 | 115.7 |
| 6′ | 130.1 | 132.3 | 123.1 | 125.7 | 123.3 | 133.9 |
| 7′ | 146.0 | 145.2 | 147.0 | 145.9 | 148.1d | 145.6 |
| 8′ | 113.6 | 115.6 | 115.1 | 115.5 | 114.4 | 115.7 |
| 9′ | 168.8 | 165.9 | 167.2 | 166.2 | 168.5 | 166.3 |
| OCCH3 | 170.5 | 170.6 | 172.1 | |||
| OCCH3 | 20.9 | 20.9 | 21.0 |
In CDCl3.
In acetone-d6.
In CD3OD.
Data interchangeable.
Brevipolide B (2): colorless gum; [α]20D +3.7 (c 0.2, MeOH); CD (c 1.1×10⁻⁵ M, MeOH) λmax (Δε) 230 (−0.86), 160 (+2.82), 280 (+1.02), 300 (+0.55) nm; UV (MeOH) λmax (log ε) 213 (1.23), 315 (1.18) nm; IR (film) νmax 3360 (br), 3015, 2933, 1704, 1605, 1512, 1446, 1372, 1234, 1160, 1046, 817, 756 cm−1; 1H NMR (400 MHz, CDCl3) data, see Table 1; 13C NMR (100 MHz, CDCl3) data, see Table 2; HRESIMS m/z 451.1343 [M+Na]+ (calcd for C23H24O8Na, 451.1369).
Brevipolide C (3): colorless gum; [α]20D +9.4 (c 0.1, MeOH); CD (c 1.2×10⁻⁵ M, MeOH) λmax (Δε) 228 (−1.00), 261 (+3.6), 280 (+2.40), 300 (+3.41) nm; UV (MeOH) λmax (log ε) 208 (1.17), 252 (1.00) nm; IR (film) νmax 3408 (br), 3018, 2919, 1703, 1631, 1600, 1517, 1445, 1385, 1263, 1161, 1074, 812, 756 cm−1; 1H NMR (400 MHz, acetone-d6) data, see Table 1; 13C NMR (100 MHz, acetone-d6) data, see Table 2; HRESIMS m/z 425.1216 [M+Na]+ (calcd for C21H22O8Na, 425.1212).
Brevipolide D (4): colorless gum; [α]20D +8.3 (c 0.1, MeOH); UV (MeOH) λmax (log ε) 208 (0.97), 333 (0.77) nm; CD (c 1.2×10⁻⁵ M, MeOH) λmax (Δε) 229 (−1.11), 261 (+2.46), 279 (+1.10), 301 (+2.15) nm; IR (film) νmax 3410 (br), 2953, 2927, 1722, 1703, 1631, 1604, 1517, 1445, 1389, 1263 1165, 820, 756 cm−1; 1H NMR (400 MHz, acetone-d6) data, see Table 1; 13C NMR (100 MHz, acetone-d6) data, see Table 2; HRESIMS m/z 425.1187 [M+Na]+ (calcd for C21H22O8Na, 425.1212).
Brevipolide E (5): colorless gum; [α]20D +10.0 (c 0.1, MeOH); UV (MeOH) λmax (log ε) 208 (1.22), 333 (1.07) nm; CD (c 1.1×10⁻⁵ M, MeOH) λmax (Δε) 230 (−0.95), 260 (+2.74), 280 (+0.99), 300 (+2.53) nm; IR (film) νmax 3390 (br), 3018, 2919, 2843, 1714, 1631, 1597, 1514, 1442, 1245, 1157, 816, 756 cm−1; 1H NMR (400 MHz, CD3OD) data, see Table 1; 13C NMR (100 MHz, CD3OD) data, see Table 2; HRESIMS m/z 467.1293 [M+Na]+ (calcd for C23H24O9Na, 467.1318).
Brevipolide F (6): colorless gum; [α]20D +7.0 (c 0.2, MeOH); CD (c 1.2×10⁻⁵ M, MeOH) λmax (Δε) 231 (−0.83), 261 (+1.94), 282 (+0.88), 301 (+1.83) nm; UV (MeOH) λmax (log ε) 210 (1.08), 316 (1.22) nm; IR (film) νmax 3397 (br), 3010, 2930, 1703, 1605, 1514, 1438, 1385, 1264, 1169, 1070, 1036, 816, 756 cm−1; 1H NMR (400 MHz, acetone-d6) data, see Table 1; 13C NMR (100 MHz, acetone-d6) data, see Table 2; HRESIMS m/z 409.1263 [M+Na]+ (calcd for C21H22O7Na, 409.1263).
Preparation of R- and S-MPTA Ester Derivatives of 3
Compound 3 (1.5 mg) was added to two NMR tubes each and was dried under a vacuum overnight. Deuterated pyridine (0.4 mL) was transferred to each tube under N2 flow, followed by injection of (S)-(+)-α-methoxy-α-(trifluoromethyl)phenylacetyl (MTPA) chloride (5 μL), or (R)-MTPA chloride (5 μL) to give the (R)-MTPA ester and the (S)-MTPA ester of 3, respectively. The tubes were stored overnight at room temperature to allow completion of reactions before NMR measurements.
R-MTPA Ester of 3: δ 6.75 (1H, m, H-3), 6.06 (1H, d, J = 9.9 Hz, H-2), 5.55 (1H, q, J = 7.0 Hz, H-11), 5.38 (1H, dd, J = 9.7, 2.7 Hz, H-6), 4.82 (1H, m, H-5), 2.77 (1H, m, H-9), 2.32 (2H, m, H-4), 2.13 (1H, m, H-7), 1.56 (3H, d, J = 7.0 Hz, H-12), 1.47 (1H, m, H-8), 1.45 (1H, m, H-8).
S-MTPA Ester of 3: δ 6.86 (1H, m, H-3), 6.12 (1H, dd, J = 9.7, 1.2 Hz, H-2), 5.51 (1H, q, J = 7.1 Hz, H-11), 5.39 (1H, dd, J = 8.8, 2.3 Hz, H-6), 4.93 (1H, dt, J = 12.0, 2.5, 2.5 Hz, H-5), 2.74 (1H, m, H-9), 2.52 (2H, m, H-4), 2.02 (1H, m, H-7), 1.56 (3H, d, J = 7.1 Hz, H-12), 1.41(1H, m, H-8), 1.34 (1H, m, H-8).
Cytotoxicity Assay
Cytotoxicity assays on extracts, chromatographic fractions and isolated compounds from H. brevipes were tested against MCF-7 human breast cancer cells, HT-29 human colon cancer cells, and Lu1 human lung cancer cells, using an established protocol.32
Proteasome Fraction Preparation and Proteasome Inhibition Assay
A proteasome fraction was prepared from a HL-60 human keukemic cell line as described previously.33,34 The assay buffer (50 mM Tris, pH 7.5, 25 mM KCl, 10 mM NaCl, 1 mM MgCl2, 0.03% SDS) was added to blank and control wells. Dilutions of the tested compounds were prepared in assay buffer and added to the appropriate wells. The enriched proteasome fraction was diluted to a final assay concentration of 4 μg/mL using assay buffer, and this dilution was then added to each well. The microtiter plates were then pre-incubated for 10 min at 37 °C to facilitate inhibitor-enzyme interactions. The enzyme reaction was initiated by adding substrate [N-succinyl-Leu-Leu-Val-Tyr-AMC (7-amino-4-methylcoumarin; abbreviated Suc-LLVY-AMC)] to a final concentration of 75 μM and fluorescence measurements commenced immediately. The chymotrypsin-like proteasome activity was determined by measuring the generation of free AMC using and excitation at a wavelength of 360 nm and detection of emitted light at 460 nm. The Suc-LLVY-AMC substrate was obtained from Biomol International (Plymouth Meeting, PA). The proteasome inhibitor bortezomib was used as positive control with an ED50 value of 2.5 nM.
Enzyme-based ELISA NF-κB Assay
The NF-κB assay was carried out according to an established protocol.35,36 In brief, a nuclear extract was prepared from Hela cells purchased from the American Type Culture Collection. An EZ-Detect™ Transcription Factor Assay System ELISA kit (Pierce Biotechnology, Rockford, IL) was used to assess the specific binding ability of activated NF-κB to the biotinylated-consensus sequence under the presence of tested compounds. The activity of the p50 subunit of NF-κB was measured by detecting the chemiluminescent signal in a Fluostar Optima plate reader (BMG Labtech Inc., Durham, NC). Rocaglamide was used as a positive control with an ED50 value of 2.0 μM in this assay.
Mitochondria Transmembrane Potential Assay (MTP Assay)
Changes on the mitochondria transmembrane potential were detected and quantified by a fluorescence cell-based assay. In brief, HT-29 cells cultured in black 96-well plates or black clear bottom 96-well plates at a density of 6 × 10⁴ were incubated overnight at 37 °C in a CO2 incubator. Cells were then treated with the test compounds or staurosporine (positive control, ED50 2.6 nM) for 2 h. Immediately afterwards, cells were incubated with the lipophilic cationic dye 5,5′,6,6′-tetrachloro-1,1′,3,3′-tetraethylbenzymidazolylcarbocyanide (JC-1) (Cayman Chemical Company, Ann Arbor, MI) for 30 min. After incubation, cells were washed with a wash buffer to remove unbound staining reagent. The clear bottom plates were then scanned with fluorescent imaging microscope (Axiovert 40 CFL, Carl Zeiss Microimaging, Inc., Thornwood, NY). Black 96-well plates were analyzed by a FLUOstar Optima fluorescence plate reader (BMG Labtech, Inc.) with an excitation wavelength of 485 nm and emission wavelength of 530 nm for JC-1 monomers and an excitation wavelength of 560 nm and emission wavelength of 595 nm for J-aggregates. Measurements were performed in duplicate and are representative of at least two independent experiments.25
Supplementary Material
Acknowledgments
This study was supported by grants U19 CA52956 and P01 CA125066 (P.I., A.D. Kinghorn) and P01 CA48112 (P.I., J.M. Pezzuto) from NCI, NIH. This research was also supported by Raymond W. Doskotch Graduate Fellowship Fund in Medicinal Chemistry and Pharmacognosy from The Ohio State University (to Y. Deng) and a Dean’s Scholar Award and University Fellowship from the University of Illinois at Chicago (to M. J. Balunas). We thank Mr. John Fowble, College of Pharmacy, The Ohio State University, for facilitating the acquisition of the 300 and 400 MHz NMR spectra.
Footnotes
Supporting Information Available: 1H and 13C NMR spectra of compounds 1 – 6, DEPT and 2D NMR spectra including 1H-1H COSY, HSQC, HMBC, and NOESY of compound 1, as well as 1H NMR spectra of R- and S-TPMA esters of compound 3. This material is available free-of-charge via the Internet at http://pubs.acs.org.
References and Notes
- 1.Fragoso-Serrano M, Gonzalez-Chimeo E, Pereda-Miranda R. J Nat Prod. 1999;62:45–50. doi: 10.1021/np980222z. [DOI] [PubMed] [Google Scholar]
- 2.Ohsaki A, Kishimoto Y, Isobe T, Fukuyama Y. Chem Pharm Bull. 2005;53:1577–1579. doi: 10.1248/cpb.53.1577. [DOI] [PubMed] [Google Scholar]
- 3.Pereda-Miranda R, Delgado G. J Nat Prod. 1990;53:182–185. [Google Scholar]
- 4.Novelo M, Cruz JG, Hernandez L, Pereda-Miranda R, Chai H, Mar W, Pezzuto JM. J Nat Prod. 1993;56:1728–1736. doi: 10.1021/np50100a011. [DOI] [PubMed] [Google Scholar]
- 5.Kuhnt M, Rimpler H, Heinrich M. Phytochemistry. 1994;36:485–489. [Google Scholar]
- 6.Pereda-Miranda R, Hernandez L, Villavicencio MJ, Novelo M, Ibarra P, Chai H, Pezzuto JM. J Nat Prod. 1993;56:583–593. doi: 10.1021/np50094a019. [DOI] [PubMed] [Google Scholar]
- 7.Boalino DM, Connolly JD, McLean S, Reynolds WF, Tinto WF. Phytochemistry. 2003;64:1303–1307. doi: 10.1016/j.phytochem.2003.08.017. [DOI] [PubMed] [Google Scholar]
- 8.Gupta MP, Monge A, Karikas GA, Lopez de Cerain A, Solis PN, de Leon E, Trujillo M, Suarez O, Wilson F, Montenegro G, Noriega Y, Santana AI, Correa M, Sanchez C. Int J Pharmacogn. 1996;34:19–27. [Google Scholar]
- 9.Goun E, Cunningham G, Chu D, Nguyen C, Miles D. Fitoterapia. 2003;76:592–596. doi: 10.1016/s0367-326x(03)00117-5. [DOI] [PubMed] [Google Scholar]
- 10.Kinghorn AD, Farnsworth NR, Soejarto DD, Cordell GA, Swanson SM, Pezzuto JM, Wani MC, Wall ME, Oberlies NH, Kroll DJ, Kramer RA, Rose WC, Vite GD, Fairchild CR, Peterson RW, Wild R. Pharm Biol. 2003;41(Suppl):53–67. [Google Scholar]
- 11.Kinghorn AD, Carcache-Blanco EJ, Chai H-B, Orjala J, Farnsworth NR, Soejarto DD, Oberlies NH, Wani MC, Kroll DJ, Pearce CJ, Swanson SM, Kramer RA, Rose WC, Emanuel S, Jarjoura D, Cope FO. Pure Appl Chem. 2009 doi: 10.1351/PAC-CON-08-10-16. in press. [DOI] [PMC free article] [PubMed] [Google Scholar]
- 12.Hegde VR, Pu H, Patel M, Das PR, Strizki J, Gullo VP, Chou CC, Buevich AV, Chan TM. Bioorg Med Chem Lett. 2004;14:5339–5342. doi: 10.1016/j.bmcl.2004.08.021. [DOI] [PubMed] [Google Scholar]
- 13.Faizi S, Ali M, Saleem R, Irfanullah, Bibi S. Magn Reson Chem. 2001;39:399–405. [Google Scholar]
- 14.Mahato SB, Pundu AP. Phytochemistry. 1994;37:1517–1575. [Google Scholar]
- 15.Matsuda H, Morikawa T, Toguchida I, Yoshikawa M. Chem Pharm Bull. 2002;50:788–795. doi: 10.1248/cpb.50.788. [DOI] [PubMed] [Google Scholar]
- 16.Skibinski A, Merfort I, Willuhn G. Phytochemistry. 1994;37:1635–1636. [Google Scholar]
- 17.Priestap HA, Bonafede JD, Ruveda E. Phytochemistry. 1977;16:1579–1582. [Google Scholar]
- 18.Adams J. Drug Discov Today. 2003;8:307–315. doi: 10.1016/s1359-6446(03)02647-3. [DOI] [PubMed] [Google Scholar]
- 19.Zavrski I, Kleeberg L, Kaiser M, Fleissner C, Heider U, Sterz J, Jakob C, Sezer O. Curr Pharm Des. 2007;13:471–485. doi: 10.2174/138161207780162908. [DOI] [PubMed] [Google Scholar]
- 20.Gilmore T, Gapuzan ME, Kalaitzidis D, Starczynowski D. Cancer Lett. 2002;181:1–9. doi: 10.1016/s0304-3835(01)00795-9. [DOI] [PubMed] [Google Scholar]
- 21.Andela VB. Curr Cancer Drug Targets. 2004;4:337–344. doi: 10.2174/1568009043332952. [DOI] [PubMed] [Google Scholar]
- 22.Basseres DS, Baldwin AS. Oncogene. 2006;25:6817–6830. doi: 10.1038/sj.onc.1209942. [DOI] [PubMed] [Google Scholar]
- 23.Fesik SW. Nat Rev Cancer. 2005:876–885. doi: 10.1038/nrc1736. [DOI] [PubMed] [Google Scholar]
- 24.Fulda S. Intl J Cancer. 2009;124:511–515. doi: 10.1002/ijc.24064. [DOI] [PubMed] [Google Scholar]
- 25.Salvioli S, Ardizzoni A, Franceschi C, Cossarizza A. FEBS Lett. 1997;411:77–82. doi: 10.1016/s0014-5793(97)00669-8. [DOI] [PubMed] [Google Scholar]
- 26.Wilberg KB, Barth DE, Schertler PH. J Org Chem. 1973;38:378–381. [Google Scholar]
- 27.Davies-Coleman MT, Rivett DEA. Phytochemistry. 1987;26:3047–3050. [Google Scholar]
- 28.Dale JA, Mosher HS. J Am Chem Soc. 1973;95:512–519. [Google Scholar]
- 29.Sullivan GR, Dale JA, Mosher HS. J Org Chem. 1973;38:2143–2147. [Google Scholar]
- 30.Seco JM, Quinoa E, Riguera R. Chem Rev. 2004;104:17–117. doi: 10.1021/cr2003344. [DOI] [PubMed] [Google Scholar]
- 31.Su BN, Park EJ, Mbwambo ZH, Santarsiero BD, Mesecar AD, Fong HHS, Pezzuto JM, Kinghorn AD. J Nat Prod. 2002;65:1278–1282. doi: 10.1021/np0202475. [DOI] [PubMed] [Google Scholar]
- 32.Seo EK, Kim NC, Mi Q, Chai H, Wall ME, Wani MC, Navarro HA, Burgess JP, Graham JG, Cabieses F, Tan GT, Farnsworth NR, Pezzuto JM, Kinghorn AD. J Nat Prod. 2001;64:1483–1485. doi: 10.1021/np0103158. [DOI] [PubMed] [Google Scholar]
- 33.Vinitsky A, Anton LC, Snyder HL, Orlowski M, Bennink JR, Yewdell JW. J Immunol. 1997;159:554–564. [PubMed] [Google Scholar]
- 34.Su BN, Hwang BY, Chai HB, Carcache-Blanco EJ, Kardono LBS, Afriastini JJ, Riswan S, Wild R, Laing N, Farnsworth NR, Cordell GA, Swanson SM, Kinghorn AD. J Nat Prod. 2004;67:1911–1914. doi: 10.1021/np040134g. [DOI] [PubMed] [Google Scholar]
- 35.Renard P, Ernest I, Houbion A, Art M, Le Calvez H, Raes M, Remacle J. Nucleic Acids Res. 2001;29:e21. doi: 10.1093/nar/29.4.e21. [DOI] [PMC free article] [PubMed] [Google Scholar]
- 36.Salim AA, Pawlus AD, Chai HB, Farnsworth NR, Kinghorn AD, Carcache-Blanco EJ. Bioorg Med Chem Lett. 2007;17:109–112. doi: 10.1016/j.bmcl.2006.09.084. [DOI] [PMC free article] [PubMed] [Google Scholar]
Associated Data
This section collects any data citations, data availability statements, or supplementary materials included in this article.