Abstract
Purpose
To examine changes in inner retinal function of nob2 mice, expressing a null mutation in Cacna1f encoding the CaV1.4 subunit of voltage-dependent calcium channels. CACNA1F mutations underlie one form of incomplete X-linked congenital stationary night blindness (CSNB2). In addition to a loss of dark-adapted (rod-driven) visual sensitivity, electroretinogram (ERG) b-waves and oscillatory potentials (OPs) are decreased in CSNB2 patients.
Methods
ERGs were recorded under dark-and light-adapted conditions from the corneal surface of nob2 mice, WT littermates and nob4 mice. ERG frequency spectra were calculated by fast Fourier transform (FFT). A FFT-based high-pass filter was used to derive OP waveforms.
Results
Under dark-adapted conditions, the dominant frequency of the OPs varied between 90 to 120 Hz in WT mice. In WT mice, OP frequency first increased with flash intensity and then decreased at the highest flash levels while overall OP amplitude increased monotonically with increasing flash intensity. In response to low stimulus flashes, reliable OPs were not obtained from nob2 mice. OPs were only seen at stimulus intensities at or above −1.8 log cd s/m2, where they occurred at a lower frequency range (70–90 Hz) than for WT mice. When flash stimuli were superimposed against a steady rod-desensitizing adapting field, the amplitude and frequency of WT OPs increased with flash intensity above 0.4 log cd s/m2. In comparison to WT results, cone-mediated OPs obtained from nob2 mice were smaller in amplitude, of lower frequency and had delayed implicit times. We compared the extent to which OPs and the b-wave were reduced in nob2 mice, by normalizing to the results obtained from WT mice. In comparison to the b-wave, the OPs were relatively spared, under both dark- and light-adapted conditions.
Conclusions
In nob2 mice, rod- and cone-driven OPs are reduced in amplitude and occur at a lower frequency range. Since CaV1.4 is expressed in both the inner and outer plexiform layers, these changes are likely to reflect reduced transmission from photoreceptors to bipolar cells as well as alterations in inner retinal function. That the OPs were better preserved than b-waves suggests that inner retinal pathways may be reorganized in response to the decreased bipolar cell response in nob2 mice.
Keywords: Oscillatory potentials, Electroretinogram, nob2, Mice, Frequency spectrum, Voltage dependent calcium channel
Introduction
The visual signal initiated by light capture in photoreceptor outer segments is transmitted centrally through the retina by neurons that use glutamate as an excitatory neurotransmitter. The release of glutamate by photoreceptors is highest in darkness [1], and light-activated hyperpolarization of photoreceptors reduces glutamate release secondary to an influx of calcium through voltage-dependent calcium channels (VDCCs) at the synaptic terminal [2]. This process is altered in several forms of human congenital stationary night blindness (CSNB) involving CACNA1F [3–6], CACNA2D4 [7] or CABP4 [8]. Given the importance of these proteins in regulating glutamate release, the human phenotypes are relatively homogeneous. They all have a marked loss of the electroretinogram (ERG) b-wave, reduced but not abolished rod-mediated sensitivity, and reduced visual acuity. Based on these observations, these disorders all fall within the incomplete CSNB category, as originally defined by Miyake et al. [9].
Mutant mice carrying homologous gene defects provide useful animal models for the study of many human disorders. With respect to incomplete CSNB, mouse models for Cacna1f [10, 11], Cacna2d4 [12, 13] and Cabp4 [14], can be used to better understand this class of retinal disorder. In the present study, we have examined nob2 mice, which have a naturally occurring loss-of-function mutation in the Cacna1f gene encoding the CaV1.4 subunit of VDCCs [11]. In comparison to control littermates, nob2 mice exhibit a reduced ERG b-wave, with little effect on the leading edge of the a-wave [11]. While the high frequency oscillatory potentials (OPs) appear to be reduced in amplitude, these have not been studied in detail. Nevertheless, immunohistochemical studies [15, 16] have demonstrated that CaV1.4 is localized to the OPL and to the IPL where the OPs are generated [17]. While the attenuated b-wave can be attributed to the loss of CaV1.4 in the OPL, the role of this channel in the IPL remains poorly understood and it is not clear how its absence would alter inner retinal function. Although it seems reasonable to predict that inner retinal function might be more severely compromised, the sensitivity of nob2 retinal ganglion cells is relatively normal under light-adapted conditions [11]. In the present study we examined nob2 OPs and compared their attenuation to that of the ERG b-wave.
Methods
Mice
ERGs were recorded from 13 nob2 mice, 9 wild type (WT) littermates and 4 nob4 mice, all on a C57BL/6J background. WT and nob2 mice were generated from breeders obtained from The Jackson Laboratory (Bar Harbor, ME). We obtained nob4 breeders from the mutagenesis program at Northwestern University [12]. We tested nob2 and WT mice at 7 weeks of age and nob4 mice at 10–15 weeks of age. All procedures involving mice were approved by the institutional animal care and use committee of the Cleveland Clinic Foundation.
Recording
After overnight dark adaptation, mice were anesthetized with a mixture of ketamine (80 mg/kg) and xylazine (16 mg/kg) diluted in saline. The pupils were dilated with eye drops (1% mydriacyl, 1% cyclopentolate HCl, 2.5% phenylephrine HCl) and the corneal surface was anesthetized with 0.5% proparacaine HCl eye drops. Mice were placed on a temperature-regulated heating pad during the ERG recording session.
ERGs were recorded using a stainless steel electrode that made contact with the center of corneal surface through a thin layer of 0.7% methylcellulose. Needle electrodes were subcutaneously inserted into the cheek and the tail as reference and ground leads, respectively. Under these conditions, mice usually develop reversible cataracts [18]. The ERG responses were differentially amplified (0.3–1,500 Hz), averaged and stored using a UTAS-E3000 Electrophysiology System (LKC Technologies, Gaithersburg, MD, USA). Responses were digitized at 1,024 Hz. The recording epoch was 500 ms, with a 180 ms pre-stimulation baseline. A notch filter was used during dark-adapted ERG recordings for nob2 and WT mice. The filter was not applied in dark-adapted ERG recording for nob4 mice, nor for any light-adapted recordings.
Stimulus flashes were presented in a LKC ganzfeld bowl. A total of ten stimulus intensities, ranging from −3.6 to 2.1 log cd s/m2, were used under dark-adapted conditions. Stimuli were presented in order of increasing intensity and at least 2 successive responses were averaged, except at the highest stimulus intensity where a single response was collected. As strobe flash intensity increased, retinal dark adaptation was maintained by increasing the interstimulus interval from 4.1 to 55.1 s. After the dark-adapted series were complete, a steady adapting field (1.5 log cd/m2) was presented inside the ganzfeld. After a 5 min light adaptation period [19], a total of 7 stimulus intensities ranging from −0.8 to 1.9 log cd s/m2 were superimposed against the adapting field. Cone ERGs were obtained to stimuli presented at 2.1 Hz and represent the average of responses to 50 successive stimulus flashes. The system was calibrated with a photometer equipped with a flash integrator.
Analysis
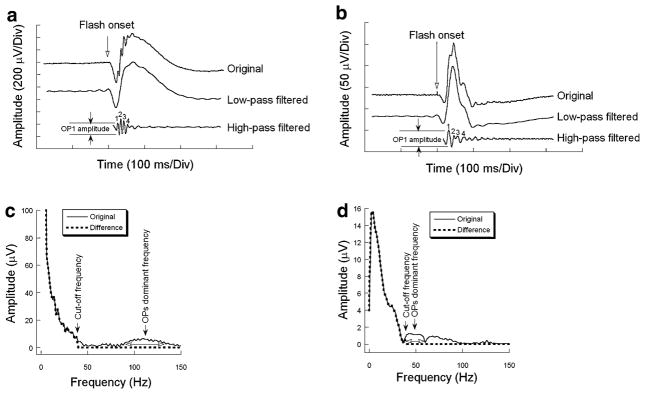
Figure 1a presents three versions of the same ERG signal under dark-adapted condition. The upper trace is the original ERG waveform. The middle trace is the waveform after filtering the frequency components higher than 38 Hz from the original ERG waveform. The lower trace is the waveform after filtering the frequency components lower than or equal to 38 Hz from the original ERG waveform, using a fast Fourier transform (FFT) and subsequent inverse FFT, implemented by an algorithm written in Matlab 6.1 (The MathWorks, Natick, MA, USA). To obtain the OP waveform in the time domain, the inverse FFT was performed with the frequency spectra after eliminating the components from 0 to a cut-off frequency. Figure 1b shows representative ERG waveforms recorded under light-adapted condition with the same processing. In Fig. 1a and b, the waveform remaining after eliminating the frequency components higher than 38 Hz is the same as the low frequency components (e.g. the a-wave and b-wave) in the original ERG waveform. In addition, the waveform after the high-pass filtering does not show a- or b-wave components. Therefore, a cut-off frequency of 38 Hz was chosen for analysis of both dark-adapted and light-adapted data. Figure 1c and d show the frequency spectra of the original ERG shown in Fig. 1a and b respectively, derived from FFT (thin continuous curve) and the difference between the original ERG and the filtered OP signal (thick dashed curve) which is zero above 38 Hz.
Fig. 1.
(a) Example of an original ERG waveform recorded from a WT mouse to 0.0 log cd s/m2 stimulus flash (upper trace), the remaining waveform after eliminating the frequency components higher than 38 Hz (middle trace), and the derived OP signal (lower trace) under dark-adapted condition. (b) Example of an ERG recorded from a WT mouse to 0.4 log cd s/m2 stimulus flash (upper trace) and the derived OP signal (lower trace) under light-adapted condition. (c) The frequency spectrum derived from the original waveform shown in (a) (thin continuous curve) and the difference of the frequency spectra between the original ERG and the filtered OP signal (thick dashed curve). Open arrows show the range for the intergration of power around the dominant frequency peak. (d) The frequency spectrum derived from the original waveform shown in (b) (thin continuous curve) and the difference of the frequency spectra between the original ERG and the filtered OP signal (thick dashed curve). Open arrows show the range for the intergration of power around the dominant frequency peak. Note that the amplitude axis truncates the low frequency region of this plot
Because the amplitudes of frequency components were relatively low in nob4 and nob2 mice, a Hamming window function was applied to the raw ERG signal before computing the FFT for filtering to reduce spectral leakage. The following equation defines the Hamming window function:
In this equation, N represents the number of acquired raw signal samples, i.e. the length, in samples, of a discrete-time window function, and n equals the sample index: 0, 1, 2, and so on up to N−1.
The 180 ms pre-stimulation baseline avoided the attenuation of the a- and b-waves by the Hamming window function. The filled arrow indicates the position of the dominant OP component, which was measured with respect to peak amplitude, integrated power within this peak, and peak frequency (Fig. 1c and d). Because the frequency distribution of OPs varied with stimulus intensity and between WT and nob2 mice, the frequency range for integrating power of OPs also varied accordingly. The frequency range of the peak was estimated according to its shape. On either side of the boundaries around the peak, the amplitude of the frequency component reached a minimum. This boundary is indicated by the open arrows in Fig. 1c and d.
Statistical comparison of WT and nob2 data was calculated using repeated-measures one-way analysis of variance (ANOVA). Because the standard error was not constant across all pairs of means, the degrees of freedom were adjusted by multiplying by the degrees of freedom of the Greenhouse-Geisser epsilon, and significance was adjusted accordingly.
Results
Frequency domain analysis
Dark-adapted OPs
Figure 2 presents a series of representative ERGs recorded from a WT mouse (left) and a nob2 littermate (right) to flash stimuli presented under dark-adapted conditions. In agreement with the original description [11], a-waves of nob2 mice appeared normal while the b-waves were markedly reduced in amplitude (Table 1). The OPs, which can be observed superimposed upon the rising limb of the b-wave, also appear to be reduced in nob2 mice.
Fig. 2.
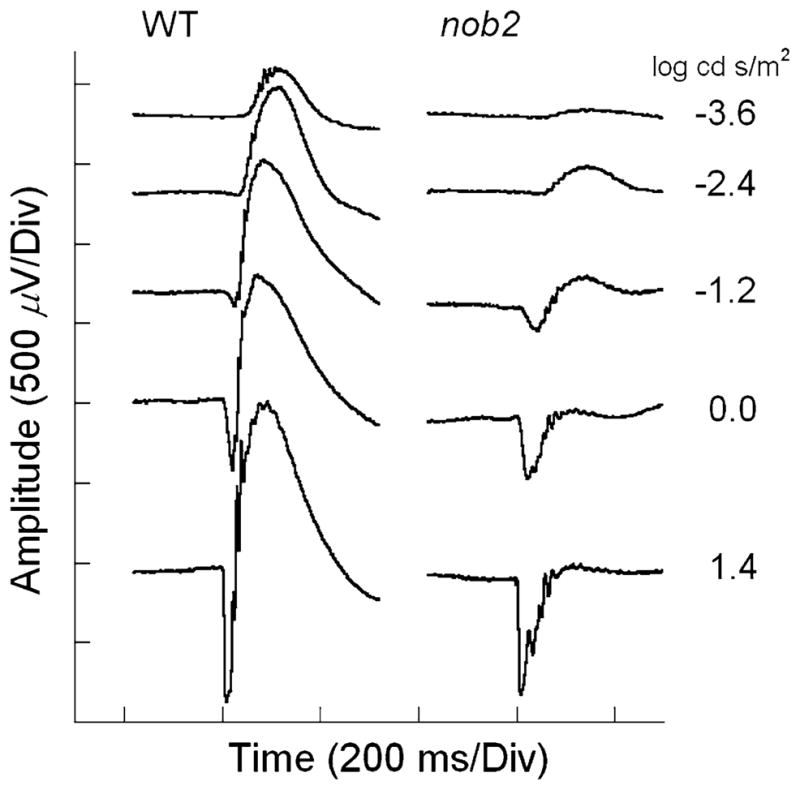
Representative dark-adapted ERGs recorded from WT (left) and nob2 (right) mice. Stimulus intensity is indicated to the right of each pair of waveforms
Table 1.
b-wave amplitude at selected stimulus intensities
| Intensity (log cd s/m2) | −3.6/DAa | −1.2/DA | 2.1/DA | −0.8/LAb | 0.9/LA | 1.9/LA |
|---|---|---|---|---|---|---|
| WT amplitude (μV) mean ± s.d. | 223 ± 122 | 542 ± 233 | 1,306 ± 461 | 11 ± 4 | 143 ± 42 | 348 ± 88 |
| nob2 amplitude (μV) mean ± s.d. | 32 ± 11 | 139 ± 63 | 594 ± 167 | 8 ± 2 | 52 ± 26 | 97 ± 44 |
| Ratio of nob2 to WT (%) | 14 | 26 | 45 | 76 | 36 | 28 |
DA: Dark-adapted conditions
LA: Light-adapted conditions
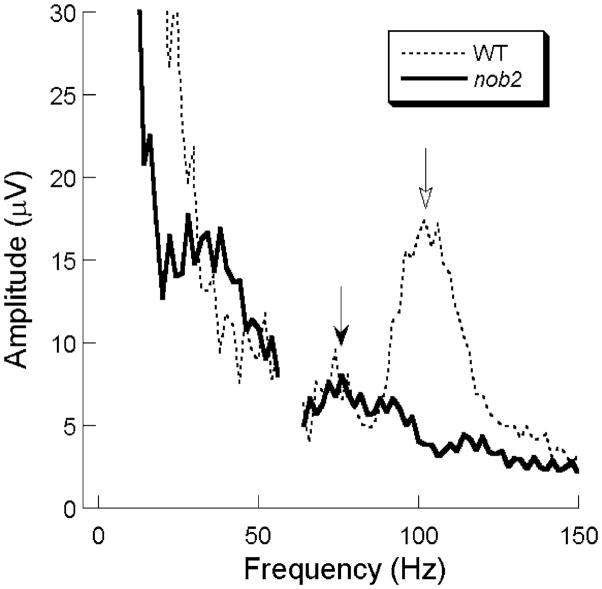
Figure 3 plots mean frequency spectra derived from FFT analysis of ERGs recorded from 9 WT and 13 nob2 mice in response to a high intensity (2.1 log cd s/m2) stimulus. Both spectra include a low frequency amplitude maximum, which likely corresponds to the low frequency ERG components. In WT mice, the FFT contained two distinct peaks, near 80 and 120 Hz, indicated by the filled and open arrows, respectively. In nob2 mice, the higher frequency peak was essentially absent in nob2 mice, while the lower frequency peak was retained. In comparison to WT mice, the location of this peak was shifted to a lower frequency in nob2 mice.
Fig. 3.
Average frequency spectra obtained to 2.1 log cd s/m2 stimuli presented to the dark-adapted eye for WT (dashed line) and nob2 (solid line) mice. Open arrow indicates the location of the dominant frequency peak in WT mice. Filled arrow indicates the dominant frequency peak present in nob2 mice. Note that the amplitude axis truncates the low frequency region of these plots, and the interfered data points from 58 to 62 Hz are eliminated
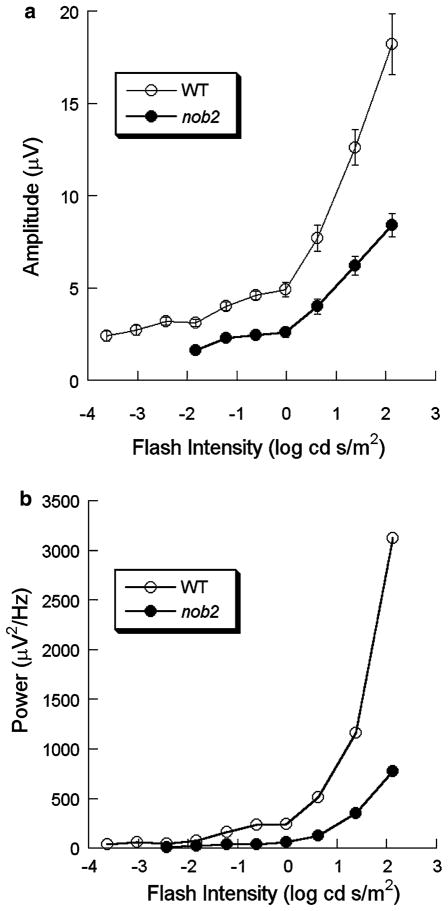
Figure 4 plots the amplitude of the dominant frequency component (Fig. 4a) and the integrated power around the dominant frequency peak (Fig. 4b) calculated from the grand averaged frequency spectrum as a function of stimulus intensity. At the lowest stimulus frequencies, a clear peak was not observed in any nob2 mouse studied, so neither of these measures could be derived. At higher stimulus intensities where a peak was observed in nob2 mice, the amplitude of this peak was always reduced in comparison to that of WT littermates (P < 0.002). In both WT and nob2 mice, both measures increased with increasing flash intensity. Repeated measures ANOVA shows that these increases were significant in WT and nob2 mice (P < 0.001 and P = 0.001, respectively).
Fig. 4.
Intensity-response functions for the amplitude (a) or the integrated power (b) of the maximum high frequency component for WT (○) and nob2 (●) mice derived from dark-adapted responses. Symbols indicate the mean ± SEM. The integrated powers were calculated from the averaged frequency spectra
Figure 5 plots the peak frequency as a function of stimulus intensity. In WT mice, the frequency peak varied with stimulus intensity in a non-monotonic fashion around 100 Hz (P < 0.001). Where measurable, the peak frequency was always lower in nob2 mice, and appeared to increase with increase stimulus intensity (P = 0.015). In both WT and nob2 mice, the maximum peak frequency was in the middle of the intensity range studied. In agreement with Lei et al. [20], peak frequencies of WT mice ranged from 90 to 120 Hz. Peak frequencies ranged from 72 to 88 Hz in nob2 mice.
Fig. 5.
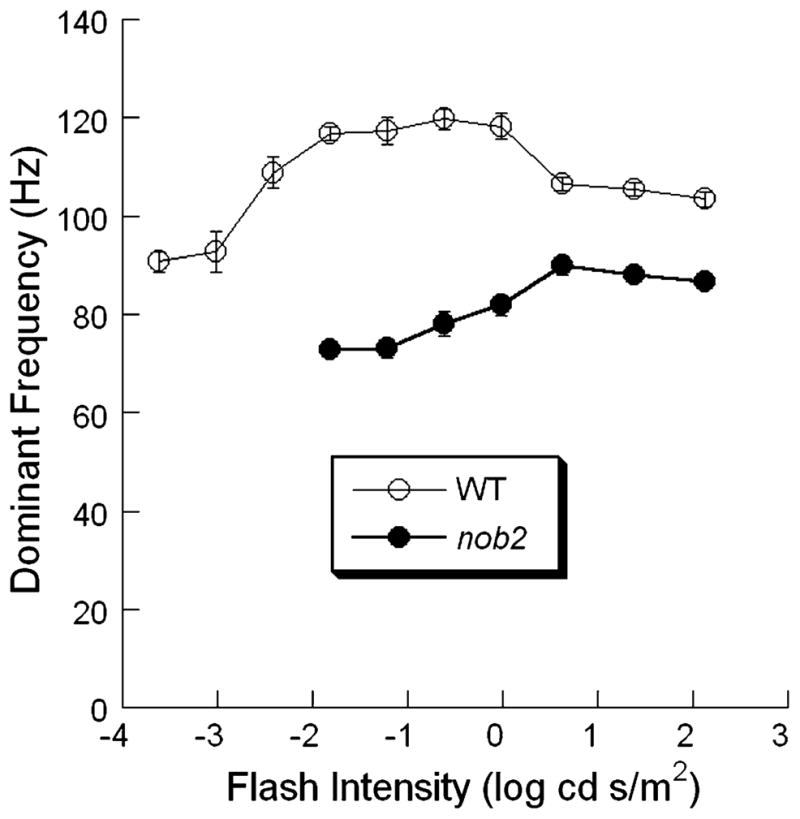
Intensity dependence of the peak of the high frequency band obtained to stimulus flashes presented to the dark-adapted eye of WT (○) and nob2 (●) mice. Data points indicate mean ± SEM
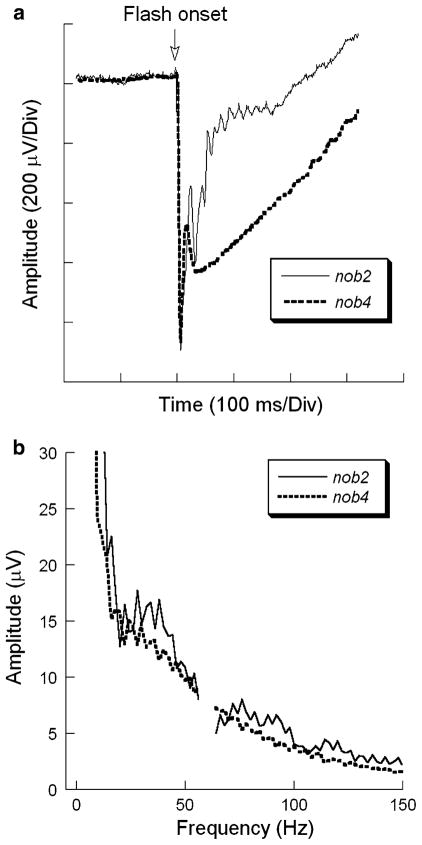
A shortcoming of an FFT-based analysis of a complex waveform such as the ERG is that the contributions of the a-wave, b-wave and OPs cannot be readily distinguished in the frequency domain. While previous studies of the human ERG have indicated that the higher frequency energy can be attributed to the OPs [21], it is not clear whether this applies to the mouse, where the OPs occur at lower frequencies than in primate [20]. In particular, it seems possible that the leading edge of the a-wave might contribute energy to the higher frequency peaks. To examine this question, we made recordings from the nob4 mouse, which has a normal amplitude a-wave but no b-wave or OPs [12]. As shown in Fig. 6a, the amplitude and kinetics of the a-wave were similar in nob2 and nob4 mice, while only the nob2 waveform included a b-wave and high frequency OPs. As shown in Fig. 6b, nob2 mice have higher amplitudes of frequency components around 30–50 Hz, 70–100 Hz and 110–125 Hz than nob4 mice. Taking these results together with the analysis shown in Fig. 1, we attribute the difference between the nob2 and nob4 frequency spectra to the contribution of OPs and/or b-wave of the nob2 waveform.
Fig. 6.
Comparison of nob2 and nob4 responses. (a) Representative ERGs obtained to 2.13 log cd s/m2 stimuli presented to the dark-adapted eyes of nob2 or nob4 mice. Note that the a-waves are similar in these two mutants, but that the b-wave and OPs are absent from the nob4 response. (b) Average frequency spectra for nob2 and nob4 mice to 2.1 log cd s/m2 stimulus flashes presented to the dark-adapted eye. Note that the amplitude axis truncates the low frequency region of these plots and the interfered data points from 58 to 62 Hz are eliminated
Light adapted OPs
Figure 7 presents a series of representative ERGs recorded from a WT mouse (left) and a nob2 littermate (right) to flash stimuli superimposed upon a steady rod desensitizing adapting field. As noted previously [11], cone ERGs of nob2 mice were substantially reduced in amplitude (Table 1). Despite this overall amplitude reduction, clear OPs could be observed in nob2 cone ERG waveforms.
Fig. 7.
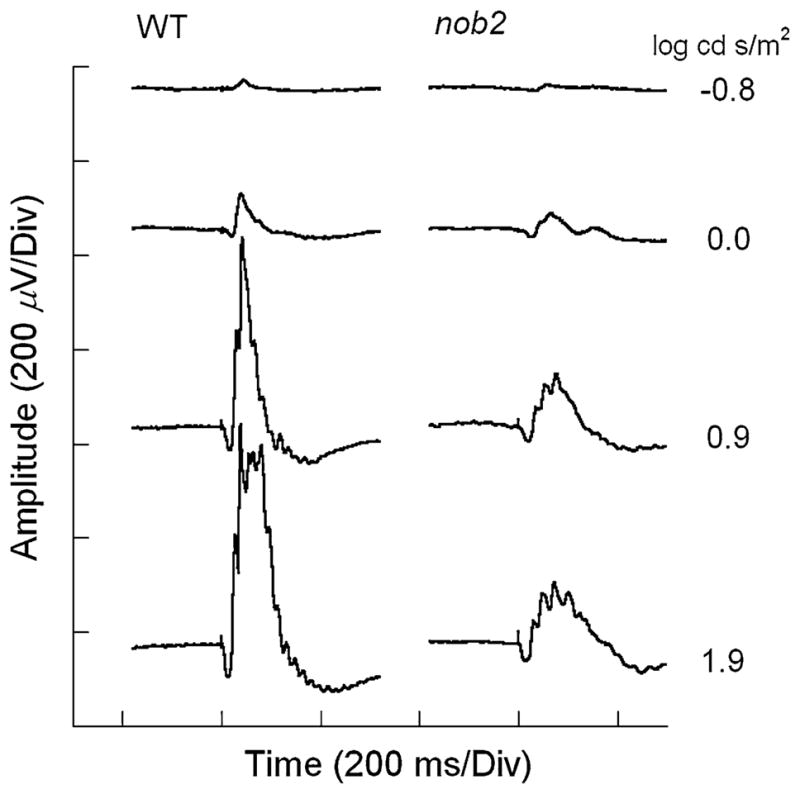
Representative light-adapted ERGs recorded from WT (left) and nob2 (right) mice. Stimulus intensity is indicated to the right of each pair of waveforms
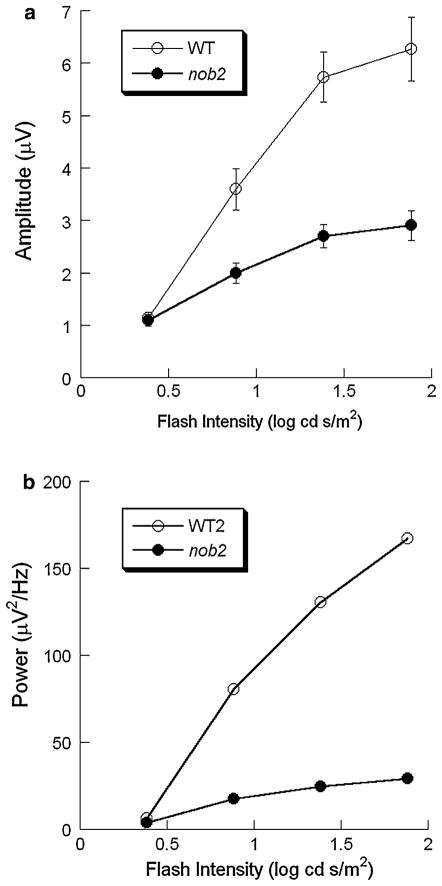
Figure 8 compares the frequency spectra for WT and nob2 ERGs obtained to a high intensity stimulus (1.9 log cd s/m2). As indicated by the open arrow, the WT spectrum included a distinct peak above 50 Hz, which was missing in the nob2 spectrum. There was, however, a smaller amplitude peak at ~40 Hz in the nob2 spectrum. Figure 9 plots intensity-response functions for the amplitude (Fig. 9a) and integrated power (Fig. 9b) calculated from the grand averaged frequency spectrum for WT and nob2 mice. Both measures increased with stimulus intensity. Repeated measures ANOVA shows that the increase of amplitude with intensity is significant in WT and nob2 mice (P < 0.001, respectively). Aside from the lowest stimulus condition, where comparable amplitudes were obtained in WT and nob2 mice, OPs were significantly smaller in nob2 mice (P = 0.001).
Fig. 8.
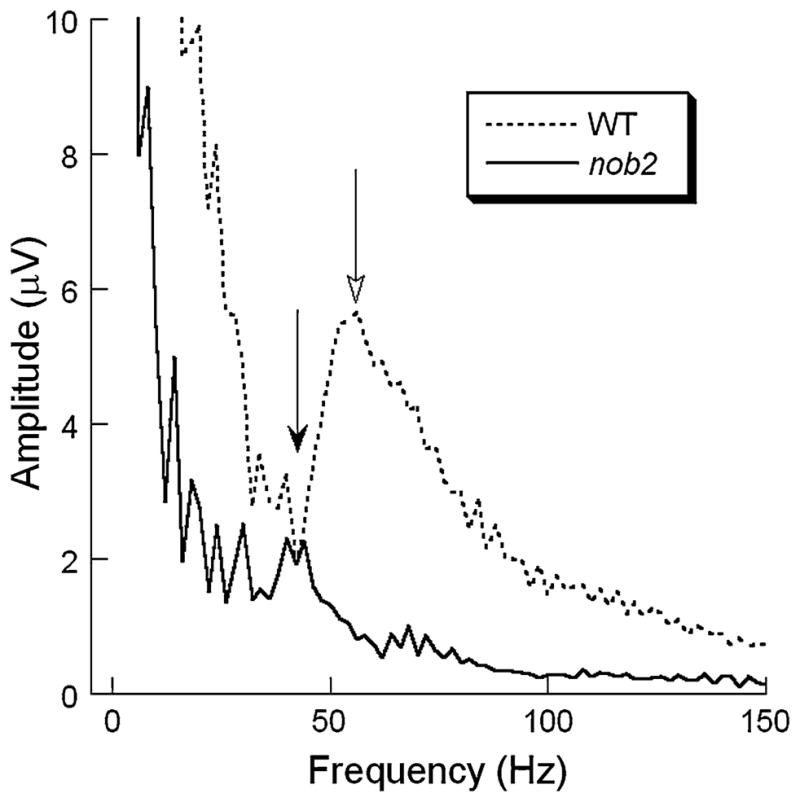
Average frequency spectra obtained to 1.9 log cd s/m2 stimuli superimposed on a rod-desensitizing adapting field for WT (dashed line) and nob2 (solid line) mice. Open arrow indicates the location of the dominant high frequency peak in WT mice. Filled arrow indicates the lower frequency peak in nob2 mice. Note that the amplitude axis truncates the low frequency region of these plots
Fig. 9.
Intensity-response functions for the amplitude (a) or the integrated power (b) of the maximum high frequency component for WT (○) and nob2 (●) mice derived from light-adapted responses. Data points indicate the mean ± SEM. The integrated powers were calculated from the averaged frequency spectra
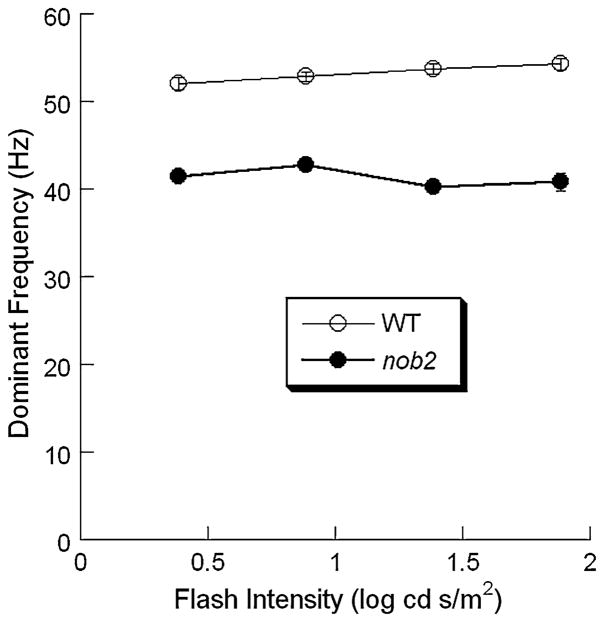
Figure 10 plots the frequency of the main high frequency component as a function of stimulus intensity for WT and nob2 mice. The peak frequency was consistently lower in nob2 mice than in WT mice (P < 0.001). The peak frequency increased significantly with stimulus intensity in WT mice (P = 0.036), while there was no significant change with stimulus intensity for nob2 mice (P = 0.143). Peak frequencies ranged from 52 to 54 Hz in WT mice and from 40 to 44 Hz in nob2 mice.
Fig. 10.
Intensity dependence of the peak of the high frequency band obtained to stimulus flashes superimposed upon a steady adapting field of WT (○) and nob2 (●) mice. Data points indicate mean ± SEM
Time domain analysis
Dark-adapted responses
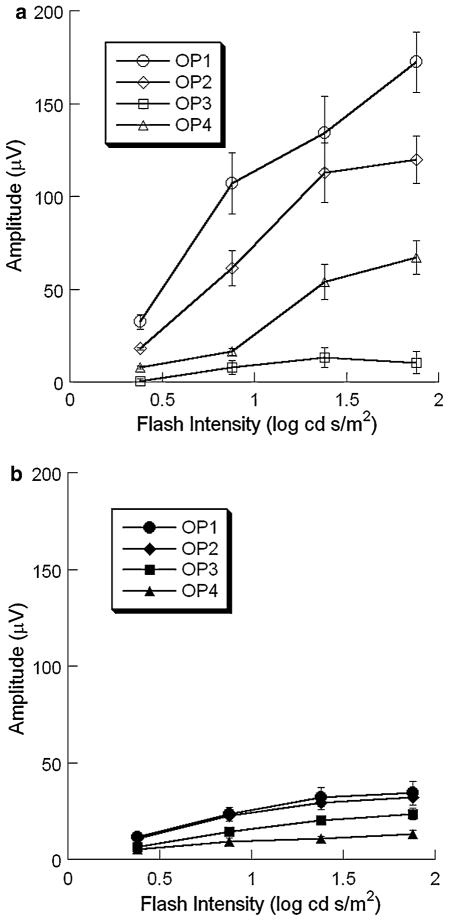
There is substantial evidence that individual OP wavelets may be generated independently [22, 23]. Since the FFT-based analysis used to this point treats the OPs as a unitary response, we also examined responses in the time domain, using high-pass filtering to isolate the higher frequency OPs from the larger amplitude a- and b-waves (Fig. 1a). In WT mice, four OP wavelets were consistently obtained under dark-adapted conditions. The amplitudes of OP1-OP3 increased with increasing stimulus intensity (Fig. 11a). In comparison to these earlier wavelets, the amplitude of OP4 was far less dependent on stimulus intensity, in both absolute and relative terms (Fig. 11a). A different pattern was noted in the OP wavelets obtained from nob2 mice (Fig. 11b). The increase of amplitude in OP1, OP2 and OP3 components with intensity was less marked than in WT mice, although OP1 still showed a sharp increase of amplitude with intensity in higher range of intensity.
Fig. 11.
Intensity-response functions for the amplitude of individual OP wavelets obtained from dark-adapted WT (a) and nob2 (b) mice of all OP wavelets obtained from WT (open symbols) and nob2 (filled symbols) mice. Data points indicate the mean ± SEM
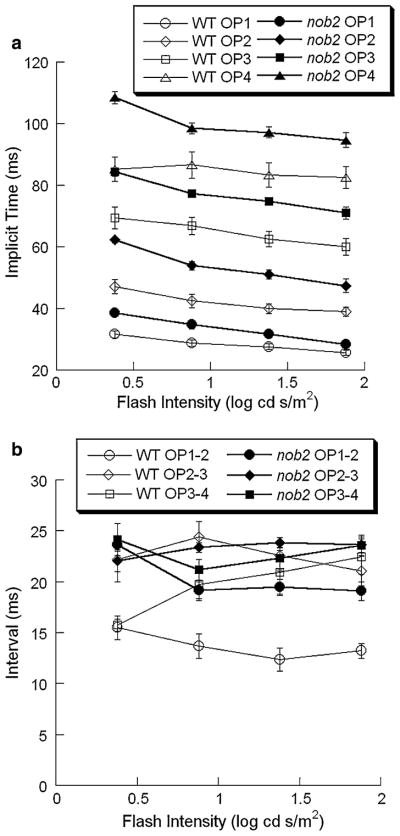
As shown in Fig. 12a, the implicit time (time to peak) of the individual OP wavelets decreased significantly with increasing stimulus intensity. This trend was apparent in the data from both WT and nob2 mice. When the implicit times of the OP wavelets were compared between WT and nob2 mice, they were consistently shorter in WT mice than in nob2 littermates (all P < 0.003).
Fig. 12.
Intensity-response functions for the implicit times of individual OP wavelets and the intervals between successive OP wavelets obtained from dark-adapted WT (open symbols) and nob2 (filled symbols) mice. Data points indicate the mean ± SEM. (a) Implicit times. (b) Intervals between successive OP wavelets
We also measured OP timing with respect to the interval between successive wavelets. Based on the lower dominant frequency noted in the frequency domain analysis, we expected that the interval between successive OP wavelets would be longer in nob2 mice. As shown in Fig. 12b, this trend is clearly seen and statistical analysis indicates that wavelet-wavelet intervals were shorter in WT than in nob2 mice (OP1-OP2: P < 0.001; OP2-OP3: P < 0.001; OP3-OP4: P < 0.04) although there was some overlap for the OP3-OP4 interval.
Light-adapted responses
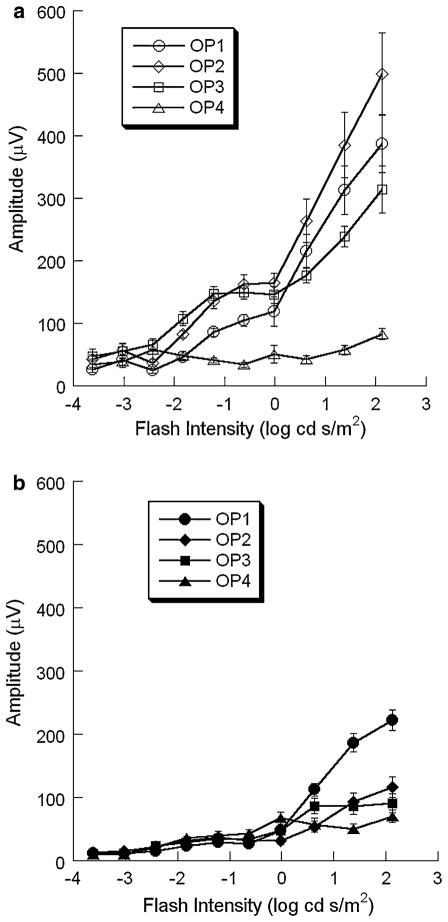
In WT mice, four OP wavelets were consistently obtained under light-adapted conditions. The amplitude of the first three OPs showed a clear increase with increasing stimulus intensity while OP4 was relatively stable across the intensity range examined (Fig. 13a). The amplitudes of OP1, OP2 and OP3 were smaller in nob2 mice than in WT littermates (Fig. 13b). In comparison to WT data, OP4 was not substantially reduced in nob2 mice (Fig. 13b).
Fig. 13.
Intensity-response functions for the amplitude of individual OP wavelets obtained from light-adapted WT (a) and nob2 (b) mice of all OP wavelets obtained from WT (open symbols) and nob2 (filled symbols) mice. Data points indicate the mean ± SEM
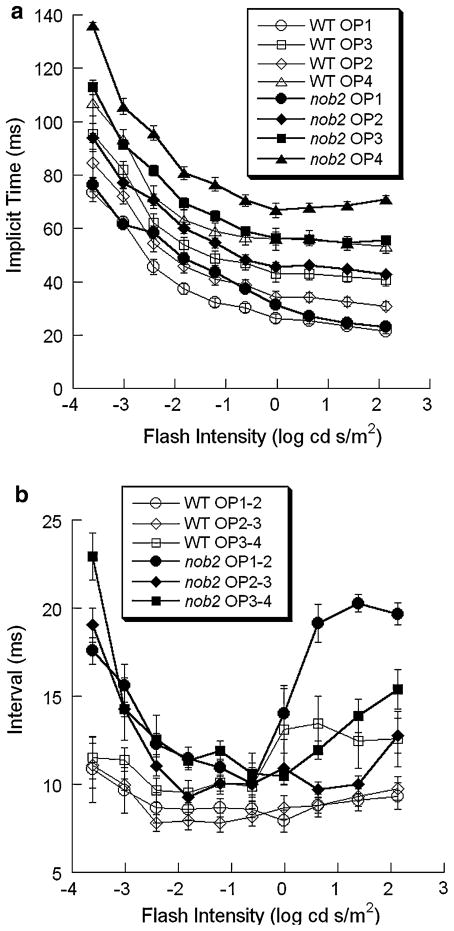
As shown in Fig. 14a, OP implicit times decreased with increasing stimulus intensity. In comparison to data obtained from WT mice, implicit times of the individual OP wavelets were consistently prolonged in nob2 animals (all P < 0.004).
Fig. 14.
Intensity-response functions for the implicit times of individual OP wavelets and the intervals between successive OP wavelets obtained from dark-adapted WT (open symbols) and nob2 (filled symbols) mice. Data points indicate the mean ± SEM. (a) Implicit times. (b) Intervals between successive OP wavelets
Figure 14b plots intensity-response functions for the intervals between successive OP wavelets. For both WT and nob2 mice, this measure did not change substantially across different stimulus intensities except OP3-OP4 interval in WT mice, which agrees with the stability of the frequency peak noted in Fig. 10. Although the OP1-OP2 interval was significantly shorter in WT than in nob2 mice (P < 0.001), there was no significant difference between WT and nob2 mice with respect to the OP2-OP3 or OP3-OP4 intervals.
Comparison of OP and b-wave reductions in nob2 mice
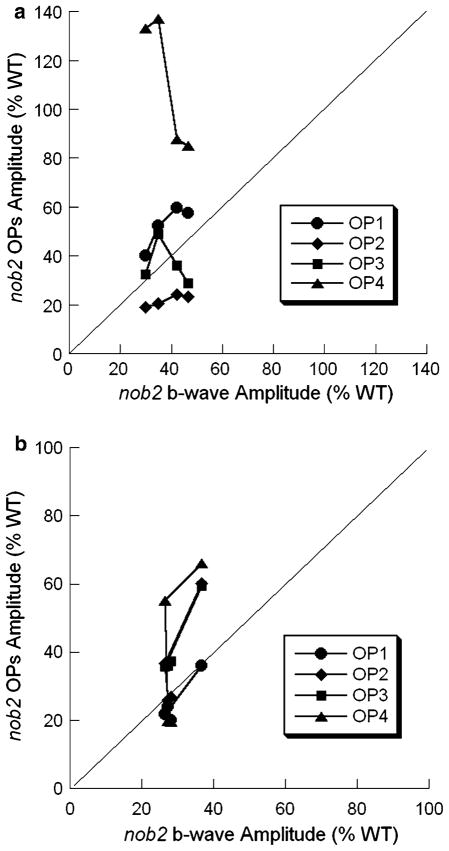
Figure 15 compares the relative changes of amplitude in the OPs and the b-waves of nob2 mice to WT mice in dark-adapted (Fig. 15a) and light-adapted (Fig. 15b) conditions. These panels plot the ratio of the average nob2 response relative to the average WT response. This analysis was done only at higher intensities, where the signal-to-noise ratio was larger. The diagonal line indicates an equivalent reduction in b-wave and OPs in nob2 mice. Under dark-adapted (Fig. 15a) and light-adapted (Fig. 15b) conditions, the data points fall on or above this diagonal, indicating that the OPs are either reduced in concert with the b-wave or are relatively spared. Despite evidence for expression of CaV1.4 in the inner plexiform layer [16, 17], there is no indication that the OPs are additionally affected, which would be indicated as points falling below the diagonal.
Fig. 15.
Comparison of the relative reductions b-wave and OP amplitudes of nob2 mice. Average nob2 data are expressed relative to the average WT response. Different symbols indicate the different OP wavelets. The diagonal line indicates an equivalent reduction of the ratio of amplitudes of b-wave and OPs between nob2 and WT mice in under different stimulus intensity. (a) Dark-adapted condition. (b) Light-adapted condition
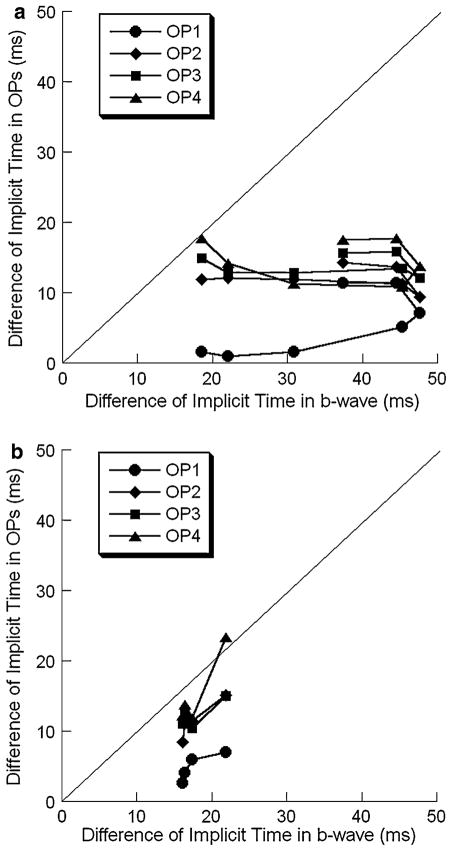
Figure 16 provides a similar analysis for the implicit times of the b-wave and OPs, for dark-adapted (Fig. 16a) and light-adapted (Fig. 16b) results. In this analysis, we have plotted implicit time delays of nob2 OPs against those of the corresponding nob2 b-waves. The diagonal indicates an equivalent delay in the implicit time of the nob2 b-wave and individual OP wavelets. Most data points fall below this diagonal, indicating that the implicit time of the b-wave is delayed to a greater extent than that of the OP wavelets.
Fig. 16.
Comparison of the difference of implicit time. (a) Dark-adapted condition. (b) Light-adapted condition
Discussion
The main finding of this study is that the OPs are reduced in nob2 mice. Although the cellular origins of the OPs are not completely known, there is little doubt that they arise in the inner retina. As a consequence, the OP reductions that we have observed are not unexpected since most input to the inner retina comes from bipolar cells. Given the b-wave reductions noted in nob2 mice [11], this input is likely to be attenuated. Nevertheless, it was interesting to note that the relative reduction in OP amplitude was less than that of the b-wave. The possibility of preserved inner retinal function in the nob2 inner retina finds support from studies of ganglion cell function, which retained normal sensitivity in nob2 mice [11]. Given the measurable defects in photoreceptor-to-bipolar cell communication associated with the loss of Cacna1f, these observations indicate that the nob2 inner retina may be reorganized in a manner that preserves sensitivity. How this might occur remains to be determined.
The overall kinetics of the OPs were also reduced in nob2 mice. Generally speaking, under both dark-and light-adapted conditions, OPs of nob2 mice had a lower peak frequency (Figs. 5 and 10), prolonged implicit times (Figs. 12a and 14a), and longer intervals between successive peaks (Figs. 12b and 14b). These delays may be secondary to the attenuation of the signal to bipolar cells from photoreceptors in the absence of CaV1.4. Given that CaV1.4 is expressed in the inner plexiform layer [16, 17], we cannot rule out the possibility that some component of these delays may originate in this retinal layer. These delays are not, however, secondary to delays in the b-wave. As shown in Fig. 16, b-wave delays were consistently greater than those of the individual OP wavelets.
The present results are consistent with a large body of data from a broad range of species that individual OP wavelets may have different generators. In the present case, we noted that the fourth wavelet in the OP complex was relatively unaffected by changes in stimulus intensity across a relatively large range. The individual OP wavelets have also been distinguished by their sensitivity to various compounds [24–29], their retinal depth profiles [25], their relation to stimulus onset and offset [30, 31] or timing [32], the duration of light adaptation [33] and their involvement in retinal disorders [34–37]. In view of the importance of the mouse in retinal research and as a model for human retinal disease it will be important to define the mechanisms underlying mouse OP generation.
Acknowledgments
This research was supported by the NEI (R01 EY14465; R24 EY15638), the Department of Veterans Affairs, a Challenge grant from Research to Prevent Blindness to the Department of Ophthalmology, Cleveland Clinic Lerner College of Medicine of Case Western Reserve University, and a State of Ohio BRTT grant. The authors are grateful to Jiang Wu for care of experimental mice.
Contributor Information
Minzhong Yu, Email: yum@ccf.org, Cole Eye Institute (I-31), Cleveland Clinic Foundation, 9500 Euclid Avenue, Cleveland, OH 44195, USA.
Neal S. Peachey, Cole Eye Institute (I-31), Cleveland Clinic Foundation, 9500 Euclid Avenue, Cleveland, OH 44195, USA. Cleveland VA Medical Center, Cleveland, OH, USA. Department of Ophthalmology, Cleveland Clinic Lerner College of Medicine of Case Western Reserve University, Cleveland, OH, USA
References
- 1.Copenhagen DR, Jahr CE. Release of endogenous excitatory amino acids from turtle photoreceptors. Nature. 1989;341:536–539. doi: 10.1038/341536a0. [DOI] [PubMed] [Google Scholar]
- 2.Schmitz Y, Witkovsky P. Dependence of photoreceptor glutamate release on a dihydropyridine-sensitive calcium channel. Neurosci. 1997;78:1209–1216. doi: 10.1016/s0306-4522(96)00678-1. [DOI] [PubMed] [Google Scholar]
- 3.Bech-Hansen NT, Naylor MJ, Maybaum TA, et al. Loss-of-function mutations in a calcium-channel α1-subunit gene in Xp11.23 cause incomplete X-linked congenital stationary night blindness. Nature Genet. 1998;19:264–267. doi: 10.1038/947. [DOI] [PubMed] [Google Scholar]
- 4.Strom TM, Nyakatura G, Apfelstedt-Sylla E, et al. An L-type calcium-channel gene mutated in incomplete X-linked congenital stationary night blindness. Nature Genet. 1998;19:260–263. doi: 10.1038/940. [DOI] [PubMed] [Google Scholar]
- 5.Boycott KM, Maybaum TA, Naylor MJ, et al. A summary of 20 CACNA1F mutations identified in 36 families with incomplete X-linked congenital stationary night blindness, and characterization of splice variants. Hum Genet. 2001;108:91–97. doi: 10.1007/s004390100461. [DOI] [PubMed] [Google Scholar]
- 6.Wutz K, Sauer C, Zrenner E, et al. Thirty distinct CACNA1F mutations in 33 families with incomplete type of XLCSNB and Cacna1f expression profiling in mouse retina. Eur J Hum Genet. 2002;10:449–456. doi: 10.1038/sj.ejhg.5200828. [DOI] [PubMed] [Google Scholar]
- 7.Wycisk KA, Zeitz C, Feil S, et al. Mutation in the auxiliary calcium-channel subunit CACNA2D4 causes autosomal recessive cone dystrophy. Am J Hum Genet. 2006;79:973–977. doi: 10.1086/508944. [DOI] [PMC free article] [PubMed] [Google Scholar]
- 8.Zeitz C, Kloeckener-Gruissem B, Forster U, et al. Mutations in CABP4, the gene encoding the Ca2+-binding protein 4, cause autosomal recessive night blindness. Am J Hum Genet. 2006;79:657–667. doi: 10.1086/508067. [DOI] [PMC free article] [PubMed] [Google Scholar]
- 9.Miyake Y, Yagasaki K, Horiguchi M, et al. Congenital stationary night blindness with negative electroretinogram. A new classification. Arch Ophthalmol. 1986;104:1013–1020. doi: 10.1001/archopht.1986.01050190071042. [DOI] [PubMed] [Google Scholar]
- 10.Mansergh F, Orton NC, Vessey JP, et al. Mutation of the calcium channel gene Cacna1f disrupts calcium signaling, synaptic transmission and cellular organization in mouse retina. Hum Mol Genet. 2005;14:3035–3046. doi: 10.1093/hmg/ddi336. [DOI] [PubMed] [Google Scholar]
- 11.Chang B, Heckenlively JR, Bayley PR, et al. The nob2 mouse, a null mutation in Cacna1f: anatomical and functional abnormalities in the outer retina and their consequences on ganglion cell visual responses. Vis Neurosci. 2006;23:11–24. doi: 10.1017/S095252380623102X. [DOI] [PMC free article] [PubMed] [Google Scholar]
- 12.Pinto LH, Vitaterna MH, Shimomura K, et al. Generation, identification and functional characterization of the nob4 mutation of Grm6 in the mouse. Vis Neurosci. 2007;24:111–123. doi: 10.1017/S0952523807070149. [DOI] [PMC free article] [PubMed] [Google Scholar]
- 13.Ruether K, Grosse J, Matthiessen E, et al. Abnormalities of the photoreceptor-bipolar cell synapse in a substrain of C57BL/10 mice. Invest Ophthalmol Vis Sci. 2000;41:4039–4047. [PubMed] [Google Scholar]
- 14.Wycisk KA, Budde B, Feil S, et al. Structural and functional abnormalities of retinal ribbon synapses due to Cacna2d4 mutation. Invest Ophthalmol Vis Sci. 2006;47:3523–3530. doi: 10.1167/iovs.06-0271. [DOI] [PubMed] [Google Scholar]
- 15.Haeseleer F, Imanishi Y, Maeda T, et al. Essential role of Ca2+-binding protein 4, a Cav1.4 channel regulator, in photoreceptor synaptic function. Nature Neurosci. 2004;7:1079–1087. doi: 10.1038/nn1320. [DOI] [PMC free article] [PubMed] [Google Scholar]
- 16.Morgans CW. Localization of the α1F calcium channel subunit in the rat retina. Invest Ophthalmol Vis Sci. 2001;42:2414–2418. [PubMed] [Google Scholar]
- 17.Ball SL, Powers PA, Shin HS, et al. Role of the β2 subunit of voltage-dependent calcium channels in the retinal outer plexiform layer. Invest Ophthalmol Vis Sci. 2002;43:1595–1603. [PubMed] [Google Scholar]
- 18.Ridder W, 3rd, Nusinowitz S, Heckenlively JR. Causes of cataract development in anesthetized mice. Exp Eye Res. 2002;75:365–370. doi: 10.1006/exer.2002.2007. [DOI] [PubMed] [Google Scholar]
- 19.Peachey NS, Goto Y, al-Ubaidi MR, et al. Properties of the mouse cone-mediated electroretinogram during light adaptation. Neurosci Lett. 1993;162:9–11. doi: 10.1016/0304-3940(93)90547-x. [DOI] [PubMed] [Google Scholar]
- 20.Lei B, Yao G, Zhang K, et al. Study of rod-and cone-driven oscillatory potentials in mice. Invest Ophthalmol Vis Sci. 2006;47:2732–2738. doi: 10.1167/iovs.05-1461. [DOI] [PubMed] [Google Scholar]
- 21.Gur M, Zeevi Y. Frequency-domain analysis of the human electroretinogram. J Opt Soc Amer. 1980;70:53–59. doi: 10.1364/josa.70.000053. [DOI] [PubMed] [Google Scholar]
- 22.Wachtmeister L. Oscillatory potentials in the retina: what do they reveal? Prog Retin Eye Res. 1998;17:485–521. doi: 10.1016/s1350-9462(98)00006-8. [DOI] [PubMed] [Google Scholar]
- 23.Dong CJ, Agey P, Hare WA. Origins of the electroretinogram oscillatory potentials in the rabbit retina. Vis Neurosci. 2004;21:533–543. doi: 10.1017/S0952523804214043. [DOI] [PubMed] [Google Scholar]
- 24.Gutierrez O, Spiguel RD. Oscillatory potentials of the cat retina: effects of adrenergic drugs. Life Sci. 1973;13:991–999. doi: 10.1016/0024-3205(73)90090-8. [DOI] [PubMed] [Google Scholar]
- 25.Wachtmeister L, Dowling JE. The oscillatory potentials of the mudpuppy retina. Invest Ophthalmol Vis Sci. 1978;17:1176–1188. [PubMed] [Google Scholar]
- 26.Wachtmeister L. Further studies of the chemical sensitivity of the oscillatory potentials of the electroretinogram (ERG) I. GABA-and glycine antagonists. Acta Ophthalmol (Copenh) 1980;58:712–725. doi: 10.1111/j.1755-3768.1980.tb06684.x. [DOI] [PubMed] [Google Scholar]
- 27.Wachtmeister L. Further studies of the chemical sensitivity of the oscillatory potentials of the electroretinogram (ERG). II. Glutamate-aspartate-and dopamine antagonists. Acta Ophthalmol (Copenh) 1981;59:247–258. doi: 10.1111/j.1755-3768.1981.tb02987.x. [DOI] [PubMed] [Google Scholar]
- 28.Wachtmeister L. Further studies of the chemical sensitivity of the oscillatory potentials of the electroretinogram (ERG). III. Some omega amino acids and ethanol. Acta Ophthalmol (Copenh) 1981;59:609–619. doi: 10.1111/j.1755-3768.1981.tb08349.x. [DOI] [PubMed] [Google Scholar]
- 29.Wachtmeister L. The action of opiates on the oscillatory potentials of the mudpuppy retina. Doc Ophthalmol Proc Series. 1983;37:317–323. [Google Scholar]
- 30.Kojima M, Zrenner E. Off-components in response to brief light flashes in the oscillatory potential of the human electroretinogram. Albrecht Von Graefes Arch Klin Exp Ophthalmol. 1978;206:107–120. doi: 10.1007/BF00414619. [DOI] [PubMed] [Google Scholar]
- 31.Alcayaga J, Bustamante S, Gutierrez OC. Fast activity and oscillatory potential of carp retina in the frequency domain. Vision Res. 1989;29:949–955. doi: 10.1016/0042-6989(89)90109-0. [DOI] [PubMed] [Google Scholar]
- 32.Lachapelle P. The effect of a slow flicker on the human photopic oscillatory potentials. Vision Res. 1991;31:1851–1857. doi: 10.1016/0042-6989(91)90179-9. [DOI] [PubMed] [Google Scholar]
- 33.Peachey NS, Alexander KR, Derlacki DJ, et al. Effects of light adaptation on the response characteristics of human oscillatory potentials. Electroencephalogr Clin Neurophysiol. 1991;78:27–34. doi: 10.1016/0013-4694(91)90015-v. [DOI] [PubMed] [Google Scholar]
- 34.Heckenlively JR, Martin DA, Rosenbaum AL. Loss of electroretinographic oscillatory potentials, optic atrophy, and dysplasia in congenital stationary night blindness. Am J Ophthalmol. 1983;96:526–534. doi: 10.1016/s0002-9394(14)77917-6. [DOI] [PubMed] [Google Scholar]
- 35.Lachapelle P, Little JM, Polomeno RC. The photopic electroretinogram in congenital stationary night blindness with myopia. Invest Ophthalmol Vis Sci. 1983;24:442–450. [PubMed] [Google Scholar]
- 36.Lachapelle P, Rousseau S, McKerral M, et al. Evidence supportive of a functional discrimination between photopic oscillatory potentials as revealed with cone and rod mediated retinopathies. Doc Ophthalmol. 1998;95:35–54. doi: 10.1023/a:1001784614333. [DOI] [PubMed] [Google Scholar]
- 37.Berson EL, Sandberg MA, Maguire A, et al. Electroretinograms in carriers of blue cone monochromatism. Am J Ophthalmol. 1986;102:254–261. doi: 10.1016/0002-9394(86)90154-6. [DOI] [PubMed] [Google Scholar]


