Abstract
Purpose of review
Diffusion tensor imaging (DTI) has a unique capability to delineate axonal tracts within the white matter, which has not been possible with previous noninvasive imaging techniques. In the past 10 years, we have witnessed a large increase in the use of DTI-based studies and a score of new anatomical knowledge and image analysis tools have been introduced in recent years. This review will provide an overview of the recent advancements in DTI-based studies and new image analysis tools.
Recent findings
DTI provided new dimensions for the characterization of white matter anatomy. This characterization of the white matter can be roughly divided into two categories. First, the white matter can be parcellated into constituent white matter tracts, based on pixel-by-pixel orientation and anisotropy information. Second, the DTI information can be extrapolated to obtain three-dimensional connectivity information. Based on these capabilities of DTI, many new image analysis tools are being developed to investigate the status of the white matter.
Summary
In the past, the white matter has often been treated as one compartment. With DTI and recently developed analysis tools, we can investigate the status of intra-white matter structures and deepen our understanding of white matter structures and their abnormalities under pathological conditions.
Keywords: atlas, diffusion tensor imaging, human brain, tractography, white matter
Introduction
Brain atlases have played an important role in many aspects of brain research by providing various types of anatomical information, such as brain structure names, locations, and boundaries. For neuroimaging, stereotaxic atlases have been especially useful, where a coordinate system (either through physical units, such as millimeters, or by relative units, such as one-eighth of the brain length) is employed to reference specific locations [1–5].
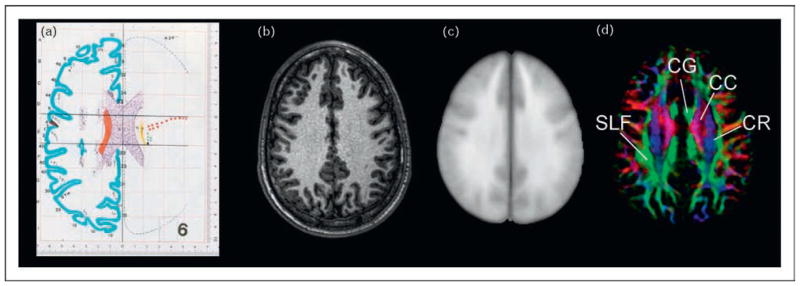
One of the most widely used stereotaxic atlases was provided by Talairach and Tournoux [1], as shown in Fig. 1a. This histology-based atlas contains a detailed assignment of cortical regions, which can be referenced by physical or relative coordinates. If one has a brain image (histology, MRI, PET, etc.), the image can be transformed to the shape of the atlas and the coordinate system, and anatomical labels of the atlas can be transferred to the image. For example, if the image contains a lesion, the location, as well as the affected anatomical structures, can be reported in a systematic way, which allows us to directly compare results from different patients.
Figure 1. Comparison of MR-based images and atlases.
(a) A section from the atlas by Talairach and Tournoux. (b) A T1-weighted MR image of one participant. (c) ICBM-152 images, which were created from the T1-weighted images of 152 normal participants. (d) Color-coded orientation map obtained from diffusion tensor imaging (DTI). CC, corpus callosum; CG, cingulum; CR, corona radiata; SLF, superior longitudinal fasciculus. Figure 1(a) was reproduced with permission from [1].
Recently, MRI-based atlases have become widely available [6,7•,8••,9,10•,11••,12]. There are many advantages of the MRI atlases. They are three-dimensional, with high anatomical fidelity (Fig. 1b). The data are inherently in an electronic format, which makes it much easier to perform various image analysis procedures quantitatively. MRI images also enable more straightforward population-based analysis, because MRI data can be obtained within 1 h. Figure 1c shows an example of a population-averaged atlas (ICBM-152), which represents the averaged brain structures of a normal population [6].
Although these atlases developed a systematic method for reporting and inter-participant comparison, they have been mostly used for studies of the gray matter structures and have not always been useful for white matter studies. This is because simple histology preparation and conventional MRI do not carry much contrast by which to delineate the detailed anatomy of the white matter. For example, the Talairach and Tournoux atlas shown in Fig. 1a does not demonstrate labeling of white matter structures as extensively as that of the cortex, and many white matter regions are blank, without annotations. In the MRI-based atlases, the white matter resembles a large homogeneous field and lacks anatomical clues.
In this review, white matter atlases based on diffusion tensor imaging (DTI) are evaluated [13,14••,15•,16•]. The new anatomical information provided by DTI is apparent in Fig. 1d. The homogeneous-looking white matter in Fig. 1a–c can be readily compartmentalized by adopting the contrasts from DTI. For example, the four major white matter structures at this slice level, the corpus callosum, the cingulum, the corona radiata, and the superior longitudinal fasciculus (SLF), can be easily defined.
Diffusion tensor imaging can provide unique contrasts to delineate white matter anatomy
DTI is a new type of MRI that can provide unique image contrast called ‘diffusion anisotropy’ [17]. MRI can measure the extent of water diffusion, that is, the random motion of water, along an arbitrary axis. From this measurement, it is often found that the water tends to diffuse along a preferential axis (called diffusion anisotropy), which has been shown to coincide with the orientation of ordered structures, such as axonal tracts. Based on the diffusion orientation of water molecules, this technique can provide several types of imaging contrast, such as anisotropy maps and orientation maps, or a combination of the two (Fig. 1d; called color-coded orientation maps or simply color maps hereafter). In the color map, the brightness shows the extent of the anisotropy and the color represents fiber orientation.
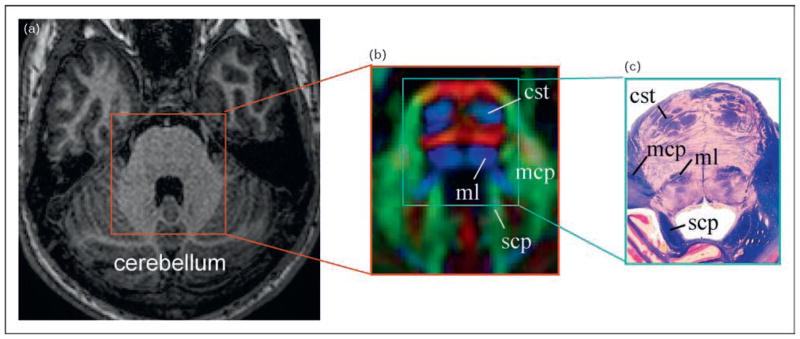
DTI has been applied to human brain studies and has been shown to provide unique information about white matter anatomy. In Fig. 2, a conventional T1-weighted image is compared to a color map from the same participant. It can be clearly seen that DTI provides much more anatomical information about the white matter.
Figure 2. Comparison of T1-weighted image with a color-coded orientation map and histology.
Comparison of conventional T1-weighted (a), diffusion tensor imaging (DTI) based orientation map (b), and histology (c) of the pons. White matter structures are well resolved in DTI and match well to the histology sample, whereas the pons look quite homogeneous in the T1-weighted image. (b) The red, green, and blue colors represent fibers running along the right–left, anterior–posterior, and inferior–superior orientations. cst, corticospinal tract; mcp, medium cerebellar peduncle; ml, medial leminiscus; scp, superior cerebellar peduncle. Figure 2(c) was reproduced with permission from The Human Brain, John Nolte, Elsevier.
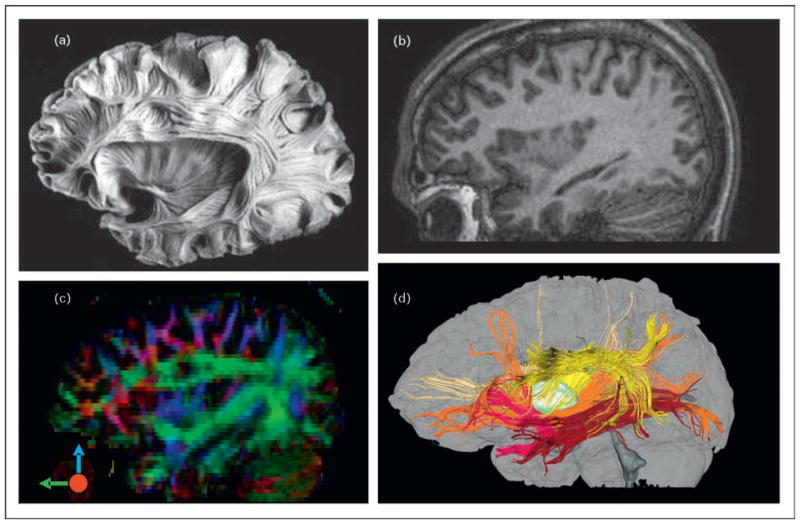
Once the fiber orientation is determined at each pixel, it is also possible to deduce three-dimensional tract trajectories based on a simple line propagation algorithm (Fig. 3) [18]. The overall configuration of reconstructed tracts agrees well with the postmortem human sample. DTI is the only technology that can provide orientation information about axonal tracts noninvasively. Thus, this method is becoming an important research and clinical tool.
Figure 3. Comparison of a postmortem human brain specimen, T1-weighted image, color-coded orientation map, and three-dimensional tract reconstruction.
Comparison of a postmortem human brain specimen (a), T1-weighted image (b), color-coded orientation map (c), and three-dimensional tract reconstruction (d). MRI images (b–d) are from the same participant. In the color map (c), the red, green, and blue represent fibers running along the right–left (perpendicular to the plane), anterior–posterior, and superior–inferior axes. In the three-dimensional reconstruction results (d), the yellow, brown, orange, and red fibers represent the superior and inferior longitudinal fasciculus, the inferior fronto-occipital fasciculus, and the uncinate fasciculus, respectively. Figure 3(a) was reproduced with permission from Atlas Cerebri Humani, Ludwig E, et al. S. Karger AG, Basel.
Two types of atlases of the white matter
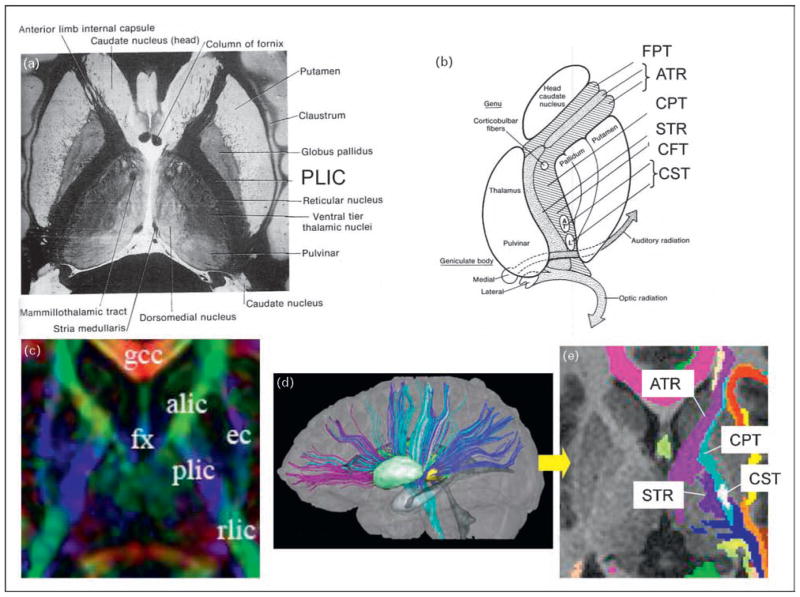
The white matter consists of axonal fibers that connect different regions of the brain. Axons that share similar destinations tend to form a large bundle, which is called a white matter tract. At the core and thickest regions of the tracts, they often form discrete bundles that are visually readily identifiable. This ‘wiring’ structure of the white matter poses a unique challenge for structural assignment and annotation. In many white matter atlases, white matter structures are defined based on local anatomical features [19] (Fig. 4). For example, the posterior limb of the internal capsule (PLIC) is defined by the white matter between the thalamus and the globus pallidus (Fig. 4a). If we call this type of structural assignment ‘location-based’, we can also define white matter structures using ‘connection-based’ or ‘tract-based’ notations (Fig. 4b). For example, the PLIC is known to contain axons that connect the thalamus and the cortex (the superior thalamic radiation), the cortex and the pons (corticopontine tract), and the cortex and the spinal cord (corticospinal tract). Because it is difficult to know the exact axonal connectivity of the human brain, the connection-based assignment derives mainly from past lesion studies or animal studies, which are far from comprehensive and often controversial.
Figure 4. Comparison between histology-based and diffusion tensor imaging-based white matter atlases.
(a) Classic ‘point and annotate’ (location-based) atlas of a human brain using a histology section. (b) Schematic diagram of white matter tract structures inside the internal capsule (connection-based atlas). Inside the posterior limb of the internal capsule (PLIC), there are several axonal tracts with different destinations, which include the superior thalamic radiation (STR), the corticopontine tract (CPT), the corticospinal tract (CST), and other corticofugal tracts (CFT; a generic description of all axons descending from the cortex, including the CPT and the CST). (c) A diffusion tensor imaging (DTI) version of the location-based point and annotate atlas similar to that in panel (a). In this image, the color represents pixel-by-pixel information about the fiber orientation: red, right–left; green, anterior–posterior; and blue, superior–inferior. (d) Three-dimensional reconstruction results from the white matter tracts penetrating the PLIC. (e) A connection-based atlas similar to that in panel (b). The color-coding represents the location at the given slice level of the anterior thalamic radiation (ATR), the CPT, the CST, and the STR, reconstructed in (d). The figures in (a) and (b) are reproduced with permission from [19].
White matter atlases created by diffusion tensor imaging
DTI is an excellent tool for constructing white matter atlases, which can provide contrasts that rival (Fig. 4c) or often surpass simple histological sections of human brains. Based on pixel-by-pixel fiber orientation information, multiple white matter tracts can be deciphered, which are otherwise difficult to define unless special histological techniques are employed (Fig. 3a). The three-dimensional tractography technique can also be used to reconstruct known white matter tracts (Figs 3d and 4d) and create connection-based annotations of the white matter (Fig. 4e).
To date, it has been demonstrated that we can create white matter atlases, using DTI, which carry anatomical information equivalent to past histology-based atlases. Although this would not provide us with new anatomical findings, there are many advantages to adopting DTI-based approaches. First, although DTI is known to have a certain degree of image distortion, this, to a large extent, can be corrected, and DTI has far greater anatomical fidelity than typical, fixed postmortem samples. Second, DTI images are three-dimensional and much more suitable for quantification of various anatomical parameters, such as volumes and shapes. The images are inherently in an electronic format, which would farther facilitate quantification. Third, the scan takes only several minutes, and thus, population-based studies are much easier. It is, therefore, understandable that DTI has opened up new frontiers for the creation of new white matter atlases.
Connection-based tract atlases
Tractography was introduced in the late 1990s, and is capable of creating three-dimensional trajectories of white matter tracts, as shown in Figs 3d and 4d. There are no other techniques that can produce equivalent anatomical information about the human brain, and, thus, tractography is a powerful method by which to investigate human white matter anatomy [20•,21••,22,23•,24•]. The advantage of the connection-based atlases that use tractography (Fig. 3d) over a histology-based atlas (Fig. 3a) is clear: a connection-based atlas allows virtual sections at any arbitrary place or angle. This type of atlas can visualize multiple tracts simultaneously and their three-dimensional trajectories can be viewed from any angle. However, connection-based atlases are also known to have many limitations and errors. As long as DTI is based on water motion averaged over large pixel sizes (2–2.5 mm), it is apparently an indirect indicator of actual axonal anatomy. Tractography results are difficult to validate in this way, and, therefore, many past publications are confined to the reconstruction of well known white matter bundles, using strong a-priori constraints, such that only the validated tracts are reconstructed. For those large and well documented bundles, this technique can reflect their macroscopic anatomy fairly accurately, as determined by qualitative comparison with histological preparation. Once reconstructed three dimensionally, with trajectories confirmed to agree with known pathways, the tractography-based tract atlases provide unsurpassed efficiency for understanding the tract anatomy because they illuminate convoluted trajectories and relationships with other brain structures. Recently, this approach has also increasingly been used for quantitative analyses to evaluate the pathological status of the white matter [25]. For example, after reconstruction, white matter volumes and MR properties (e.g. relaxation and diffusion parameters) along the path can be measured.
Location-based white matter atlases
To create location-based white matter atlases, there are two advantages to using DTI contrasts over histology or conventional MRI. First, as can be seen in Fig. 1d, the boundaries of many major white matter tracts are readily identifiable from color maps. This pixel-by-pixel fiber orientation information is truly unique and difficult to obtain, even with histology sections. The core regions of various white matter structures can be identified, annotated, and segmented using this contrast. On the contrary, assignment of superficial white matter areas that fill the spaces between the cortex and the deep white matter is not straightforward, even with the DTI contrasts. This is because the fiber orientation information becomes much more complicated, and variability among participants is large. To investigate the anatomy of such high-variability areas, population-based studies are necessary. The second advantage of DTI over histology is the efficiency and accuracy of performing such population-based studies [26••,27••,28••,29••].
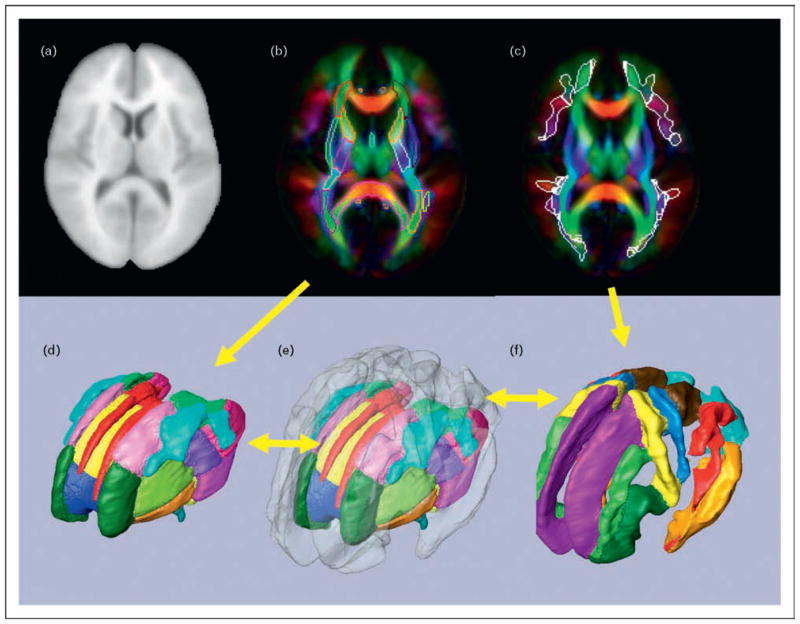
Figure 5 shows examples of DTI-based, population-averaged maps called ICBM-DTI-81 [28••]. These maps are co-registered to the widely used ICBM-152 atlas in the MNI space (Fig. 5a). The original atlas was created by averaging T1-weighted images from 152 normal subjects, after their brain shapes were linearly normalized (meaning the brain width, length, and height were equalized). The ICBM-DIT-81 atlas was similarly created by averaging DTI data from 81 participants. The DTI contrasts (Fig. 5b and c) clearly add far more anatomical information about the white matter to the ICBM-152 atlas. In Fig. 5b, many deep white matter structures can be clearly defined after the somewhat crude linear averaging process. This implies that the locations, shapes, and sizes of these structures are relatively reproducible among normal populations. These reproducible deep structures have been well characterized and their names assigned by past histology-based studies. Based on such knowledge, they can be defined as shown in Fig. 5b and d. Because the boundary definitions are mostly based on pixel-by-pixel contrasts, this process leads to the location-based atlases, representing the deep white matter anatomy of normal brains.
Figure 5. An example of a population-based atlas and parcellation of white matter structures that are reproducible among normal participants.
(a) ICBM-152 atlas created from the T1-weighted images of 152 normal participants. (b) ICBM-DTI-81 atlas created from the diffusion tensor imaging (DTI) of 81 normal participants. The core white matter structures are delineated manually. (c) Superficial white matter regions defined by probability (white lines). (d) Three-dimensional presentation of hand-segmented, core white matter structures. (e) Three-dimensional presentation of the entire white matter structure defined by 60% white matter probability. (f) Three-dimensional presentation of the superficial white matter structures.
What have not been well characterized in the past are the structures of the white matter regions close to the cortex. Using the population-averaged map, we can define a boundary between the cortex and the white matter based on the probability that it is white matter [29••]. The boundaries shown in Fig. 5c were defined by a 60% white matter probability in this population-averaged map. This type of operation can reveal the three-dimensional anatomy of the population-reproducible sections of the superficial white matter. For example, the yellow-colored structure in Fig. 5f is the white matter beneath the motor cortex. With the simple linear normalization method, the motor cortex and the central sulcus do not align well among participants. However, the white matter areas beneath the motor cortex can be defined clearly in the population-averaged maps. This type of anatomical definition aided by probability is unique and important information for use in developing brain atlases. One interesting idea is that brain registration can be more naturally performed by aligning white matter structures rather than cortical features. This is, however, an unproven hypothesis.
Applications of white matter atlases
There are many ways to use the MR-based three-dimensional atlases, in which various brain structures are defined. Figure 6 shows an example, in which there is a well defined lesion in the white matter. We often want a systematic means by which to report or quantify the lesion location for the study of, for instance, area-specific lesion frequency and correlation with functional outcome. A widely used approach is to normalize the brain into a template space, such as ICBM-152, MNI, and Talairach atlases, and use their coordinate system [30,31••,32••]. However, physical X, Y, and Z coordinate information about the brain does not directly carry anatomical meaning. If such atlases have co-registered segmentation maps, they can be superimposed on the normalized brains, as shown in Fig. 6b. This provides anatomical information to the coordinates. In this example, the lesion is inside the yellow-colored segment, which is the superficial white matter segment beneath the motor cortex.
Figure 6. An example of atlas application.
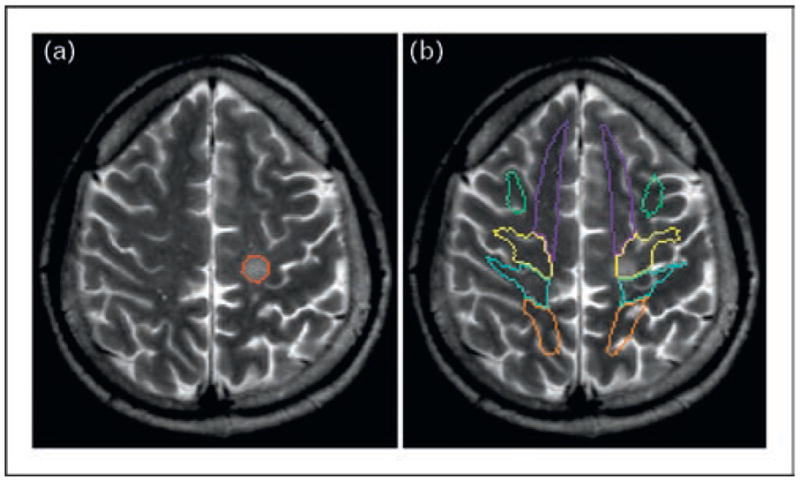
The image is from a multiple sclerosis patient with a lesion in the white matter, as indicated by the red line (a). After shape normalization, the segmentation atlas of the white matter is superimposed (b). This provides a systematic way to identify affected white matter structures.
This type of atlas application can also be considered an automated segmentation of the white matter [27••,33], as well as other regions of the brain [34••,35••,36•]. Once the white matter is segmented into each structural unit defined in the atlas, the size and various MR properties, such as relaxation and diffusion parameters, can be measured without resorting to manual delineation of regions of interest (ROI). The accuracy of the automated segmentation, however, depends on the quality of the brain normalization. For example, some segments shown in Fig. 6b contain the cortex and the CSF, which cause inaccuracies in size and MR parameter measurements. Therefore, results should be interpreted with great care.
Conclusion
The orientation-based contrasts provided by DTI give us new opportunities to define various white matter structures, which had been difficult to identify previously. One of the difficulties of structural definition is caused by anatomical variability. The introduction of population-based atlases is one way to characterize such variability and define structures based on probability. The atlas with specific white matter structures becomes a useful tool for the systematic and automated identification of the corresponding structures in each participant. This type of atlas development and application is still evolving and should provide new and useful tools for brain white matter studies.
Acknowledgments
The study was funded by the National Institutes of Health grants P41 RR015241, U24RR021382, PO1EB00195, and RO1AG20012.
References and recommended reading
Papers of particular interest, published within the annual period of review, have been highlighted as:
• of special interest
•• of outstanding interest
Additional references related to this topic can also be found in the Current World Literature section in this issue (pp. 439–440).
- 1.Talairach J, Tournoux P. 3-Dimensional proportional system: an approach to cerebral imaging. New York, NY: Thieme Medical; 1988. Co-planar stereotaxic atlas of the human brain. [Google Scholar]
- 2.Mazziotta JC, Toga AW, Evans A, et al. A probabilistic atlas of the human brain: theory and rationale for its development. The International Consortium for Brain Mapping (ICBM) Neuroimage. 1995;2:89–101. doi: 10.1006/nimg.1995.1012. [DOI] [PubMed] [Google Scholar]
- 3.Lancaster JL, Woldorff MG, Parsons LM, et al. Automated Talairach atlas labels for functional brain mapping. Hum Brain Mapp. 2000;10:120–131. doi: 10.1002/1097-0193(200007)10:3<120::AID-HBM30>3.0.CO;2-8. [DOI] [PMC free article] [PubMed] [Google Scholar]
- 4.Evans A, Collins DL, Milner B. An MRI-based stereotactic atlas from 250 young normal subjects. J Soc Neurosci Abstr. 1992;18:408. [Google Scholar]
- 5.Van Essen DC, Drury HA. Structural and functional analyses of human cerebral cortex using a surface-based atlas. J Neurosci. 1997;17:7079–7102. doi: 10.1523/JNEUROSCI.17-18-07079.1997. [DOI] [PMC free article] [PubMed] [Google Scholar]
- 6.Mazziotta J, Toga A, Evans A, et al. A probabilistic atlas and reference system for the human brain: International Consortium for Brain Mapping (ICBM) Philos Trans R Soc Lond B Biol Sci. 2001;356:1293–1322. doi: 10.1098/rstb.2001.0915. [DOI] [PMC free article] [PubMed] [Google Scholar]
- 7•.Zrinzo L, Zrinzo LV, Tisch S, et al. Stereotactic localization of the human pedunculopontine nucleus: atlas-based coordinates and validation of a magnetic resonance imaging protocol for direct localization. Brain. 2008;131:1588–1598. doi: 10.1093/brain/awn075. This paper introduced two MRI-based methods to localize the pedunculopontine nucleus, which is a promising new target for deep brain stimulation in Parkinson patients. A modified, proton-density, stereotactic magnetic resonance protocol was applied to provide high contrast between the gray and white matter in the pontomesencephalic region. [DOI] [PubMed] [Google Scholar]
- 8••.McLaren DG, Kosmatka KJ, Oakes TR, et al. A population-average MRI-based atlas collection of the rhesus macaque. Neuroimage. 2009;45:52–59. doi: 10.1016/j.neuroimage.2008.10.058. This is the first population-averaged, MRI-based atlas of the rhesus macaque brain in the standardized coordinate system. This atlas allows voxel-based and surface-based approaches that are common in human brain mapping studies to be applied to the rhesus macaque brain. [DOI] [PMC free article] [PubMed] [Google Scholar]
- 9.Ahsan RL, Allom R, Gousias IS, et al. Volumes, spatial extents and a probabilistic atlas of the human basal ganglia and thalamus. Neuroimage. 2007;38:261–270. doi: 10.1016/j.neuroimage.2007.06.004. [DOI] [PubMed] [Google Scholar]
- 10•.Yushkevich PA, Avants BB, Pluta J, et al. A high-resolution computational atlas of the human hippocampus from postmortem magnetic resonance imaging at 9.4 T. Neuroimage. 2009;44:385–398. doi: 10.1016/j.neuroimage.2008.08.04. This paper introduced a high-resolution human hippocampus atlas with sub-segmentation. This atlas is open to the public at http://www.nitrc.org/projects/pennhippoatlas/ [DOI] [PMC free article] [PubMed]
- 11••.Shattuck DW, Mirza M, Adisetiyo V, et al. Construction of a 3D probabilistic atlas of human cortical structures. Neuroimage. 2008;39:1064–1080. doi: 10.1016/j.neuroimage.2007.09.031. This atlas is one of the atlases provided by the International Cooperative Brain Mapping group. This MRI-based, 3D, probabilistic atlas of 56 gray matter structures from 40 normal volunteers is now available online at http://www.loni.ucla.edu/Atlases/LPBA40. [DOI] [PMC free article] [PubMed]
- 12.Kazemi K, Moghaddam HA, Grebe R, et al. A neonatal atlas template for spatial normalization of whole-brain magnetic resonance images of newborns: preliminary results. Neuroimage. 2007;37:463–473. doi: 10.1016/j.neuroimage.2007.05.004. [DOI] [PubMed] [Google Scholar]
- 13.Wakana S, Jiang H, Nagae-Poetscher LM, et al. Fiber tract-based atlas of human white matter anatomy. Radiology. 2004;230:77–87. doi: 10.1148/radiol.2301021640. [DOI] [PubMed] [Google Scholar]
- 14••.Van Hecke W, Sijbers J, D’Agostino E, et al. On the construction of an inter-subject diffusion tensor magnetic resonance atlas of the healthy human brain. Neuroimage. 2008;43:69–80. doi: 10.1016/j.neuroimage.2008.07.006. This paper compares the two methods that are widely used to create population-averaged atlases; one is the participant-based atlas, in which one participant is selected as an initial template to normalize other participants, and the other is the population-based atlas, in which deformation fields are calculated between all participants and the mean deformation field is applied to the corresponding datasets. The important feature of this paper is that the authors clearly demonstrated a method about how to evaluate a DTI template’s quality, which is not a straightforward task. [DOI] [PubMed] [Google Scholar]
- 15•.Catani M, Thiebaut de Schotten M. A diffusion tensor imaging tractography atlas for virtual in vivo dissections. Cortex. 2008;44:1105–1132. doi: 10.1016/j.cortex.2008.05.004. The authors created a three-dimensional tractography atlas for teaching and guiding virtual brain dissections. This could reduce tractography analysis time and operator-dependent biases. [DOI] [PubMed] [Google Scholar]
- 16•.Hagler DJ, Jr, Ahmadi ME, Kuperman J, et al. Automated white-matter tractography using a probabilistic diffusion tensor atlas: application to temporal lobe epilepsy. Hum Brain Mapp. 2009;30:1535–1547. doi: 10.1002/hbm.20619. The authors developed an atlas that contains most major fiber tracts, based on and validated with measurements from normal participants and patients with temporal lobe epilepsy. Implemented advances, such as the use of fiber orientation information to refine the fiber probability estimates, nonlinear registration, and a B0 distortion correction, resulted in an accurate automatic tool that promises to avoid the inconveniences of human interventions. [DOI] [PMC free article] [PubMed] [Google Scholar]
- 17.Basser PJ, Mattiello J, LeBihan D. Estimation of the effective self-diffusion tensor from the NMR spin echo. J Magn Reson B. 1994;103:247–254. doi: 10.1006/jmrb.1994.1037. [DOI] [PubMed] [Google Scholar]
- 18.Mori S, Van Zijl PC. Fiber tracking: principles and strategies – a technical review. NMR Biomed. 2002;15:468–480. doi: 10.1002/nbm.781. [DOI] [PubMed] [Google Scholar]
- 19.Parent A, Malcomb B. Carpenter’s human neuroanatomy. Philadelphia: Williams & Wilkins; 1996. [Google Scholar]
- 20•.Lawes IN, Barrick TR, Murugam V, et al. Atlas-based segmentation of white matter tracts of the human brain using diffusion tensor tractography and comparison with classical dissection. Neuroimage. 2008;39:62–79. doi: 10.1016/j.neuroimage.2007.06.041. This paper introduced the method of extracting fiber tracts based on their anatomical terminations near the gray matter–white matter boundary. The proposed method enables the assignment of anatomical labels for white matter regions where tracts might terminate. [DOI] [PubMed] [Google Scholar]
- 21••.Hua K, Zhang J, Wakana S, et al. Tract probability maps in stereotaxic spaces: analyses of white matter anatomy and tract-specific quantification. Neuroimage. 2008;39:336–347. doi: 10.1016/j.neuroimage.2007.07.053. The authors created a probabilistic map of 11 major white matter tracts. The agreement between the automated and the individual tractography-based results indicated the reliability of this method. This technique provides an automated way for initial screening of the white matter in different pathologies. [DOI] [PMC free article] [PubMed] [Google Scholar]
- 22.Jbabdi S, Woolrich MW, Andersson JL, Behrens TE. A Bayesian framework for global tractography. Neuroimage. 2007;37:116–129. doi: 10.1016/j.neuroimage.2007.04.039. [DOI] [PubMed] [Google Scholar]
- 23•.Zhang W, Olivi A, Hertig SJ, et al. Automated fiber tracking of human brain white matter using diffusion tensor imaging. Neuroimage. 2008;42:771–777. doi: 10.1016/j.neuroimage.2008.04.241. This paper provides an automated method for tracking a set of white matter tracts. Although only 11 tracts can be tracked, the authors demonstrated the robustness against distortions by tumors. [DOI] [PMC free article] [PubMed] [Google Scholar]
- 24•.Ciccarelli O, Catani M, Johansen-Berg H, et al. Diffusion-based tractography in neurological disorders: concepts, applications, and future developments. Lancet Neurol. 2008;7:715–727. doi: 10.1016/S1474-4422(08)70163-7. This is a review about tractography clinical applications, limitations, and future prospects. It establishes a general and realistic scenario of current, state-of-the-art tractography. [DOI] [PubMed] [Google Scholar]
- 25.Pagani E, Filippi M, Rocca MA, Horsfield MA. A method for obtaining tract-specific diffusion tensor MRI measurements in the presence of disease: application to patients with clinically isolated syndromes suggestive of multiple sclerosis. Neuroimage. 2005;26:258–265. doi: 10.1016/j.neuroimage.2005.01.008. [DOI] [PubMed] [Google Scholar]
- 26••.Yushkevich PA, Zhang H, Simon TJ, Gee JC. Structure-specific statistical mapping of white matter tracts. Neuroimage. 2008;41:448–461. doi: 10.1016/j.neuroimage.2008.01.013. This paper provides a method by which to average DTI data along anatomically meaningful directions, as opposed to uniform smoothing over the whole brain that is often employed in voxel-based analysis. This method uses directional information to discriminate the adjacent white matter tracts with similar fractional anisotropy, and the result can be directly interpreted as an alteration of the specific white matter tracts. [DOI] [PMC free article] [PubMed] [Google Scholar]
- 27••.Oishi K, Faria AV, Jiang H, et al. Atlas-based whole brain white matter analysis using large deformation diffeomorphic metric mapping: application to normal elderly and Alzheimer’s disease participants. Neuroimage. 2009;46:486–499. doi: 10.1016/j.neuroimage.2009.01.002. Normalization of DTI poses unique challenges. DTI data consists of tensor fields, which must be well registered after normalization. Conventional T1-weighted and T2-weighted images are not appropriate to drive the transformation, because these images lack contrasts inside the white matter area, which are necessary to register the corresponding anatomical structures. This paper provides a method to use multiple MR contrasts and optimally normalize white matter structures to a template space. [DOI] [PMC free article] [PubMed] [Google Scholar]
- 28••.Mori S, Oishi K, Jiang H, et al. Stereotaxic white matter atlas based on diffusion tensor imaging in an ICBM template. Neuroimage. 2008;40:570–582. doi: 10.1016/j.neuroimage.2007.12.035. This paper introduced a population-averaged, DTI-based human brain atlas in the ICBM space. This atlas can be used as a template to normalize DTI data to the ICBM space. A white matter parcellation map of the deep white matter area is also developed, which can be used for automated image segmentation. The atlas is available at http://www.mristudio.org. [DOI] [PMC free article] [PubMed]
- 29••.Oishi K, Zilles K, Amunts K, et al. Human brain white matter atlas: identification and assignment of common anatomical structures in superficial white matter. Neuroimage. 2008;43:447–457. doi: 10.1016/j.neuroimage.2008.07.009. This paper describes the anatomy of the superficially located white matter (SWM). Using a probabilistic white matter map, the SWM is divided into nine areas, termed ‘blades’. Four corticocortical fiber connections between blades were identified by tractography. These newly defined SWM areas can be used for automated white matter segmentation. [DOI] [PMC free article] [PubMed] [Google Scholar]
- 30.Smith SM, Johansen-Berg H, Jenkinson M, et al. Acquisition and voxelwise analysis of multisubject diffusion data with tract-based spatial statistics. Nat Protoc. 2007;2:499–503. doi: 10.1038/nprot.2007.45. [DOI] [PubMed] [Google Scholar]
- 31••.Chakravarty MM, Sadikot AF, Germann J, et al. Towards a validation of atlas warping techniques. Med Image Anal. 2008;12:713–726. doi: 10.1016/j.media.2008.04.003. The authors compared three different warping techniques using a digital atlas of the basal ganglia and thalamus, validating the results with manual segmentation and intra-operative thalamic stimulations. These results may have important implications for guided functional neurosurgery. [DOI] [PubMed] [Google Scholar]
- 32••.Klein A, Andersson J, Ardekani BA, et al. Evaluation of 14 nonlinear deformation algorithms applied to human brain MRI registration. Neuroimage. 2009;46:786–802. doi: 10.1016/j.neuroimage.2008.12.037. This study evaluates the registration quality provided by nonlinear registration methods. The algorithms were ranked according to different types of independent analysis. [DOI] [PMC free article] [PubMed] [Google Scholar]
- 33.O’Donnell LJ, Westin CF. Automatic tractography segmentation using a high-dimensional white matter atlas. IEEE Trans Med Imaging. 2007;26:1562–1575. doi: 10.1109/TMI.2007.906785. [DOI] [PubMed] [Google Scholar]
- 34••.Bazin PL, Pham DL. Homeomorphic brain image segmentation with topological and statistical atlases. Med Image Anal. 2008;12:616–625. doi: 10.1016/j.media.2008.06.008. The authors propose and validate a new segmentation technique based on a topological and statistical alas of the human brain. Advantages of this algorithm, freely available at http://mipav.cit.nih.gov/, are the negligible influence of the atlas choice and the possibility of multimodal and further image analysis. [DOI] [PMC free article] [PubMed]
- 35••.Jovicich J, Czanner S, Han X, et al. MRI-derived measurements of human subcortical, ventricular and intracranial brain volumes: reliability effects of scan sessions, acquisition sequences, data analyses, scanner upgrade, scanner vendors and field strengths. Neuroimage. 2009;46:177–192. doi: 10.1016/j.neuroimage.2009.02.010. The authors assess the impact of many instrument-related factors in MRI volume measurements. Knowledge of reproducibility is particularly important for the design and interpretation of longitudinal and multisite studies. [DOI] [PMC free article] [PubMed] [Google Scholar]
- 36•.Chupin M, Hammers A, Liu RS, et al. Automatic segmentation of the hippocampus and the amygdala driven by hybrid constraints: method and validation. Neuroimage. 2009;46:749–761. doi: 10.1016/j.neuroimage.2009.02.013. The authors associate anatomical knowledge with probabilistic maps in this new method for automatic segmentation. One of its advantages is that exact registration is not necessary, as segmentation is not directly derived from the atlas. [DOI] [PMC free article] [PubMed] [Google Scholar]


