

Abstract
Purpose
Few studies have examined employee turnover and associated costs in emergency medical services (EMS). The purpose of this study was to quantify the mean annual rate of turnover, total median cost of turnover, and median cost per termination in a diverse sample of EMS agencies.
Methods
A convenience sample of 40 EMS agencies was followed over a 6 month period. Internet, telephone, and on-site data collection methods were used to document terminations, new hires, open positions, and costs associated with turnover. The cost associated with turnover was calculated based on a modified version of the Nursing Turnover Cost Calculation Methodology (NTCCM). The NTCCM identified direct and indirect costs through a series of questions that agency administrators answered monthly during the study period. A previously tested measure of turnover to calculate the mean annual rate of turnover was used. All calculations were weighted by the size of the EMS agency roster. The mean annual rate of turnover, total median cost of turnover, and median cost per termination were determined for 3 categories of agency staff mix: all paid staff, mix of paid and volunteer (mixed), and all-volunteer.
Results
The overall weighted mean annual rate of turnover was 10.7%. This rate varied slightly across agency staffing mix: (all-paid=10.2%, mixed=12.3%, all-volunteer=12.4%). Among agencies that experienced turnover (n=25), the weighted median cost of turnover was $71,613.75, which varied across agency staffing mix: (all-paid=$86,452.05, mixed=$9,766.65, and all-volunteer=$0). The weighted median cost per termination was $6,871.51 and varied across agency staffing mix: (all-paid=$7,161.38, mixed=$1,409.64, and all-volunteer=$0).
Conclusions
Annual rates of turnover and costs associated with turnover vary widely across types of EMS agencies. The study’s mean annual rate of turnover was lower than expected based on information appearing in the news media and EMS trade magazines. Findings provide estimates of two key workforce measures – turnover rates and costs – where previously none have existed. Local EMS directors and policymakers at all levels of government may find the results and study methodology useful towards designing and evaluating programs targeting the EMS workforce.
Keywords: emergency medical services, turnover, cost of turnover, longitudinal study
Introduction
Recruitment and retention are two of the most salient issues in Emergency Medical Services (EMS) today. Reports of inadequate staffing in EMS agencies appear frequently in the local news media.1–7 The National Association of State EMS Officials, a group formed in 1980 to represent state and regional EMS leaders, has twice identified recruitment and retention as the most important issues facing rural EMS agencies across the nation.8, 9 Prominent organizations such as the National Council of State Legislators and the National Rural Health Association have also expressed concern for the viability of our nation’s EMS workforce.10–12 Despite widespread concern and recent federal initiatives (e.g., the Workforce Project led by the National Highway Traffic Safety Administration and EMS Grant Component of the Critical Access Hospital Program), we have an imperfect understanding of these problems on a national scale, as research on EMS recruitment and retention is limited.
In fact, we identified only one peer-reviewed study that characterized the magnitude of EMS recruitment and retention issue nationally from the local EMS director perspective. In this cross-sectional survey of local EMS agency directors, Freeman and colleagues determined that approximately half of all agencies surveyed were not fully staffed; 37% of directors said recruitment was always a problem, and 55% reported difficulty with retention.6 This study showed that EMS director reported problems with recruitment and retention were more common in rural versus urban areas. In a recent non-peer reviewed study supported by the Journal of Emergency Medical Services, it was reported that approximately 15% of full-time, 23% of part-time, and 18% of volunteer EMS workers leave their jobs annually.13 This study was cross-sectional in nature with an overall response rate of 13%. Our understanding of turnover in EMS is limited to a narrow body of research and information.
The primary objective of the study presented here was to provide more comprehensive information on the EMS workforce by quantifying the annual rate of turnover in EMS using a longitudinal study design and nationwide sample of EMS agencies. We also quantify the costs associated with EMS turnover using a modified version of the Nursing Turnover Cost Calculation Methodology (NTCCM).14, 15
Methods
We used a mixed methods approach and drew from multiple sources of EMS agency and individual data to develop an in-depth descriptive picture of turnover and associated costs in EMS. We used a stratified random sampling procedure to recruit a diverse sample of EMS agencies. Next, we used a longitudinal observational study design to capture information related to turnover and costs associated with turnover. Finally, we used the comparative method to present our findings.16 The comparative method is widely used in the analysis of policy relevant issues, and is the preferred method for studies comparing a small yet diverse sample of observations using a limited set of statistics (e.g. descriptive statistics).16 We compared findings across categories of EMS agency staffing mix (i.e., all paid staff, a mix of paid and volunteer staff, or all-volunteer). This study was approved by the University of Pittsburgh Institutional Review Board.
Study Sample
A list of EMS agencies was created from two sources: 1) the Commonwealth of Pennsylvania Office of EMS list of licensed EMS agencies, and 2) a non-profit EMS purchasing cooperative with 1,000 member agencies in 26 states. This list of approximately 2,000 EMS agencies was stratified by rural and urban status based on the Rural Urban Commuting Area (RUCA) designation.17 We assigned each agency a unique ID# using a random number generator in SAS V9.1 (Cary, North Carolina). The list was sorted by this randomly generated number from lowest to highest. From this list, we selected the first 400 rural and first 300 urban agencies to receive study recruitment materials. We anticipated that between 10% and 50% of agencies would respond to a mass-mailing invitation and be screened for eligibility.6, 18, 19 We oversampled rural agencies based on an expectation that many were non-transporting agencies and thus ineligible for participation. Because our study was descriptive in nature and limited by available resources, we enrolled a maximum of 50 EMS agencies. A power calculation was not performed because differences in outcome measures were not hypothesized across variables of interest.
All study recruitment materials were mailed during the first week of January 2008 and contained two letters. The first letter was from the Principal Investigator and explained the study. The second letter was from a nationally recognized EMS figure who expressed support for our study.
An EMS agency was eligible for participation if it: 1) was a provider of ground ambulance services and had access to all agency expense and revenue data linked to the provision of ground transportation and operations and be able to distinguish these costs from other services provided (agencies with Fire or multi-consortium company affiliations were thought less likely to meet this criterion and therefore were carefully screened prior to enrollment); 2) was willing to assign an agency contact to be in charge of this study and allow this individual 2–3 hours per month for a total of 6 months to collect and enter data via a secure website; 3) had access to the Internet; and 4) engaged in patient transportation (emergent, non-emergent or both).
Study Protocol
The enrolled agencies were given a username and password to a secure website where agency data were collected. Upon their first time logging in, agency contacts were presented with a series of financial and human resource questions. These questions were asked only once and addressed the following: 1) total agency revenue and expenses for 2007; 2) the amounts in dollars charged for ambulance transportation and average reimbursement for each of the 6 transportation categories (e.g., BLS1, ALS1, SCT); 3) total number of responses and transports in 2007; and, 4) descriptions of employee positions (e.g. Paramedic, EMT-Basic, administrator). Agency contacts used the study’s secure website to populate a virtual employee roster. At the employee level, we collected the following pieces of information for each agency employee: 1) hourly pay or annual salary; 2) certification level (e.g., First Responder, EMT-Basic, Paramedic, Fire Fighter only, etc.); 3) average hours worked per week; 4) full-time status; and, 5) role as an administrator.
Agency contacts were instructed to access the website on the last week of each month to update agency rosters, document terminations, open positions, and new hires, and answer questions related to the cost of turnover. These latter questions were developed by our study team and informed by the Nursing Turnover Cost Calculation Methodology (NTCCM), a methodology developed by a member of our study team (CBJ).14, 15, 20–22
The NTCCM was derived from methodologies used in the business and nursing professions, and is grounded in human resource accounting methods.23–25
It was first applied in 1988.14, 15, 20–22 The NTCCM combines cost calculation methodologies developed by Hall, Hoffman, and Flamholtz to estimate pre-hire and post-hire costs associated with nursing turnover.20, 24, 25 Pre-hire costs include expenses associated with advertising and recruitment, costs associated with vacancies, and hiring costs. Post-hire costs include expenses associated with orientation and training of new hires, costs associated with new hire productivity, pre-termination costs associated with terminated employees, and costs associated with the termination process. Pre-hire and post-hire costs include both direct costs (e.g., newspaper advertisements) and indirect costs (e.g., time spent interviewing candidates). The NTCCM has undergone rigorous content, construct, and face validity testing.21 Both content and construct validity refer to the content/substance and structure of NTCCM questions. Items with sound content and construct validity coalesce on defined constructs and measure what the items were intended to measure. Face validity refers to the interpretability of NTCCM items by key informants (e.g., nurse leaders who maintain data sources). All forms of validity were evaluated by an expert panel that included economists knowledgeable of human capital, finance experts knowledgeable of resource accounting methods, human resource managers knowledgeable of staffing and turnover, and nurse executives.
We used the NTCCM as a framework to develop our cost of turnover questions. All questions were reviewed by our team which included health services researchers, a labor economist, EMS researchers, and experts in nursing turnover. This exercise addressed content and construct validity. We evaluated face validity by pilot testing our questions in three EMS agencies located in the surrounding Pittsburgh, Pennsylvania area. Agency contacts were asked to review item grammar, item interpretation, and relevance to diverse EMS operations. Following pilot testing, the University of Pittsburgh Center for Research on Healthcare Data Center created an electronic and secure web-based version of all questions..
Data collection began on the last week of January, 2008. We instructed agency contacts to access the study website and answer study questions at the end of each month. We tracked compliance with instructions using an automated email notification mechanism. Whenever an agency completed a monthly data entry session, an email was sent to the PI and study staff. We provided all agencies with technical assistance and on-site visits when requested. Notification of monthly data entry completion was followed with the release of an agency incentive. In total, each agency received $250 over the 6 month study period.
Variable Descriptions and Analysis of Data
Agency demographic variables were documented for descriptive purposes. We defined an agency as rural if greater than 50% of their service area Zip Codes were linked to categories 4.0–10.6 of the Rural Urban Commuting Area (RUCA) coding scheme or if the county in which the agency was located was designated as a micropolitan Core-Based Statistical Area (CBSA) or non-CBSA by the Office of Management and Budget (OMB).26 We used these data to group agencies into four major Census regions (Midwest, Northeast, South, and West). Agencies were placed into one of 4 categories of workforce size (<25 employees & volunteers, 25–49, 50–100, and >100). We defined the staffing mix of agency employees as all paid staff (agencies with all employed persons earning a wage), a mix of paid and volunteer staff (agencies with a mix of wage earners and non-wage earners), or all-volunteer (agencies with paramedics and EMTs receiving no specified wage. In cases where only the agency directors are documented as earning a wage, the agency’s status was classified as all-volunteer. Agencies self-selected their model type as hospital-based, government/3rd service, private free-standing or fire-based EMS. The total number of agency dispatches in 2007 were grouped into the following categories (1–500 responses, 501–1000, 1001–5000, and >5000). Agency expenses and revenue in 2007 were classified as follows: (<$500,000, $500,000–$1,000,000, and >$1,000,000). The proportion of total agency expenses linked to employee salaries and benefits was stratified into two categories: <60% and ≥60%. Total agency revenue linked to Centers for Medicare and Medicaid Services (CMS) was classified as No CMS revenue, <50% CMS revenue, and ≥50%.
Our three main outcomes of interest included the annual rate of turnover, the projected annual costs of turnover, and cost per termination. We calculated the annual rate of turnover as (the total number of terminations during the 6 month study period X 2)/total number of employees.27
To calculate the cost of turnover, we first excluded all agencies that did not experience turnover during the study period. We then calculated the monthly pre-hire and post-hire costs and adjusted these figures by the number of open positions, new hires, and terminations (See Table 1). The pre-hire and post-hire costs were summed to identify the total cost of turnover over the study period. This 6-month figure was then multiplied by 2 to represent the total projected annual cost of turnover. We calculated the average cost per termination by dividing the total cost of turnover by total terminations.
Table 1.
General description of cost categories and adjustments made in the calculation of the cost of turnover
| Cost Category | Description of calculation and adjustments |
|---|---|
| Pre-hire Costs | |
| Advertising & Recruitment Costs | The sum of (1) labor and travel and other expenses associated with job fairs, student visitation, community recruitment; (2) newspaper and internet advertisements, and other media purchases; (3) paper and other supplies associated with advertising and recruitment. The monthly sum is adjusted (divided) by the mean number of open positions per month over the study period. The adjustment is made to take into account costs linked to open positions that may be difficult to separate out from costs linked to terminations. This is figure multiplied by the total number of terminations for the month and equals the monthly component cost of turnover linked to advertising and recruitment. |
| Vacancy Costs | The sum of (1) labor and expenses linked to overtime due to understaffed conditions; (2) missed or denied transport revenue due to understaffed conditions. The monthly sum is adjusted (divided) by the mean number of open positions per month over the study period. The adjustment is made to take into account costs linked to open positions that may be difficult to separate out from costs linked to terminations. This figure is multiplied by the total number of terminations for the month and equals the monthly component cost of turnover linked to vacancy costs. |
| Hiring Costs | The sum of (1) labor and expenses linked to interviewing candidates; (2) processing paperwork for candidates and new hires; (3) bonuses for new hires; (4) expenses linked to use of employee search and hiring firms; (4) expenses linked to background checks performed on candidates and new hires. The monthly sum is adjusted (divided) by the mean number of open positions per month over the study period. The adjustment is made to take into account costs linked to open positions that may be difficult to separate out from costs linked to terminations. This figure is multiplied by the total number of terminations for the month and equals the monthly component cost of turnover linked to hiring costs. |
| Post-hire Costs | |
| Orientation & Training Costs | The sum of (1) labor and expenses linked to initial orientation of new hires; (2) precepting new hires; (3) expenses associated with printing orientation materials, supplying binders and company booklets and other materials to new hires; (4) expenses linked to providing company clothing and equipment to new hires, and providing health screenings or vaccinations for new hires; (5) and expenses associated with agency equipment purchases specifically for new hire training. The monthly sum is adjusted (divided) by the total number of new hires for the month in question. This figure is multiplied by the total number of terminations for the month and equals the monthly component cost of turnover linked to orientation and training costs. In situations where terminations exceed new hires, the total cost calculated cannot exceed the total of all expenses linked to new hires by month. |
| New-Hire Productivity Costs | The sum of the productivity costs for new hires (the difference between 90% productivity and productivity during the learning curve period). New hire data were collected after the 6th month of data collection. The calculation for new hire productivity appears in the Appendix. All new hire productivity costs were averaged and multiplied by the total number of terminations during the study period. This figure represents the total costs associated with bringing a new hire up to speed (90% productive) that can be linked to turnover. In situations where terminations exceed new hires, the total cost calculated cannot exceed the total of all expenses linked to new hire productivity. |
| Pre-Turnover Productivity Costs | The sum of labor costs linked to time administrators or equivalent employees spend filling shifts that employees who turnover during the month in question end up missing for one reason or another. The monthly sum is adjusted (divided) by the mean number of open positions per month over the study period. The adjustment is made to take into account labor costs linked to open positions and other staffing factors that may be difficult to separate out from costs linked to terminations. This figure is multiplied by the total number of terminations for the month and equals the monthly component cost of turnover linked to pre-turnover productivity costs. |
| Termination Costs | The sum of (1) labor and expenses linked to time administrators spend conducting exit interviews of terminated employees; (2) expenses associated with producing and printing materials and processing equipment and clothing linked to the termination process (e.g. washing or replacing employee agency issued clothing and equipment); (3) and expenses linked to paying the terminated employee early retirement, unused vacation compensation, or other related payout expenses unrelated to providing them with a final check. The total is not adjusted for open positions or new hires. Dividing the sum by the total number of terminations for the month equals the per-termination costs linked to the expenses in this component of turnover costs. |
We analyzed study data using descriptive statistics (e.g., frequencies, means, medians, and lower 25% [Q1] and upper 75% [Q3] quartiles). We calculated the average rate of turnover across agencies, the median total projected cost of turnover, and median cost per termination. We weighted each measure by the total number of positions at each agency to give more weight to those agencies with greater numbers of employed persons. Results are presented across a three level agency demographic variable, staffing mix: (all paid staff, mix of paid and volunteer, and all volunteer staff). All calculations and descriptive statistics were performed in SAS V.9.1 (Cary, North Carolina).
Results
Sample Demographics
We received 70 responses (10%) from agencies interested in participating in our study. Sixteen agencies did not meet eligibility criteria and 7 failed to complete the enrollment process (e.g., expressed interest but were unreachable immediately afterwards). Of the 47 agencies enrolled in the study, 6 failed to complete the required 6 months of data entry. Among these agencies, lack of time was the most commonly cited reason for attrition. At one agency, the contact person left the agency and the agency leadership indicated that no suitable replacement was available. At a separate agency, the contact person cited health reasons, the need to take extended leave from work, and lack of a suitable replacement to assign to our study. Results from a non-respondent analysis showed no significant differences in rural status or county population across 3 categories of response and enrollment: 1) enrolled and completed the study; 2) enrolled but lost to attrition or ineligible upon screening; and 3) no response to recruitment packet.
We excluded one additional agency from all calculations because this agency experienced an uncharacteristic pattern of patient transports during the study period (n=0 patient transports). Calculations were performed on 40 EMS agencies.
Approximately 25 agencies (62%) employed an all-paid staff, 25% employed a mix of paid and volunteer staff, and 13% employed an all-volunteer staff (Table 2). Among agencies with an all-paid staff model, most were classified as rural and located in the Midwest Census region. A large proportion of these agencies employed less than 25 staff, were self-described as being hospital-based, dispatched between 1,001 and 5,000 ambulances in 2007, and had an annual budget (revenues and expenses) of $1 million dollars annually. Fifty-percent of agencies with a mix of paid and volunteer staff were located in the Northeast Census region. Most of these agencies employed between 25 and 49 employees, were described as private-freestanding, dispatched between 501 and 1,000 ambulances in 2007, and had an annual budget less than $1 million annually. Of the remaining all-volunteer EMS agencies, most were located in the Midwest Census region, all employed less than 25 total staff, most were described as government or 3rd service that dispatched less than 500 ambulances in 2007, and had an annual budget that totaled less than $500,000 annually.
Table 2.
Demographic characteristics of EMS agencies
| Agency Characteristic | All paid staff | Mix of paid & volunteer staff | All-volunteer staff |
|---|---|---|---|
| Total agencies | N=25 | N=10 | N=5 |
| Rural agencies | 56% | 40% | 60% |
| Census region | |||
| Midwest | 76% | 20% | 80% |
| Northeast | 12% | 50% | 20% |
| South | 8% | -- | -- |
| West | 4% | 30% | -- |
| Size of workforce | |||
| <25 employees/volunteers | 40% | 30% | 100% |
| 25–49 employees/volunteers | 24% | 60% | -- |
| 50–100 employees/volunteers | 20% | 10% | -- |
| >100 employees/volunteers | 16% | -- | -- |
| Self described model type | |||
| Hospital-based | 44% | -- | -- |
| Gov’t/3rd Service | 16% | 20% | 60% |
| Private-freestanding | 32% | 60% | 40% |
| Fire-based | 8% | 20% | -- |
| Dispatches in 2007 | |||
| 1–500 | 4% | 20% | 60% |
| 501–1,000 | 16% | 40% | 40% |
| 1,001–5,000 | 44% | 30% | -- |
| >5,000 | 36% | 10% | -- |
| Total agency expenses 2007 | |||
| <$500,000 | 8% | 40% | 100% |
| $500,000 – $1,000,000 | 12% | 20% | -- |
| >$1,000,000 | 80% | 40% | -- |
| % of expenses linked to employee salary & benefits | |||
| <60% | 56% | 40% | 60% |
| ≥60% | 44% | 60% | 40% |
| Total agency revenue 2007 | |||
| <$500,000 | 8% | 40% | 100% |
| $500,000 – $1,000,000 | 12% | 10% | -- |
| >$1,000,000 | 80% | 50% | -- |
| % of revenue from CMS | |||
| None | 4% | -- | -- |
| <50% | 60% | 50% | 40% |
| ≥50% | 36% | 50% | 60% |
Annual rate of turnover
There were 106 total terminations across all agencies studied (n=80 for all-paid agencies, n=20 among mixed staffing agencies, and n=6 among all-volunteer models). Approximately 25 agencies (62.5%) experienced turnover during the 6 month study period (Table 3). The average number of terminations for all-paid EMS agencies (n=25) was 3.2. Average terminations for mixed staffing agencies (n=10) was 2.0 and 1.2 among all-volunteer agencies (n=5). The overall weighted average annual rate of turnover was 10.7% (SD 10.3). This rate was lowest among agencies using an all-paid staff (10.2%), and was followed by agencies with a mix of paid and volunteer staff (12.3%), and agencies using all-volunteer staffing (12.4%).
Table 3.
The weighted annual rate of turnover across agency staffing mix
| Outcome Variable | Overall | All paid staff | Mix of paid & volunteer staff | All-volunteer staff | |
|---|---|---|---|---|---|
| Total agencies | N=40 | N=25 | N=10 | N=5 | |
| % of agencies experiencing turnover during study | 62.5% | 64% | 60% | 60% | |
| Annual rate of turnover (weighted) | Mean (SD) | 10.7% (10.3) | 10.2% (9.8) | 12.3% (11.7) | 12.4% (10.8) |
| Median | 7.5% | 7.5% | 16.0% | 16.7% | |
| Min,Max | 0%, 41.7% | 0%, 41.7% | 0%, 31.7% | 0%, 26.7% | |
| Q1, Q3 | 5.2%, 10.8% | 6.1%, 9.8% | 0%, 22.5% | 0%, 17.0% |
Notes: Q1 = lower 25% quartile, Q3 = upper 75% quartile
Cost of turnover
The projected median annual total cost of turnover across all agencies that experienced turnover was $71,613.75 (Table 4). Total median costs varied across agency staffing mix with agencies using an all-paid staffing having the highest median total cost at $86,452.05 and all-volunteer staffing the lowest at $0. Among the 25 EMS agencies that experienced turnover, vacancy costs (e.g. labor and expenses linked to overtime due to understaffed conditions) and new hire productivity costs (e.g. time required of new hires to reach cut-loose status) contributed the most to overall cost. Among EMS agencies with a mix of paid and volunteer staff, vacancy costs and costs associated with orientation and training were the two largest contributors to the total cost of turnover. Among all-volunteer EMS agencies, the median total cost was $0 dollars across all 7 categories of cost. However, it was determined that 1 of the 3 all-volunteer agencies had a projected annual vacancy related cost of $8,866.67.
Table 4.
The projected annual weighted median cost of turnover across agency staffing mix
| Overall (n=25) | All paid staff (n=16) | Mix of paid & volunteer staff (n=6) | All-volunteer staff (n=3) | ||
|---|---|---|---|---|---|
| Pre-hire Costs (weighted) | |||||
| Advertising & Recruitment Costs | Median | $0 | $0 | $315.62 | $0 |
| Q1, Q3 | $0, $1,877.98 | $0, $1,877.98 | $202.62, $2,722.41 | $0, $0 | |
| Vacancy Costs | Median | $9,104.73 | $85,274.60 | $3,959.57 | $0 |
| Q1, Q3 | $57.60, $506,764.85 | $1,098.31, $506,764.85 | $57.60, $9,104.73 | $0, $8,866.67 | |
| Hiring Costs | Median | $836.36 | $836.36 | $186.49 | $0 |
| Q1, Q3 | $0, $1,943.97 | $0, $1,943.97 | $176.68, $270.43 | $0, $0 | |
| Post-hire Costs (weighted) | |||||
| Orientation & Training Costs | Median | $7,666.11 | $7,666.11 | $2,020.73 | $0 |
| Q1, Q3 | $0, 70,159.91 | $0, $70,159.91 | $0, $2,407.68 | $0, $0 | |
| Newly Hired Staff Productivity Costs | Median | $38,070.42 | $38,070.42 | $950.05 | $0 |
| Q1, Q3 | $313.15, $167,260.19 | $151.84, $167,260.19 | $313.15, $1,041.83 | $0, $0 | |
| Pre-Turnover Costs | Median | $0 | $0 | $0 | $0 |
| Q1, Q3 | $0, $0 | $0, $0 | $0, $0 | $0, $0 | |
| Termination Costs | Median | $826.12 | $15,764.40 | $180.00 | $0 |
| Q1, Q3 | $0, $29,431.44 | $0, $29,431.44 | $0, $1,264.00 | $0, $0 | |
| Total projected annual cost of turnover (weighted) | Median | $71,613.75 | $86,452.05 | $9,766.65 | $0 |
| Q1, Q3 | $6,878.22, $775,560.35 | $9,827.18, $775,560.35 | $6,140.49, $14,096.42 | $0, $8,866.67 | |
Notes: Q1 = lower 25% quartile, Q3 = upper 75% quartile
Figure 1 shows the agency by agency variation in median weeks and median costs associated with bringing newly hired EMTs and paramedics up to 90% productivity. Across all agencies with new hires during the study period (n=27), the median number of weeks for a newly hired EMS employee to reach 90% productivity was 12 (Q1=8, Q3=18) and the median costs associated with new hire productivity was $1,648.32 (Q1=$242.00, Q3=$3,458.26). Comparatively, the median weeks and median costs associated with new hire productivity are highest for all-paid EMS agencies and lowest for all-volunteer agencies. At the employee level across all new hires, median weeks and median total costs associated with new hire productivity are higher for paramedic positions compared with EMT-Basic positions. Figure 2 illustrates that the median weeks and median costs associated with bringing a newly hired paramedic up to 90% productivity are higher at all-paid EMS agencies compared to agencies with a mix of paid and volunteer staffing. Figure 2 excludes EMS agencies with all-volunteer staffing due to lack of newly hired paramedics during the study period at these agencies.
Figure 1.
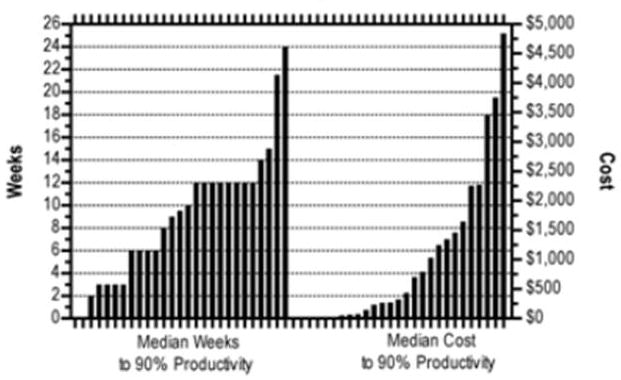
Agency by Agency Variation in Median Weeks to 90% Productivity and Median Productivity Costs for New Hires
Figure 2.
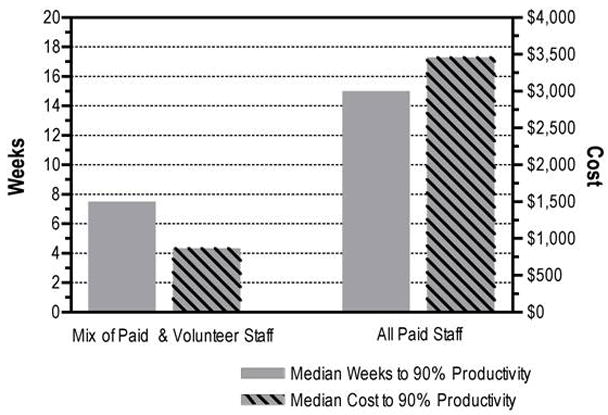
Median Weeks and Median Costs Associated with Newly Hired Paramedics Productivity in EMS Agencies with All-Paid and Mixed Staffing
Notes: There were no paramedics hired at all-volunteer agencies, thus these agencies are excluded from the figure.
Discussion
There are two known prior estimates of turnover in EMS.13, 28 These estimates suggest that turnover affects approximately one-fifth of EMS staff annually. However, the generalizability and validity of these findings are questionable. Both of these prior studies used a cross-sectional survey design. It is unclear if the data collected accounted for fluctuations in turnover over time or how the rate of turnover in each agency was calculated. Variations in rates across agency demographics are not available. Additionally, the response rate for each administration was only 13.1% & 10.2%, respectively. In our longitudinal study of 40 diverse EMS agencies, we determined that, on average, 10.7% of established EMS positions turnover annually. Findings suggest that the annual rate of turnover varies by agency staffing mix. The average annual rate of turnover for agencies with a mix of paid and volunteer staff and agencies with all-volunteer staff are slightly higher (12.3% and 12.4%) when compared to the average annual rate turnover among agencies with all-paid staffing (10.2%).
The variation in turnover observed in this study is not unique to EMS. Several studies of nursing turnover show wide variation across health care institutions and sectors.29–31 Annual rates within sectors can also vary across time. According to the Bureau of Labor Statistics, the annual rate of total employee separations, or turnover, for all health and education positions increased from 28.7% in 2007 to 32.2% in 2008. It is therefore likely that the average rate of turnover and rates among agencies of different staffing configurations will vary from year to year. While it may require a substantial investment in time and resources, continuous monitoring of annual EMS turnover would ensure that the EMS community and the communities served stay informed of potential changes in the EMS workforce, and possibly the services agencies may provide under different staffing conditions.
This study also examined the cost of EMS turnover, for which no prior estimates are known to exist. Modification of the NTCCM allowed us to quantify the total cost of turnover and costs per termination. Across agencies that experienced turnover, we determined that the total annual median agency cost of turnover was approximately $72,000. We observed wide variation in the total annual median cost of turnover across stratums of agency staffing mix. Specifically, the total annual median cost of turnover was nearly 9 times higher in agencies classified with all-paid staffing compared to agencies with a mix of paid and volunteer staffing. With the exception of one agency, agencies classified as all-volunteer staffing experienced $0 costs during the study period.
The median cost per termination across all agencies that experienced turnover was $7,000. The median cost per termination in all-paid staffing agencies was 5 times higher than among agencies with a mix of paid and volunteer staffing.
The studies by Jones on nursing turnover and associated costs show that the cost of nurse turnover in hospitals can be surprisingly high. In her most recent study, Jones determined that the total cost of nurse turnover was $8.5 million dollars across 3 nurse service lines in a large acute care hospital.22 The average cost per termination ranged from $82,000 to $88,000.22 Compared to the costs identified in the current study, costs associated with nursing turnover appear to be substantially higher than in EMS. However, direct comparisons between these two studies is tenuous, given differences in nurse and EMS employers, staffing models and configurations, educational backgrounds, and roles. The disparity in costs between this EMS study and studies in nursing imply that additional research is needed to better understand the costs and underlying causal mechanisms of turnover in each occupation.
Limitations
There is potentially wide variation in EMS agency designs and models of delivery across the U.S. We attempted to address the issue of sample representativeness by selecting and recruiting EMS agencies by using random selection and recruitment. However, this was limited by our sampling frame. The sampling was based on available data, and may influence the representativeness of our results.
Among those agencies receiving a recruitment packet, the longitudinal nature and time required by agency officials likely deterred many agencies from participating. Thus, a further limitation of our analysis is the low response rate. Turnover rates and cost calculations may be under or over representative of all of EMS depending on the patterns of turnover experienced in non-participating agencies. The limitation on representativeness of findings is particularly important when considering the all-volunteer EMS agencies studied. The all-volunteer EMS agency model varies greatly across U.S. EMS agencies, with some models paying employees based on transports, purchasing uniforms, and assuming the costs for other expenses related to our cost calculation methodology. For this reason, we believe that our findings most likely under-estimate the overall costs of EMS turnover.
Several participating agencies had difficulty submitting their data on time at the end of each month. Where agencies lacked detailed records, tardiness with data submissions may have impacted the accuracy of responses to selected cost questions. Efforts to reduce tardiness included use of multiple email reminders, telephone reminders, and on-site visits to help with data collection and submissions.
While our methodology for measuring turnover costs is based on previous research, and was pilot-tested extensively in the EMS setting prior to use in our full study sample; this methodology may not capture all relevant turnover cost related expenses relevant to the EMS setting. Further testing of our turnover cost calculation methodology may lead to new cost categories and new questions for measuring cost associated with turnover in the EMS setting. One next step for our study team includes collecting turnover and costs data from willing EMS agencies over multiple years. Other logical steps may include conducting qualitative studies of employees terminated and case studies of agencies with high and low rates of turnover and costs.
Conclusions
Turnover and the costs associated with turnover in EMS vary widely across types of EMS agencies. Based on our study findings, there is reason to believe that the annual rate of turnover may be slightly higher in EMS agencies that employ a mix of paid and volunteer personnel or all-volunteer personnel. The costs associated with turnover are highly variable across agencies and merit further investigation.
Table 5.
The weighted median cost per termination across agency staffing mix
| Overall (n=25) | All paid staff (n=16) | Mix of paid & volunteer staff (n=6) | All- volunteer staff (n=3) | ||
|---|---|---|---|---|---|
| Pre-hire Costs (weighted) | |||||
| Advertising & Recruitment Costs | Median | $0 | $0 | $52.60 | $0 |
| Q1, Q3 | $0, $117.94 | $0, $117.94 | $20.26, $272.24 | $0, $0 | |
| Vacancy Costs | Median | $1,138.09 | $2,527.52 | $659.93 | $0 |
| Q1, Q3 | $5.76, $11,517.38 | $310.59, $11,517.38 | $5.76, $1,110.14 | $0, $2,216.67 | |
| Hiring Costs | Median | $44.18 | $44.18 | $18.64 | $0 |
| Q1, Q3 | $0, $83.63 | $0, $83.63 | $17.66, $45.07 | $0, $0 | |
| Post-hire Costs (weighted) | |||||
| Orientation & Training Costs | Median | $740.82 | $766.61 | $240.76 | $0 |
| Q1, Q3 | $0, $1,594.54 | $0, $1,594.54 | $0, $392.92 | $0, $0 | |
| Newly Hired Staff Productivity Costs | Median | $1,717.24 | $2,185.13 | $95.01 | $0 |
| Q1, Q3 | $58.63, $3,801.37 | $596.64, $3,801.37 | $52.19, $260.45 | $0, $0 | |
| Pre-Turnover Costs | Median | $0 | $0 | $0 | $0 |
| Q1, Q3 | $0, $0 | $0, $0 | $0, $0 | $0, $0 | |
| Termination Costs | Median | $166.57 | $668.89 | $18.00 | $0 |
| Q1, Q3 | $0, $668.89 | $0, $668.89 | $0, $166.57 | $0, $0 | |
| Cost per termination (weighted) | Median | $6,871.51 | $7,161.38 | $1,409.64 | $0 |
| Q1, Q3 | $2,227.08, $17,626.37 | $2,812.43, $17,626.37 | $614.05, $1,627.77 | $0, $2,216.67 | |
Notes: Q1 = lower 25% quartile, Q3 = upper 75% quartile
Acknowledgments
This study was funded by the Health Resources and Services Administration (HRSA) Office of Rural Health Policy (ORHP) 1 R04 RH08596-01-00, North Central EMS Institute (NCEMSI), and Pittsburgh Emergency Medicine Foundation (PEMF). The content, views, and opinions expressed in this article do not represent and are not officially supported by the ORHP, NCEMSI, or PEMF. Dr. Patterson is supported by a KL2 grant (KL2 RR024154) from the National Center for Research Resources (NCRR), a component of the National Institutes of Health (NIH), and NIH Roadmap for Medical Research. The contents of this article are solely the responsibility of the authors and do not necessarily represent the official view of NCRR or NIH. Information on NCRR is available at http://www.ncrr.nih.gov/. Information on Re-engineering the Clinical Research Enterprise can be obtained from http://nihroadmap.nih.gov/clinicalresearch/overview-translational.asp
Footnotes
Presentations: Portions of these data/results have been previously presented at the National Association of EMS Physicians (NAEMSP) Annual Meeting, January 2009, Jacksonville, FL, and are scheduled to be presented at the 2010 NAEMSP Annual Meeting in Phoenix, AZ.
References
- 1.Gertz Husar D. Paramedic shortage leaves Pike County calling for help. Quincy Herald-Whig 09/06/2007. 2007 [Google Scholar]
- 2.Mellott K. Staff shortage has ambulance license in peril. The Tribune Democrat. 2007 [Google Scholar]
- 3.Amrhein S. Volunteer vexation. St Petersburg Times. 2006 [Google Scholar]
- 4.Gentile D. EMT shortage worries stockbridge officials. The Berkshire Eagle. 2006:B4. [Google Scholar]
- 5.Knight D. Medic! Stat! Shortage puts paramedics in high demand. The Indianapolis Star. 2005 [Google Scholar]
- 6.Freeman VA, Slifkin R, Patterson PD. Recruitment and retention in rural and urban EMS: Results from a national survey of local EMS directors. J Public Health Manag Pract. 2009;15(3):246–252. doi: 10.1097/PHH.0b013e3181a117fc. [DOI] [PubMed] [Google Scholar]
- 7.Patterson PD, Probst JC, Leith KH, Corwin SJ, Powell MP. Recruitment and Retention of EMTs: A qualitative study. J Allied Health. 2005;34(3):153–162. [PubMed] [Google Scholar]
- 8.McGinnis KK. State EMS Rural Needs Survey 2000. Falls Church, Virginia: National Association of State EMS Directors; 2000. [Google Scholar]
- 9.McGinnis KK. State EMS Rural Needs Survey 2004. Falls Church: Virginia National Association of State EMS Directors; 2004. [Google Scholar]
- 10.Goodwin K. EMS in rural America. Paper presented at: 2007 Annual Meeting of the National Conference of State Legislators; 2007; Washington, DC. [Google Scholar]
- 11.Goodwin K. Keeping Rural Emergency Medical Services Afloat. National Conference of State Legislatures; 2002. p. 27. [Google Scholar]
- 12.The National Rural Health Association EMSIG. Recruitment and Retention of a Quality Health Workforce in Rural Areas: A series of policy papers on the rural health careers pipeline: Number 12 Emergency Medical Services. National Rural Health Association; 2005. p. 12. [Google Scholar]
- 13.Williams DM. JEMS 2007 salary & workplace survey: In a world run on dollars, what about the people? JEMS. 2007;32(10):14. doi: 10.1016/S0197-2510(07)72385-9. [DOI] [PubMed] [Google Scholar]
- 14.Jones CB. Staff nurse turnover costs: Part II, measurements and results. J Nurs Adm. 1990;20(5):27–32. [PubMed] [Google Scholar]
- 15.Jones CB. The costs of nurse turnover, part 2: Application of the nursing cost calculation methodology. J Nurs Adm. 2005;35(1):41–49. doi: 10.1097/00005110-200501000-00014. [DOI] [PubMed] [Google Scholar]
- 16.Lijphart A. The comparable-cases strategy in comparative research. Comp Polit Stud. 1975;8(2):158–177. [Google Scholar]
- 17.WWAMI. [Accessed 10/13/2009];Rural-Urban Commuting Area Codes (RUCA) 2005 July; http://depts.washington.edu/uwruca/ruca-data.php.
- 18.Messer KL, Herzog AR, Seng JS, et al. Evaluation of a mass mailing recruitment strategy to obtain a community sample of women for a clinical trial of an incontinence prevention intervention. Int Urol Nephrol. 2006;38(2):7. doi: 10.1007/s11255-006-0018-1. [DOI] [PubMed] [Google Scholar]
- 19.Tworoger SS, Yasui Y, Ulrich CM, et al. Mailing strategies and recruitment into an intervention trial of the exercise effect on breast cancer biomarkers. Cancer Epidemiol Biomarkers Prev. 2002;11(1):5. [PubMed] [Google Scholar]
- 20.Jones CB, Jones Staff nurse turnover costs: Part I, A conceptual model. J Nurs Adm. 1990;20(4):18–23. [PubMed] [Google Scholar]
- 21.Jones CB. The costs of nurse turnover: part 1: an economic perspective. J Nurs Adm. 2004;34(12):562–570. doi: 10.1097/00005110-200412000-00006. [DOI] [PubMed] [Google Scholar]
- 22.Jones CB. Revisiting nurse turnover costs: adjusting for inflation. J Nurs Adm. 2008;38(1):11–18. doi: 10.1097/01.NNA.0000295636.03216.6f. [DOI] [PubMed] [Google Scholar]
- 23.Flamholtz EG. Human Resource Accounting. Norwell, MA: Kluwer Academic Publishers Group; 1999. [Google Scholar]
- 24.Hall TE. How to estimate employee turnover costs. Personnel. 1981;58(4):43–52. [PubMed] [Google Scholar]
- 25.Hoffman FM. Cost per RN hired. J Nurs Adm. 1985;15(2):27–29. [PubMed] [Google Scholar]
- 26.Budget OoMa. Standards for defining metropolitan and micropolitan statistical areas. Fed Regist. 2000;65(249):82228. [Google Scholar]
- 27.Decker FH, Gruhn P, Matthews-Martin L, Dollard JK, Tucker AM, Bizette L. Results of the 2002 AHCA Survey of Nursing Staff Vacancy and Turnover in Nursing Homes. Washington, D.C: American Health Care Association; 2003. [Google Scholar]
- 28.Williams DM. JEMS 2008 salary & workplace survey: so, remind me again why EMS is a good job? JEMS. 2008;33(10):48–64. doi: 10.1016/S0197-2510(08)70379-6. [DOI] [PubMed] [Google Scholar]
- 29.Castle NG. Measuring staff turnover in nursing homes. Gerontologist. 2006;46(2):10. doi: 10.1093/geront/46.2.210. [DOI] [PubMed] [Google Scholar]
- 30.Bostick JE, Rantz MJ, Flesner MK, Riggs CJ. Systematic review of studies of staffing and quality in nursing homes. J Am Med Dir Assoc. 2006;7(6):366–376. doi: 10.1016/j.jamda.2006.01.024. [DOI] [PubMed] [Google Scholar]
- 31.Remsburg RE, Armacost KA, Bennett RG. Improving nursing assistant turnover and stability rates in long-term care facility. Geriatr Nurs. 1999;20(4):203–208. doi: 10.1053/gn.1999.v20.101102001. [DOI] [PubMed] [Google Scholar]