

Abstract
Background and Purpose
The association between optimism and pessimism and health outcomes has attracted increasing research interest. To date, the association between these psychological variables and risk of stroke remains unclear. We examined the relationship between pessimism and the 7-year incidence of stroke.
Methods
A random sample of 23 216 adults (9 480 men, 13 796 women) aged 20–54 years completed the pessimism scale in 1998, i.e., at study baseline. Fatal and first non-fatal stroke events during a mean follow-up of 7.0 years were documented by linkage to the National-hospital-discharge and mortality registers, leading to 105 events.
Results
Unadjusted hazard ratio was 0.44 (95% CI 0.25–0.77) for participants in the lowest quartile (a low pessimism level) when compared to those in the highest quartile (a high pessimism level). After serial adjustments for sociodemographic characteristics, cardiovascular biobehavioral risk factors, depression, general feeling of stressfulness, and ischemic-heart disease the fully-adjusted hazard ratio was 0.52 (95% CI 0.29–0.93).
Conclusions
In this population of adult men and women, low level of pessimism had a robust association with reduced incidence of stroke.
Keywords: Adult, Attitude, Cohort Studies, Female, Follow-Up Studies, Health Status, Humans, Male, Middle Aged, Prospective Studies, Risk Factors, Social Support, Stroke, prevention & control, psychology, Young Adult
INTRODUCTION
There is a growing research interest in the relationship between dispositional optimism and pessimism, defined as a general tendency to exhibit positive and negative expectancies about future, and health outcomes.1–3 Although findings from well-conducted prospective studies suggest an association between optimism and pessimism as separate constructs and the risk of incident coronary heart disease (CHD) and cardiovascular (CVD) mortality,1, 4, 5 no evidence to date is available of an association with the incidence of stroke. We used prospective data from a large sample of the Finnish population to examine the association between dispositional pessimism and the incidence of stroke.
METHODS
Population
The Health and Social Support (HeSSup) study is a prospective cohort study on a population sample representative of the Finnish population of the following four age groups: 20–24, 30–34, 40–44, and 50–54 years at baseline in 1998, a total of 10,628 men and 15,267 women. The Turku University Central Hospital Ethics Committee approved the study.
Dispositional pessimism was assessed using the revised Life Orientation Test (LOT-R)6, 7 (Cronbach’s α = 0.74). The measure includes six statements, of which three are worded positively for optimism, and three are worded negatively to indicate pessimism. We categorized pessimism mean scores into 4 groups based on the nearest approximate of the quartiles as in previous studies.4 The highest quartile (high pessimism) was the reference category in the analysis.
Follow-up of stroke events
Linkage to the National Hospital Discharge Register and the Statistics Finland Mortality Register provided a virtually complete follow-up for hospitalizations and death for all participants who were treated in a hospital or died between January 1, 1999 and December 31, 2005. Stroke was determined by the International Classification of Disease (ICD)-10 codes I60 (subarachnoid haemorrhage), I61 (intracerebral haemorrhage) and I63 (cerebral infarction) as the main diagnosis of hospitalisation or death.
Cardiovascular risk factors
History of hypertension, CHD and diabetes mellitus at the time of questionnaire in 1998 (i.e. the survey year) were ascertained based on strict criteria 8. We excluded all participants hospitalized for CHD or cerebrovascular disease and those with medication for CHD during or before 1998. Incident CHD events (ICD-10 codes I20–I25) that occurred during the follow up were used as a covariate in the analysis. Behaviour-related risk factors include current smoking status, alcohol consumption, physical activity and obesity. Depressive symptoms were assessed using the Beck Depression Inventory (BDI score <10 vs 10+). The general feeling of stressfulness in daily life was measured using the Reeder Stress Inventory 9.
Statistical Analysis
We examined the relationship between pessimism and subsequent stroke events using seven serially adjusted Cox regression models. We combined men and women in the analyses (p >0.05 for interaction with sex) and verified that the assumption of proportional hazards held (all p>0.05).
RESULTS
Data linkage to national health registers, on the basis of a written consent, was successful for 24 128 (93%) participants. A total of 23 216 participants had complete data on the pessimism scale and all covariates. Of them, 105 incident stroke events (fatal and non-fatal 25 subarachnoid haemorrhages, 23 intracerebral haemorrhages, and 57 cerebral infarctions) were documented during a mean follow-up of 7.0 (range, 0.02–7.01) years.
Table 2 presents the association of pessimism levels with incident stroke events. Compared with participants with a high level of pessimism (the highest quartile), those reporting a low level of pessimism (the lowest quartile) were at lower risk of stroke (HR= 0.44, 95% CI 0.25–0.77). After serial adjustments the fully adjusted hazard for stroke was 0.52 (95% CI, 0.29–0.93) among those with low pessimism.
Table 2.
Hazard ratios (95% confidence intervals) for the association between quartiles of pessimism score and incident stroke events.
| Adjustments: | Quartiles of pessimism scores |
|||
|---|---|---|---|---|
| 1 (Lowest) (22 events/n=7588) | 2 (27/5904) | 3 (29/5587) | 4 (Highest) (27/4127) | |
| Model 1: none | 0.44 (0.25–0.77)† | 0.69 (0.41–1.18) | 0.79 (0.46–1.34) | 1 |
| Model 2: sex, age, education, marital status | 0.47 (0.26–0.84)† | 0.71 (0.42–1.23) | 0.82 (0.48–1.39) | 1 |
| Model 3: sex, age, education, marital status + behavior-related risk factors | 0.51 (0.25–0.91)* | 0.79 (0.46–1.36) | 0.89 (0.52–1.49) | 1 |
| Model 4: sex, age, education, marital status + hypertension and diabetes | 0.48 (0.27–0.86)† | 0.73 (0.43–1.26) | 0.83 (0.49–1.39) | 1 |
| Model 5: sex, age, education, marital status + depression | 0.48 (0.26–0.87)† | 0.73 (0.41–1.28) | 0.83 (0.48–1.44) | 1 |
| Model 6: sex, age, education, marital status + general feeling of stressfulness | 0.47(0.270.84)† | 0.72 (0.421.24) | 0.82 (0.49–1.39) | 1 |
| Model 7: sex, age, education, marital status + incident CHD | 0.44 (0.25–0.77)† | 0.68 (0.40–1.16) | 0.80 (0.47–1.36) | 1 |
| Model 8: all aforementioned | 0.52 (0.29–0.93)* | 0.80 (0.47–1.39) | 0.88 (0.52–1.50) | 1 |
p<0.05,
p<0.01,
p<0.001
Behavior-related risk factors: smoking, alcohol consumption, sedentary lifestyle, obesity.
The survival curve for stroke among participants with the lowest quartile of pessimism differed significantly (log-rank test, p<0.05) from those in the other quartiles and the difference between the groups grew as a function of time (Figure 1).
Figure 1.
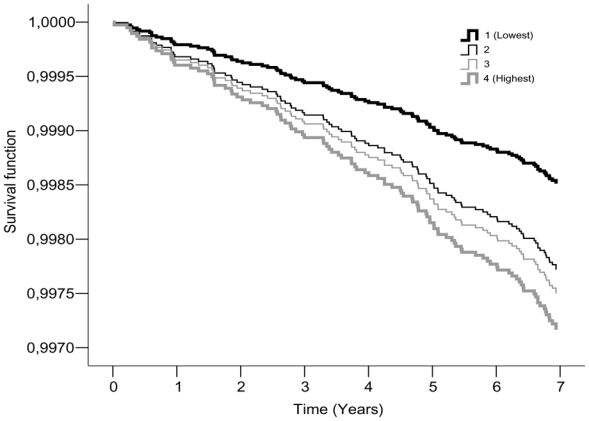
Cumulative incidence of stroke (fully adjusted*) by pessimism scores quartiles
*Sex, age, education, marital status, smoking, alcohol consumption, sedentary lifestyle, obesity, hypertension and diabetes, depression, general feeling of stressfulness and incident CHD
Further analyses were run examining the role of optimism (in quartiles) in the risk of stroke. We found no evidence to suggest an association between optimism and incidence of stroke (p=0.53), lending support to the idea that pessimism and optimism are separate constructs. We also examined the association between pessimism and stroke incidence in analysis adjusted for optimism in addition to age, sex, education and marital status. The adjustment did not alter the reduced incidence of stroke associated with low pessimism (HR=0.49, 95% CI 0.26–0.90).
DISCUSSION
We examined the prospective association between dispositional pessimism and subsequent stroke events in a large population of men and women with no history of ischemic heart disease or cerebrovascular disease. We found that participants with a low pessimism level had a 48% lower risk for incident stroke over the 7 years of follow-up, after controlling for many potential confounders. We found no evidence to suggest that the association was attributable to depressive symptoms, a correlate of both pessimism and the risk of stroke,10,11 It must be noted that we assessed depressive symptoms with the Beck Depression inventory, which is a validated survey instrument, but not a diagnostic tool for clinical depression
The present study was based on a representative sample of the Finnish population in four age groups, but did not include elderly participants which may limit the generalizability of our findings. Our findings are broadly consistent with previous studies on the associations between pessimism and optimism and the risk of CHD or death,4,12, Our results highlight the importance of pessimism in particular for the incidence of stroke, even in analyses adjusted for optimism. In agreement with the present results, a recent clinical study showed a lower survival rate for pessimistic cancer patients than their less pessimistic counterparts, but no difference between individuals with high levels of optimism and those with low levels of optimism.13 The precise mechanisms underlying the link between pessimism and stroke remain unclear. Both behavioural (lifestyle behaviors) and biological (autonomic nervous system activity) mechanisms are plausible.10,11,5, 14 Low pessimism may also be related to favorable trajectories of stroke risk factors over time. Further longitudinal studies are needed to examine these mechanisms in detail and whether interventions designed to reduce pessimism would alter stroke risk.
Table 1.
Sample characteristics as a function of the number of stroke events and pessimism score levels
| Quartiles of pessimism score | ||||||
|---|---|---|---|---|---|---|
| Baseline Covariates | N events/N participants | 1 Lowest | 2 | 3 | 4 Highest | P value/for trend |
| Sex | 0.243 | |||||
| Men | 59/9480 | 3124 (33.0) | 2333 (24.6) | 2268 (23.9) | 1755 (18.5) | |
| Women | 46/13736 | 4467 (32.5) | 3571 (26.0) | 3319 (24.2) | 2379 (17.3) | |
| Age-group | 0.001 | |||||
| 20–24 | 3/6324 | 1938 (30.6) | 1518 (24.0) | 1664 (26.3) | 1204 (19.0) | |
| 30–34 | 8/5533 | 1937 (35.0) | 1399 (25.3) | 1273 (23.0) | 924 (16.7) | |
| 40–44 | 28/5555 | 1831 (33.0) | 1473 (26.5) | 1262 (22.7) | 989 (17.8) | |
| 50–54 | 66/5804 | 1885 (32.5) | 1514 (26.1) | 1388 (23.9) | 1017 (17.5) | |
| Level of education | < 0.001 | |||||
| Basic (compulsory) | 44/7412 | 2136 (28.8) | 1756 (23.7) | 1911 (25.8) | 1609 (21.7) | |
| Secondary | 24/5232 | 1367 (26.1) | 1273 (24.3) | 1441 (27.5) | 1151 (22.0) | |
| College | 26/7400 | 2696 (36.4) | 2033 (27.5) | 1654 (22.4) | 1017 (13.7) | |
| University | 11/3172 | 1392 (43.9) | 842 (26.5) | 581 (18.3) | 357 (11.3) | |
| Marital Status | < 0.001 | |||||
| Other | 25/7674 | 2325 (30.3) | 1735 (22.6) | 1881 (24.5) | 1733 (22.6) | |
| Married/cohabiting | 80/15542 | 5266 (33.9) | 4169 (26.8) | 3706 (23.8) | 2401 (15.4) | |
| Current smoker | < 0.001 | |||||
| No | 62/15508 | 5256 (33.9) | 4114 (26.5) | 3714 (23.9) | 2424 (15.6) | |
| Yes | 35/5862 | 1717 (29.3) | 1311 (22.4) | 1441 (24.6) | 1393 (23.8) | |
| Missing | 8/1846 | 618 (33.5) | 479 (25.9) | 432 (23.4) | 317 (17.2) | |
| High alcohol intake (200 g of alcohol/weeka) | < 0.001 | |||||
| No | 87/20956 | 6950 (33.2) | 5412 (25.8) | 5034 (24.0) | 3560 (17.0) | |
| Yes | 18/2260 | 641 (28.4) | 492 (21.8) | 553 (24.5) | 574 (25.4) | |
| Obesity (body mass index ≥ 30 kg/m2) | < 0.001 | |||||
| No | 83/20992 | 6973 (33.2) | 5395 (25.7) | 5050 (24.1) | 3574 (17.0) | |
| Yes | 22/2224 | 618 (27.8) | 509 (22.9) | 537 (24.1) | 560 (25.2) | |
| Sedentary life style (<2 METbhours per day) | < 0.001 | |||||
| No | 69/17855 | 6072 (34.0) | 4672 (26.2) | 4205 (23.6) | 2906 (16.3) | |
| Yes | 36/5361 | 1519 (28.3) | 1232 (23.0) | 1382 (25.8) | 1228 (22.9) | |
| Depression (BDI score ≥ 10) | < 0.001 | |||||
| No | 97/22159 | 7559 (34.1) | 5833 (26.3) | 5408 (24.4) | 3359 (15.2) | |
| Yes | 8/1057 | 32 (3.0) | 71 (6.7) | 179 (16.9) | 775 (73.3) | |
| General feeling of stressfulness in daily life | 0.715 | |||||
| Low | 46/10497 | 3464 (33.0) | 2604 (24.8) | 2574 (24.5) | 1855 (17.7) | |
| Intermediate | 27/5547 | 1790 (32.3) | 1426 (25.7) | 1312 (23.7) | 1019 (18.4) | |
| High | 31/7020 | 2294 (32.7) | 1833 (26.1) | 1666 (23.7) | 1227 (17.5) | |
| Missing | 1/152 | 43 (28.3) | 41 (27.0) | 35 (23.0) | 33 (21.7) | |
| Hypertension or diabetes | < 0.001 | |||||
| No | 85/22136 | 7299 (33.0) | 5648 (25.5) | 5300 (23.9) | 3889 (17.6) | |
| Yes | 20/1080 | 292 (27.0) | 256 (23.7) | 287 (26.6) | 245 (22.7) | |
| Ischemic heart disease | 0.002 | |||||
| No | 102/23016 | 7566 (32.7) | 5864 (25.5) | 5533 (24.0) | 4083 (17.7) | |
| Yes | 3/200 | 55 (27.5) | 40 (20.0) | 54 (27.0) | 51 (25.5) | |
200 g of alcohol represent 16 drinks per week
MET: Metabolic Equivalent Task
Acknowledgments
The HeSSup study is supported by the Academy of Finland (three grants) and the Yrjö Jahnson Foundation (three grants) and the Finnish heart Foundation (one grant). MKiv. and JV are supported by the Academy of Finland (grants #117604, #124271, #124322 and #129262). MKiv is supported by the BUPA foundation specialist research grant, the UK and AS-M by a EUYRI award from the European Science Foundation.
Footnotes
Conflict of interest: none declared.
References
- 1.Scheier MF, Matthews KA, Owens JF, Magovern GJ, Sr, Lefebvre RC, Abbott RA, Carver CS. Dispositional optimism and recovery from coronary artery bypass surgery: The beneficial effects on physical and psychological well-being. J Pers Soc Psychol. 1989;57:1024–1040. doi: 10.1037//0022-3514.57.6.1024. [DOI] [PubMed] [Google Scholar]
- 2.Scheier MF, Matthews KA, Owens JF, Schulz R, Bridges MW, Magovern GJ, Carver CS. Optimism and rehospitalization after coronary artery bypass graft surgery. Arch Intern Med. 1999;159:829–835. doi: 10.1001/archinte.159.8.829. [DOI] [PubMed] [Google Scholar]
- 3.Peterson C, Seligman ME, Vaillant GE. Pessimistic explanatory style is a risk factor for physical illness: A thirty-five-year longitudinal study. J Pers Soc Psychol. 1988;55:23–27. doi: 10.1037//0022-3514.55.1.23. [DOI] [PubMed] [Google Scholar]
- 4.Giltay EJ, Geleijnse JM, Zitman FG, Hoekstra T, Schouten EG. Dispositional optimism and all-cause and cardiovascular mortality in a prospective cohort of elderly dutch men and women. Arch Gen Psychiatry. 2004;61:1126–1135. doi: 10.1001/archpsyc.61.11.1126. [DOI] [PubMed] [Google Scholar]
- 5.Tindle HA, Chang YF, Kuller LH, Manson JE, Robinson JG, Rosal MC, Siegle GJ, Matthews KA. Optimism, cynical hostility, and incident coronary heart disease and mortality in the women’s health initiative. Circulation. 2009;120:656–662. doi: 10.1161/CIRCULATIONAHA.108.827642. [DOI] [PMC free article] [PubMed] [Google Scholar]
- 6.Scheier MF, Carver CS, Bridges MW. Distinguishing optimism from neuroticism (and trait anxiety, self-mastery, and self-esteem): A reevaluation of the life orientation test. J Pers Soc Psychol. 1994;67:1063–1078. doi: 10.1037//0022-3514.67.6.1063. [DOI] [PubMed] [Google Scholar]
- 7.Kivimaki M, Vahtera J, Elovainio M, Helenius H, Singh-Manoux A, Pentti J. Optimism and pessimism as predictors of change in health after death or onset of severe illness in family. Health Psychol. 2005;24:413–421. doi: 10.1037/0278-6133.24.4.413. [DOI] [PubMed] [Google Scholar]
- 8.Kivimaki M, Gimeno D, Ferrie JE, Batty GD, Oksanen T, Jokela M, Virtanen M, Salo P, Akbaraly TN, Elovainio M, Pentti J, Vahtera J. Socioeconomic position, psychosocial work environment and cerebrovascular disease among women: The finnish public sector study. Int J Epidemiol. 2009 doi: 10.1093/ije/dyn373. [DOI] [PMC free article] [PubMed] [Google Scholar]
- 9.Vahtera J, Kivimaki M, Hublin C, Korkeila K, Suominen S, Paunio T, Koskenvuo M. Liability to anxiety and severe life events as predictors of new-onset sleep disturbances. Sleep. 2007;30:1537–1546. doi: 10.1093/sleep/30.11.1537. [DOI] [PMC free article] [PubMed] [Google Scholar]
- 10.Giltay EJ, Zitman FG, Kromhout D. Dispositional optimism and the risk of depressive symptoms during 15 years of follow-up: The zutphen elderly study. J Affect Disord. 2006;91:45–52. doi: 10.1016/j.jad.2005.12.027. [DOI] [PubMed] [Google Scholar]
- 11.Larson SL, Owens PL, Ford D, Eaton W. Depressive disorder, dysthymia, and risk of stroke: Thirteen-year follow-up from the baltimore epidemiologic catchment area study. Stroke. 2001;32:1979–1983. doi: 10.1161/hs0901.094623. [DOI] [PubMed] [Google Scholar]
- 12.Kubzansky LD, Sparrow D, Vokonas P, Kawachi I. Is the glass half empty or half full? A prospective study of optimism and coronary heart disease in the normative aging study. Psychosom Med. 2001;63:910–916. doi: 10.1097/00006842-200111000-00009. [DOI] [PubMed] [Google Scholar]
- 13.Schulz R, Bookwala J, Knapp JE, Scheier M, Williamson GM. Pessimism, age, and cancer mortality. Psychol Aging. 1996;11:304–309. doi: 10.1037//0882-7974.11.2.304. [DOI] [PubMed] [Google Scholar]
- 14.MacMahon S, Rodgers A. Blood pressure, antihypertensive treatment and stroke risk. J Hypertens Suppl. 1994;12:S5–14. [PubMed] [Google Scholar]