

Abstract
We detail our use of computer-controlled optical traps to study interactions between kinetochore components and dynamic microtubules. Over the last two decades optical traps have helped uncover the working principles of conventional molecular motors, such as kinesin and dynein, but only recently have they been applied to study kinetochore function. The most useful traps combine sensitive position detectors and servo-control, allowing them to be operated as force clamps that maintain constant loads on objects as they move. Our instrument, which is among the simplest designs that permits force clamping, relies on a computer-controlled piezoelectric stage and a single laser for trapping and position detection. We apply it in motility assays where beads coated with pure microtubule-binding kinetochore components are attached to the tips of individual dynamic microtubules. Like kinetochores in vivo, the beads remain tip-attached, undergoing movements coupled to filament assembly and disassembly. The force clamp provides many benefits over instruments that lack feedback control. It allows tension to be applied continuously during both assembly- and disassembly-driven movement, providing a close match to the physiological situation. It also enables tracking with high resolution, and simplifies data interpretation by eliminating artifacts due to molecular compliance. The formation of persistent, load-bearing attachments to dynamic microtubule tips is fundamental to all kinetochore activities. Our direct, physical study of kinetochore-microtubule coupling may therefore furnish insights into many vital kinetochore functions, including correction of aberrant attachments and generation of the ‘wait-anaphase’ signals that delay mitosis until all kinetochores are properly attached.
Introduction
Biologists and engineers alike know that one of the best ways to learn how something works is to build a functioning model. An electrical engineer who wants to understand a complex circuit begins by constructing a prototype that allows her to probe voltages at various locations and to swap resistors, capacitors, and other elements in and out. Likewise, aeronautic and naval engineers build scale models for wind tunnel and wave tank testing, where flow patterns and forces can be measured. There are two key reasons why these approaches are so successful. First, they distill the system down to a minimum of essential, modifiable components—a reductionist strategy that facilitates testing of well-defined hypotheses. Second, they enable direct observation of system dynamics. These same strategies are useful to biologists when the processes they are studying can be reconstituted in vitro using pure components.
A great example is the study of motor proteins over the last two decades. In vitro motility assays developed in the 1980s first showed that myosin and kinesin alone are sufficient to generate ATP-powered movement along F-actin and microtubule filaments, respectively (1, 2). These assays then led to an explosion of new biophysical techniques for manipulating and tracking individual molecules that now provide a clear picture of how these motors work (3-8). Using laser trapping, for example, we can observe the stepwise, 8-nanometer movements of single kinesin molecules as they literally walk along the sides of microtubules (9, 10). With ultrasensitive fluorescence microscopy, it is even possible to watch as one ATP molecule binds a motor and causes it to undergo one stepwise movement (11).
Simultaneous with progress in single molecule techniques, efforts began in the mid-1980s to reconstitute kinetochore-microtubule interactions. Kinetochores are large, multi-protein complexes that are central to mitosis. They couple chromosomes to the microtubules of the mitotic spindle, serving as primary sites where force is produced to move the chromosomes (12). They also provide critical regulatory functions that ensure the accuracy of chromosome segregation (13). The first in vitro studies of kinetochore activity used whole chromosomes isolated from tissue culture cells (14-16). These pioneering experiments established that kinetochores can remain attached to the assembling and disassembling tips of microtubules, allowing them to generate movement by harnessing filament growth and shortening (an idea suggested earlier by observations of mitotic cells; e.g., see 12). Other early efforts identified microtubule binding factors from budding yeast cell extracts that assemble onto centromeric DNA (17) and probably participate in the sensing and correcting of aberrant kinetochore-microtubule attachments (18, 19). The full benefit of reconstitution could not yet be achieved, however, because so little was known about the molecular components of kinetochores.
Now, armed with a wealth of new information about kinetochore biochemistry, reconstitution is more promising than ever. Nearly-complete lists of kinetochore components are available, particularly in budding yeast, whose kinetochores are among the simplest (20-22). We also know that kinetochores are organized into distinct subcomplexes (23-34), many of which can be expressed recombinantly and purified in active form from E. coli (35-39). The stoichiometry and rough spatial arrangement of subcomplexes within the kinetochore is known (40-43), and many of the subcomplexes that interact directly with microtubules have been identified (35-37, 44-48).
With these considerations in mind, our lab is developing new in vitro assays that allow kinetochore functions to be interrogated with advanced single molecule techniques. We focus here on optical trapping-based methods for studying how subcomplexes from the microtubule-binding layer of the kinetochore, such as the Dam1 and Ndc80 complexes, can form persistent, load-bearing attachments to the tips of assembling and disassembling microtubules (49, 50). The coupling between kinetochores and dynamic microtubule tips is fundamental to all kinetochore activities. Therefore our methods for studying coupling will enable investigations of other functions, such as regulation of kinetochore-attached microtubule dynamics (51), correction of aberrant attachments, and checkpoint signaling. Brief methods have been published elsewhere (49-51). Our aim here is to provide a more thorough treatment, discussing some of the challenges we have encountered and offering practical solutions to these challenges.
Optical Trapping for Kinetochore Studies
Instrument Design and Construction
An optical trap is essentially an infrared laser beam focused through a high-power objective lens to create a very small (diffraction-limited), very bright spot (52). The spot traps micron-sized transparent objects, such as polystyrene beads, allowing them to be manipulated relative to their surroundings by steering the laser beam or by moving the specimen stage while keeping the beam fixed. The earliest traps were simple, manipulation-only devices (53, 54). However, the utility of trapping comes from the incorporation of additional features, such as photodetectors for measuring the position of the trapped object, and computerized feedback for controlling the applied force. A dizzying variety of trap configurations have been developed over the last decade (e.g., see 52, 55). The instrument we built for studying kinetochore-microtubule interactions is among the simplest possible designs that allows for nanometer-scale tracking and computerized control of applied force.
Our instrument is based around a Nikon inverted microscope (TE2000), outfitted for video-enhanced differential interference contrast (DIC) imaging. For trapping it is essential to choose a high numerical aperture objective lens with good transmission at the wavelength of the trap laser (52), which in our case is 1064 nm. We currently use a Nikon 100× 1.4 NA oil Plan Apo IR CFI objective, which transmits ∼60% at 1064 nm and has been a standard trapping lens for many years. Nikon now offers a newer alternative, the 100× 1.49 Plan Apo TIRF CFI, with similar infrared transmission and higher numerical aperture. To view unlabeled microtubule filaments via DIC, we also use an oil condenser lens with high numerical aperture (1.4), two standard Wollaston prisms and polarizers, and a mercury arc lamp (X-Cite 120) for transmitted-light illumination (see Fig. 1). We couple the mercury lamp to the microscope through a 10-meter optical fiber and place it in a separate room, so the heat and noise it produces cannot interfere with trap stability. Microtubules can also be viewed using diode-based illuminators (e.g., see 56), which produce far less heat and are probably more cost effective. We capture images with a standard black and white video camera (JAI, CV-M50). The high contrast needed to resolve individual microtubules exaggerates slight imaging flaws, created primarily by dust on the optics or minor variations in illumination intensity. These variations must be removed by background subtraction to produce acceptable image quality. Stand-alone video image processors, such as the Hamamatsu Argus, have traditionally been used for this purpose. Unfortunately, the Argus is no longer commercially available but computer-based image acquisition and processing is a straightforward alternative (e.g., using LabView). During experiments, we record video onto standard VHS cassette tapes. Digital recording would likely provide higher image quality, but we use the recordings only for archiving or low-resolution position tracking in experiments without the optical trap.
Fig. 1. Layout of a simple feedback controlled optical trap.
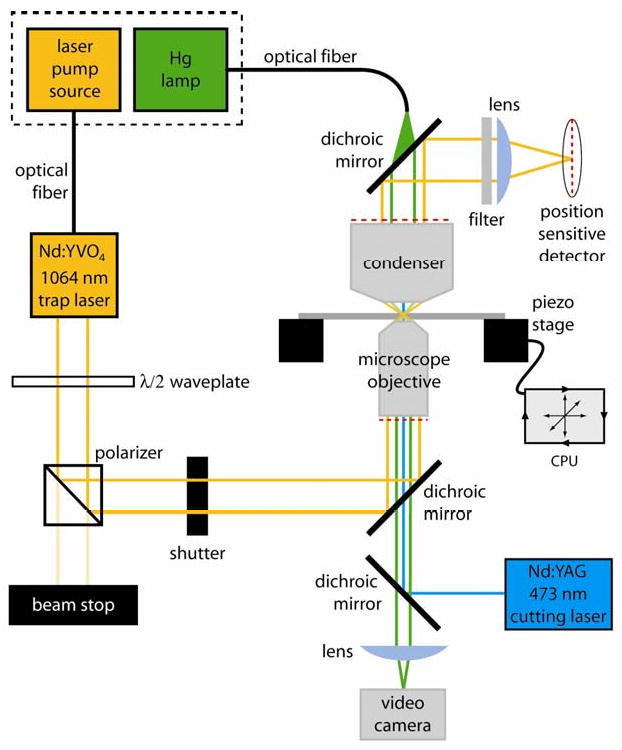
The diode pump source for the 1064 nm laser and the mercury arc lamp are located outside the microscope room (dashed box) to minimize heat and noise and are coupled via optical fibers to the laser head and microscope. The waveplate and polarizer select a fraction of the total power from the trapping laser as a stiffness adjustment. An operator-controlled shutter is used to turn the trap on and off during experiments. The trapping beam enters and exits the microscope via dichroic mirrors which pass light in the visible range for specimen illumination and laser scission. A filter and lens isolates the trapping beam and images it on a position sensitive detector. Beam position data from the detector is used to move the piezo specimen stage by computer controlled feedback. A video camera is used for contrast-enhanced DIC imaging of individual microtubules. A second dichroic introduces the 473 nm microtubule cutting laser into the microscope objective.
The trap itself is formed by a diode-pumped continuous wave 1064 nm Nd:YVO4 laser from Spectra Physics (J20-BL10-106Q). Though costly, these lasers have become a mainstay for optical trapping because they provide excellent power and pointing stability, plus 4 W of output power—enough to form a trap capable of applying forces in excess of 50 pN. Thus far, our experiments with individual kinetochore components have not required forces above a few piconewtons, so a less expensive laser such as the 400 mW Chromalase (CLAS-106-STF02-01, from Blue Sky Research), would have been adequate. However, the additional power of the Spectra Physics laser could become important as we begin to study more complete kinetochore assemblies, which are predicted to sustain higher loads. As a safety precaution, we add a green band pass filter (CVI Melles Griot, VG 14) in-between the eyepieces and the main body of the microscope to prevent eye exposure to the infrared trapping light (which is powerful but invisible).
To direct the trap laser into the objective lens, an infrared-reflecting dichroic mirror is custom-mounted just below the objective but above the traditional fluorescence filter cube turret. This arrangement preserves the fluorescence capabilities of the microscope for future use. As the laser beam passes through the trapped object, its light is partially scattered. Much of the scattered light is collected by the condenser lens and then another (identical) custom-mounted dichroic reflects it towards a position-sensitive photodetector (located in an optical plane conjugate to the back focal plane of the condenser lens), which allows the position of the trapped object to be monitored with high precision for use in feedback control. More elaborate instruments with a computer-steerable trapping laser usually incorporate an additional, low-power, fixed laser for position detection (57). These extra complexities are justified when fast feedback control is required (i.e., > 50 Hz updates), or when non-uniformity of the trapped objects requires re-calibration of the position sensor for each object. However, our simple system using a single fixed laser for both trapping and position detection is easier to build and maintain. The piezo stage-based steering allows feedback updates at 50 Hz, adequate for clamping the force on beads coupled to dynamic microtubule tips, which move relatively slowly (usually < 12 nm s-1 during filament growth and < 200 nm s-1 during disassembly). We avoid the need to re-calibrate the position sensor for each bead by using polystyrene beads of uniform size (CV 2.5%, Spherotech).
Steering in our fixed-trap system is accomplished by moving the specimen stage. For long-range movements, we use a two-axis stage with manual, fine-threaded actuator screws. This stage allows finer control than the stock Nikon stage, but it is still inadequate for carefully positioning beads relative to microtubule tips in our assays. For finer movements, we mounted a precision three-axis piezo stage with internal capacitive position sensors (Physik Instrumente, P-517.3CL) atop the manual stage. The piezo controller (E-710) accepts digital commands from a personal computer, generated either in response to a hand-held joystick or during automated calibration and feedback control routines. Adding the stages and the photodetector requires some custom modifications to the microscope body (see Fig. 2). Next to cost, these are the most significant hurdles to trap construction.
Fig. 2. Microscope customizations for adding photodetector, stages, and trap laser.
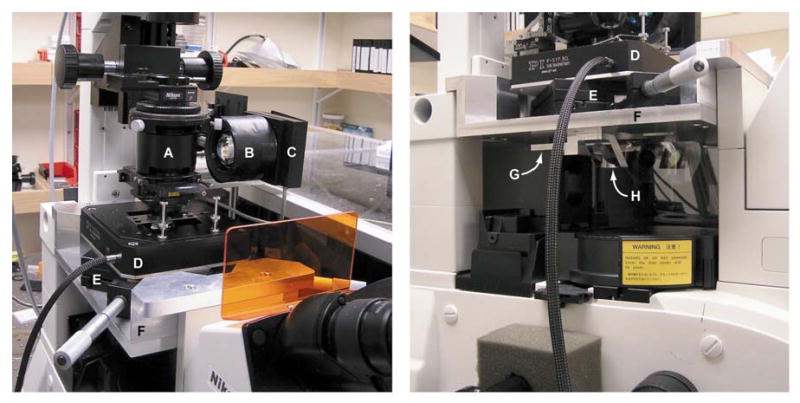
(Left) View of condenser assembly and stages. We modified a hollow extension tube (A) to hold the dichroic mirror that deflects light scattered upward from the trap through a hole (out of view) cut through the right side of the tube. A separate lens and filter assembly (B) focuses the scattered light onto the photodetector (C). The piezo stage (D) sits atop a manual stage (E). A custom platform (F) is required to accommodate the height of the stages. (Right) Side view showing stages (D, E) and additional modifications underneath the custom platform (F). We replaced the stock objective turret with a custom piece (G) that holds a single objective lens (plus a Wollaston prism) and dove-tails into the Nikon focusing mechanism. Another custom piece (H), fixed to the underside of the platform (F), holds the dichroic that deflects the trap laser into the objective.
To control entry of the trap laser into the microscope, we use a shutter (Vincent Associates, VS25S2ZMO) operated by an inexpensive, foot pedal switch. The foot switch facilitates trapping of objects with very high indices of refraction, such as polystyrene beads, which tend to be pushed away from the trap if they are not precisely in focus (owing to the ‘fire hose’ effect of scattering forces; see 52). To trap such objects, we temporarily block the laser with the foot switch-controlled shutter, leaving our hands free to maneuver the bead into the trapping site (using either the manual stage or the joystick-controlled piezo stage). Once the bead is properly located and in focus, we capture it by turning the trap back on with the foot switch.
The environment around a trapping instrument has a significant impact on its performance. We house our instruments in a temperature controlled, quiet, dust-free room Temperature control is crucial for avoiding instrument drift, since temperature gradients cause differential expansion and contraction of the instrument, producing artifacts in the position signals. In a typical biology laboratory, temperature fluctuations can exceed several degrees per hour—easily enough to produce drift comparable to the rate of microtubule growth. Our microscopy room includes a custom recirculating air system to maintain a constant temperature, to within ±0.5° C. Given sufficient warm-up time, the drift in our instruments is negligible, at ∼2 Å s-1. The position sensing system also responds to acoustic noise and floor vibrations, so it is essential to minimize these disturbances as well. Our laboratory is in the basement of a sturdy (circa 1949) concrete building, and the microscopy room has acoustic insulation in the walls. Even with these precautions, our experiments can be fouled when heavy carts are pushed through the adjacent hallway.
Calibrating the optical trap
Quantitative trap assays demand accurate calibration of both the position sensor response and the trapping force. To calibrate the response of the position sensor to our beads, we first attach the beads firmly to a coverslip surface. Then we use an automated routine to raster scan individual coverslip-bound beads through the beam while recording the voltage signals from the photodetector. Signals generated from 15 to 20 different beads are averaged, and then a two-dimensional, fifth-order polynomial fit is generated to provide a voltage-to-position map that is used later to determine the position of trapped beads in real time (57). This method of sensor calibration requires spherical beads with uniform diameter, identical to those used for trapping assays. Since the method assumes bead movement matches precisely that of the piezo stage, firm attachment to the coverslip is also important. Coverslip attachment can usually be achieved by simply introducing the beads into a clean flow cell in a buffer of moderate ionic strength, without blocking proteins. If necessary, the rigidity of attachment can be improved by evaporating and then replacing the buffer (e.g., by placing the flow cell a dry incubator). The calibration is checked by raster scanning additional coverslip-attached beads and measuring the RMS deviation between the computed and actual positions. A good calibration typically produces RMS errors less than a few nanometers across many beads.
We employ three different methods to calibrate the trap stiffness: power spectrum, equipartition, and drag force. These methods and the physics on which they are based are discussed at length in previous reviews (52, 57-59). For the sake of brevity, we discuss here only a few details that relate specifically to our use of optical traps for studying kinetochore-microtubule attachments. First, we note that the coverslip-anchored microtubules in our experiments orient randomly on the coverslip surface. Depending on their density, it can be impractical to study only those filaments with a particular orientation. Thus, calibration of the trap stiffness in two lateral dimensions (i.e., in the plane parallel to the coverslip surface) is useful because it enables accurate forces to be applied to microtubules of any orientation (57). Since polarization effects usually conspire to generate an elliptically-shaped trapping potential in the lateral plane, care must be taken to map the stiffness along the principle elliptical axes (i.e., the two orthogonal directions along which the trap is most, and least, stiff). Given these principle stiffnesses, the vector force in the lateral plane can be computed for any position within the harmonic region of the trap, which usually extends out to ∼100 nm from the trap center.
We use custom software written in LabView for instrument control and data acquisition during the calibration routines outlined above and during force clamp experiments (described below). Analog signals from the position sensor are sampled at 40 kHz using an analog-to-digital conversion board (National Instruments, PCI-6251). Commands are sent to the piezo stage controller through a GPIB digital interface (National Instruments, GPIB-USB-B). Both the bead and stage positions are down-sampled to 200 Hz for file storage.
Reconstituting Microtubule-Driven Movement and Force Production
Obtaining pure, active kinetochore components
The first step in any effort toward biological reconstitution is to obtain pure, active components. For kinetochores, this step would be impossible without the great progress made over the last decade in our understanding of kinetochore biochemistry. Kinetochores are large multiprotein complexes, composed of ∼80 distinct proteins grouped loosely into three functional segments: the inner kinetochore that binds DNA, the outer kinetochore that binds microtubules, and the middle kinetochore that forms a structural bridge. Detailed analyses, beginning with budding yeast and now extending to metazoans, have revealed a ‘core’ of essential proteins organized hierarchically into distinct subcomplexes (20-22). This discovery, in turn, has facilitated the purification of many core kinetochore proteins in active form, by using polycistronic vectors (60) to simultaneously express all the components of a particular subcomplex in E. coli (35-37, 39). (In contrast, expressing individual proteins alone generally yields poor expression or inactive, insoluble protein.)
The presence of distinct, stable subcomplexes within the kinetochore also suggests a functional modularity, which is good news for would-be reconstitutors since it implies that building a fully-functional coupler may not require all ∼80 proteins. Modularity is further supported by experiments showing that pure, recombinant subcomplexes from the outer kinetochore, such as the Ndc80 and Dam1 complexes, bind directly to taxol-stabilized microtubules (35-37, 46-48). These considerations motivated us to attempt reconstitution of kinetochore-microtubule coupling using a ‘bottom up’ strategy—i.e., beginning with individual microtubule-binding subcomplexes.
Methods for polycistronic expression of kinetochore subcomplexes can be found in several previously published papers (35, 36, 39, 48-50), and will be detailed elsewhere (61). For general methods of construction of polycistronic expression vectors, we refer the reader to (60). For purification, we use metal affinity based on a His6 tag fused to one protein within each subcomplex, followed by size-exclusion chromatography. The His6 tag also facilitates linking the subcomplexes to polystyrene beads (see below).
Functionalizing beads with antibody
Kinetochore subcomplexes are too small to be directly observed in a light microscope or directly manipulated with an optical trap. Therefore we couple them via antibodies to polystyrene microbeads, which serve as position markers, as ‘handles’ for optical manipulation, and as artificial cargoes (i.e., substituting for the chromosomes). We typically use streptavidin-coated polystyrene beads, 0.44 μm in diameter (Spherotech, SVP-05-10), which are further functionalized by coating with biotinylated anti-His5 antibodies (Qiagen #34440), as follows. Bead stock (1% w/v) is diluted 8-fold in BRB80 (80 mM PIPES, 1mM MgCl2, 1mM EGTA at pH 6.9) in a 0.6 mL tube. To disperse any aggregated beads, the tube is submerged in ice water (to prevent heating) beneath a tip sonicator (Branson Sonifier 450) and sonicated at medium-power for 5 minutes. After a brief spin in a benchtop centrifuge to remove liquid from the sides of the tube, antibody is then added to a final concentration of 40 μg mL-1 and the resulting mixture is incubated on a rotator for 45 minutes at 4 °C. The density of antibody on the bead surface may also be adjusted (e.g., for titration experiments) by diluting the antibody into free biotin or biotinylated-BSA before mixing with beads. Following incubation, free antibody is removed by six rounds of centrifugal pelleting (15,000 rpm for 8 min at 4 °C), supernatant removal, and resuspension in assay buffer (BRB80 supplemented with 8 mg mL-1 BSA). The resulting bead concentration can be estimated from measurements of light scatter (using a spectrophotometer) or from direct counts of the number of beads within a given volume. We typically get a final concentration of ∼60 pM (± 11%). Anti-His5-coated beads can be stored on a rotator at 4 °C for several weeks without noticeable loss of binding activity.
Growing short, stabilized microtubule seeds
Dynamic microtubules must be nucleated from a stable, anchored structure for manipulation with an optical trap. We use short microtubule ‘seeds’ grown in the slowly hydrolyzable GTP analogue guanosine-5′- [(α,β)-methyleno]triphosphate (GMPCPP) for stability. Flagellar axonemes or demembranated Tetrahymena pellicles may also be used as nucleating structures (15, 62-64). However, because these are complex organelles, they could introduce protein contaminants. Our GMPCPP-stabilized seeds are grown from a mixture of unlabeled and biotinylated tubulin (typically 70:1) for adhesion to avidin-functionalized coverslips (detailed below). Specifically, we incubate ∼70 μM bovine brain tubulin (purified as described in 65), 1 μM biotinylated tubulin (Cytoskeleton, Denver), and 1 mM GMPCPP (Jena Bioscience, Jena, Germany) in BRB80 plus 10% glycerol at 37 °C for 45 minutes. This mixture is then aliquotted, snap-frozen in liquid nitrogen and stored at -80 °C.
Creating kinetochore complex-coated beads
Kinetochore complexes are bound to beads and used in motility assays on the same day. We dilute our antibody-coated beads an additional 5-fold (to ∼12pM) in assay buffer (BRB80 supplemented with 8 mg mL-1 BSA) and then sonicate them in an ice-water bath for 2 minutes to disperse aggregates. Kinetochore components are diluted to working concentrations of 1 to 25 nM in assay buffer. Beads and kinetochore components are then mixed 1:1 (by volume) and allowed to incubate 60 to 90 minutes at 4 °C on a rotator. Unbound complex can be removed from the bead mixture at this stage by multiple rounds of centrifugal pelleting and resuspension in assay buffer. In our experiments, however, the presence or absence of excess free complex has not had any statistically significant effect on bead behavior (49).
Flow cell preparation
We construct disposable flow chambers using conventional microscope slides (Gold Seal #3011), cleaned coverslips (Corning #2940-224) and double-stick office tape (Scotch #665). As purchased from the manufacturer, coverslips are typically coated with a proprietary anti-sticking compound, which inhibits their functionalization with avidin, and gives them a rough-textured appearance in video-enhanced DIC imaging that can obscure single microtubules. To remove this coating, we clean the coverslips in a saturated solution of KOH (∼5.9 M) in ethanol. Three separate beakers of de-ionized water are used for rinsing off residual KOH-ethanol. Prior to initial use, beakers of cleaning solution and water are degassed by placing in an ultrasonic bath for 15 minutes. Coverslips are placed in a custom Teflon rack and submerged in the beaker containing KOH-ethanol. The beaker is placed in an ultrasonic bath for 10 minutes. After a quick rinse in the first water-containing beaker, the rack is immersed in the second water-containing beaker and the beaker is placed in the ultrasonic bath for 10 minutes. After a rinse in the third water-containing beaker, the racked coverslips are sprayed with ∼0.5 L of de-ionized water, followed by ∼0.5 L of ethanol and placed in an incubator (37-40 °C) for 45 minutes or until completely dry. After drying, the racks and coverslips are placed in plastic containers to prevent dust contamination.
Flow chambers consist of two lengths of double-stick tape placed across the width of a microscope slide to form an inverted channel. A cleaned coverslip is pressed onto the tape such that it forms the bottom of the channel and overhangs the slide on both sides, creating ledges that allow solutions to be pipetted and aspirated from the channel. To prevent leaking, gentle pressure must be applied to seal the coverslip to the tape. A good seal will appear relatively transparent and is free of bubbles and voids near edges.
Nucleating dynamic microtubules
Biotinylated microtubule seeds are anchored to coverslips using a simple, two-layer surface preparation based on the method of Janson et al (66). The flow chamber is first incubated with 5 mg mL-1 biotinylated-BSA (Vector Labs, Burlingame, CA) for 10 min, then washed with BRB80, followed by incubation with 0.3 mg mL-1 avidin DN (Vector Labs). A second BRB80 wash is used to remove free avidin, and then seeds are introduced. For good surface coverage, we typically dilute 4 μL seed aliquots 50-fold in warm BRB80 prior to introduction to the sample chamber. Unbound seeds are washed out with growth buffer (BRB80 plus 8 mg mL-1 BSA with 1 mM GTP). Finally, we introduce beads, diluted an additional 10-fold (to ∼0.6 pM) in growth buffer supplemented with bovine brain tubulin, 1 mM DTT, and an oxygen scavenging system consisting of 250 μg ml-1 glucose oxidase, 30 μg ml-1 catalase and 4.5 mg ml-1 glucose. Oxygen scavenging is absolutely required to maintain protein function during trap-based assays, since trap lasers damage proteins when free oxygen is present (52, 67).
Our experiments are performed at the temperature of the microscopy room (usually set at 22° C), rather than at 37° C where microtubule stability would be higher. Working at room temperature avoids the need to warm the specimen stage with a localized heat source, which can interfere with the stability of the position detection system. Typically, we include 9 to 12 μM tubulin, which is enough to grow dynamic extensions of several micrometers (despite the relatively cool temperature) while maintaining a relatively high rate of catastrophe. Higher tubulin concentrations can be used to grow longer extensions, with a concomitant decrease in the rate of spontaneous catastrophes.
The motility assay
The assay begins with a search for free beads. Once a bead is trapped, the tip of an anchored, growing microtubule filament is brought near the bead by controlling the piezo stage manually using joystick input. A good microtubule has a discernable plus-end extension (typically longer and faster-growing than the minus end) bent slightly upward from the coverslip surface by thermal motion, minimizing any potential undesirable coverslip interactions. The microtubule tip is repeatedly brought into proximity of the bead, and the signal from the position sensor is displayed in real time on an x-y plot (e.g., on an oscilloscope) to monitor bead motion in the lateral plane. A dramatic reduction in bead deflection along the microtubule axis characterizes a binding event and is usually accompanied by decreased Brownian motion of the free microtubule extension.
For initial testing and troubleshooting, it can be informative to observe bead-microtubule interactions under gentle conditions, without any trap-applied force. This is easily accomplished by shuttering the trap off once the bead binds a microtubule filament. Without tensile force, we find that Ndc80-coated beads usually diffuse randomly along the microtubule lattice, showing no particular preference for growing tips (50). In contrast, tip-attached Dam1-coated beads often undergo persistent movement coupled to microtubule growth (49), indicating that the Dam1 complex has a higher affinity for growing tips than for the microtubule lattice. Shortening microtubule tips drive Ndc80- and Dam1-coated beads alike in the direction of disassembly (49, 50, 68). Because thermal bead fluctuations are large during experiments without tensile load, high-resolution laser-based position tracking is unwarranted. Instead, we measure the durations of these events and the distances travelled by video-based tracking methods (69). Both Dam1- and Ndc80-based linkages support microtubule-driven movement across distances comparable to or exceeding the displacements of chromosomes during mitosis (49, 50).
Applying the feedback-controlled force clamp
In vivo, the linkage between a kinetochore and a microtubule tip sustains tensile load continuously, even as thousands of tubulin subunits are added and removed from the tip. To test our reconstituted couplers under continuous load, we use a computer-controlled feedback system to implement a force clamp. The clamp automatically moves the piezo stage to accommodate changes in filament length while keeping the bead-trap separation, Δx, fixed (Fig. 3). Since the optical restoring force is proportional to Δx, this automatically keeps the force constant (i.e., with RMS deviations less than 0.2 pN). Changes in filament length are then recorded by monitoring the movement of the stage.
Fig. 3. Applying continuous tension with a stage-based force clamp.
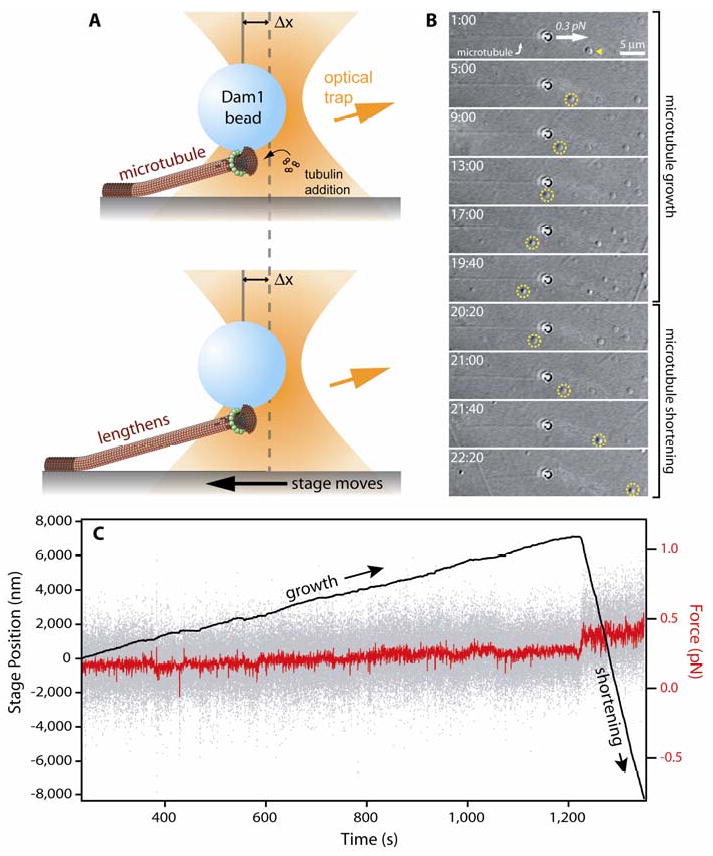
(A) Cartoon showing force clamp operation. A microbead coated with kinetochore proteins (here, the Dam1 complex) is bound to the growing tip of a microtubule. As the microtubule grows and shortens, the stage is moved automatically to keep a fixed offset, Δx, between the trapping laser and the bead, thereby maintaining a constant tensile load on the bead-microtubule interface. Dam1 complexes are depicted here to assemble into a bead-bound ring that encircles the microtubule (35, 36). However, rings are not required for coupling (e.g., see 48, 50) and they are not known to exist in vivo. Thus, the functional importance of rings remains uncertain. (B) Time-lapse images showing a Dam1 complex-coated bead tracking with microtubule growth (1 min:00 sec to 19:40) and shortening (20:20 to 22:20) under constant force (0.25 pN and 0.4 pN, during growth and shortening, respectively). The stage is moved leftward during growth, as evident by a coverslip-adsorbed fiducial (yellow arrowhead, circles), and rightward during shortening. (C) Record of stage position (black trace) and force (instantaneous, gray trace; average, red trace) versus time for the event shown in (B).
Using stage-based feedback to clamp the force provides numerous benefits. Most importantly, it allows continuous loading during long-distance movements, up to the maximum travel of the piezo stage (100 μm), which is essential for tracking the micrometer-scale movements produced in our assays. Simpler fixed trap systems, such as those used previously to study force production via biotin-avidin linkages to disassembling microtubules (62), can only measure displacements < 200 nm, because of the small size of the trap. A second benefit is that keeping the force constant simplifies data interpretation, since bead movement in this case is a direct reflection of the movement of the molecular coupler. In contrast, bead displacements measured without a force clamp are attenuated—by an unknown fraction that can vary with force—relative to that of the coupler, owing to its series elastic compliance (9, 59). A third benefit is that continuous tensile force facilitates collection of records with higher spatiotemporal resolution, since tension suppresses Brownian fluctuations. With a few pN of tension, our assay typically yields recordings with ∼5 nm RMS noise, a vast improvement over the ∼300 nm RMS noise typical of our records from experiments without load. Further improvement may be possible if higher forces can be sustained.
When positioned at the tip of a growing microtubule and placed under 0.5 to 3 pN of continuous tension, a bead coated with either the Dam1 or Ndc80 kinetochore complex often remains tip-bound, moving slowly away from the anchored seed as the filament lengthens by several micrometers or more (49-51). Depending on the catastrophe frequency, the bead sometimes remains attached long enough for the microtubule to undergo a spontaneous catastrophe and begin shortening, driving the bead back toward the seed and performing mechanical work against the load of the optical trap (Fig. 3). These observations show that Dam1- and Ndc80-based linkages can make a direct and significant contribution to kinetochore-microtubule coupling and microtubule-driven force production.
A word of caution is in order regarding comparative single molecule measurements. Although rarely mentioned, it is common to observe considerable variability in behavior from molecule to molecule, filament to filament, slide to slide, day to day, and protein preparation to preparation, even in the simplest of single molecule assays (e.g., even in studies of individual kinesin motors). Consequently, small datasets are untrustworthy, since they can misleadingly show apparent differences between conditions that represent random variability rather than true, statistically significant differences. To guard against this, we pool many measurements made across multiple days and multiple protein preparations whenever possible. An advantage of the in vitro methods described here is that very little protein is required per experiment, so small preparations are usually adequate for many repetitions.
New and improved: ramping instead of clamping, and laser scissors
Recently we added two new features to our trapping instruments to improve versatility and productivity. The first improvement was to create a force ramp that gradually increases the applied force. Ramping the force is useful for determining rupture force distributions, as a measure of attachment robustness. To implement a simple force ramp, we modified our previously-developed force clamp software so that the bead-trap separation, rather than being held constant, is increased gradually at a user-specified constant rate (and the trap power remains fixed). This scheme allows ramping from roughly 10% to 100% of the maximum (escape) force that the trap is capable of exerting. An alternative scheme, where the trap power is increased while the bead-trap separation is held fixed, would provide greater dynamic range but it requires additional optical elements (e.g., an acousto-optic modulator) (59). Using our force ramp, we are beginning to test whether Dam1 and Ndc80 complexes working in tandem form load-bearing attachments that are more processive and support greater loads than either complex alone.
In previous work we measured disassembly-driven movement under force by waiting for catastrophes, spontaneous switches from growth to shortening (51). Since the beads often detached prior to catastrophe, collecting a large, statistically significant data set was difficult. The task would be easier if one could induce microtubule disassembly at will. Several novel methods for this have been described, including photodamage of stabilizing fluorescent GMPCPP caps (62), mechanical severing of filaments by a microneedle (70), and filament severing by a UV laser (71). We sought a method that could be easily incorporated into our existing system without requiring fluorescent GMPCPP caps. The transmissivity of our objective precluded addition of a UV laser, and our need for oil-immersion on both sides of the sample (for imaging microtubules by DIC) made addition of a microneedle difficult. Instead, we found that an inexpensive, 100 mW, 473 nm blue laser (LaserPath Technologies, DPSS-473-100) focused to a narrow ellipse cuts microtubules within seconds of initial exposure, even in the presence of oxygen scavenger, inducing disassembly of any remaining lattice (Fig. 4). This ‘laser scissor’ is introduced via an auxiliary port on the microscope body and reflected into the objective by a dichroic mounted in the standard Nikon fluorescence filter cube turret. The blue laser is aligned so that its focus is offset several microns from the trapping laser, ensuring that it does not interfere with trap operation. Individual microtubules are cut by moving the stage so that the blue laser impinges on the filament when a manual shutter is opened.
Fig. 4. Inducing microtubule disassembly with laser scission.
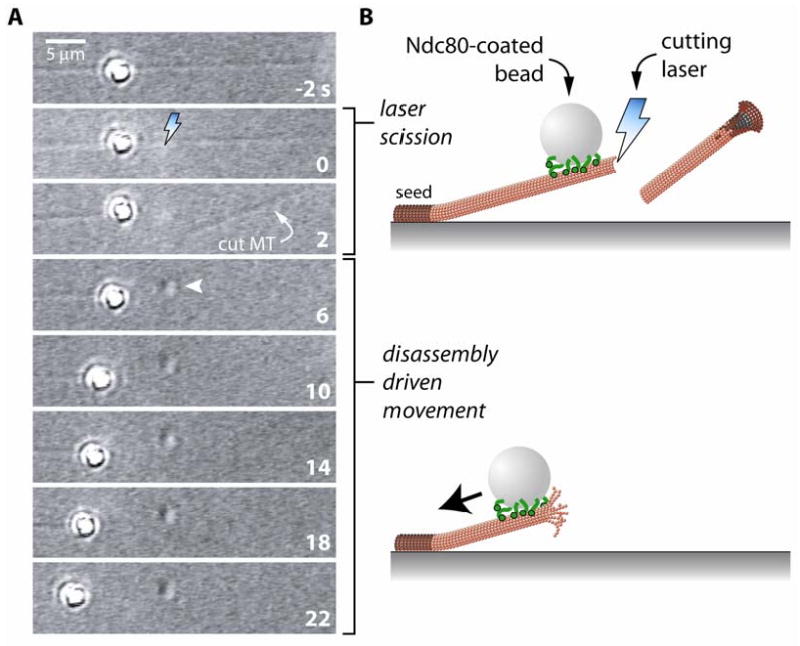
(A) Time-lapse images and (B) cartoons showing laser scission-induced disassembly of a dynamic, coverslip-anchored microtubule. At t = -2 s, an Ndc80 complex-coated bead is bound to the lattice of a dynamic microtubule. The microtubule is then cut by brief exposure to a 473 nm cutting laser (lightning bolt), causing the severed portion of the filament to diffuse away and inducing disassembly of the newly created tip (t = 2 s). Exposure to the cutting laser leaves a mark on the coverslip surface (arrowhead). When it reaches the lattice-bound bead, the disassembling tip drives bead movement toward the microtubule seed.
Relevance to Kinetochore Biology
A fundamental unanswered question about kinetochore function is which components participate in formation of load-bearing attachments to dynamic microtubule tips. Feedback-controlled optical trapping is already helping to answer this question by enabling quantitative assessment of coupling performance in reconstituted systems. For example, the performance of Ndc80- and Dam1-based couplers is comparable in many ways to the behavior of kinetochore-microtubule linkages during mitosis, indicating that these subcomplexes probably make a direct and significant contribution in vivo. Other components are also likely to participate. For example, a network of three subcomplexes, the Ndc80 complex, the Mtw1 complex (also called MIND or the Mis12 complex), and Spc105 (also called Blinkin or Knl-1), may act cooperatively to form the core, conserved microtubule-binding interface of the outer kinetochore (37). Comparative measurements of the coupling performance of these subcomplexes, both individually and in various combinations, will allow their contributions to kinetochore-microtubule attachment to be mapped.
Our optical force clamp has also enabled us to study how tensile forces, transmitted through specific tip-attached proteins, affect the dynamics of microtubules. Force-dependent microtubule regulation is often invoked to explain how the intrinsically random growth and shortening of spindle microtubules is controlled to achieve much more orderly behaviors that are hallmarks of mitosis, such as the congression and coordinated oscillations of sister kinetochores (72), the formation of spindles of stereotypical size (73), and the positioning of spindles (or nuclei) centrally within dividing cells (74). By using our feedback-controlled optical trap, we demonstrated for the first time that tension transmitted through a kinetochore component (the Dam1 complex) affects microtubule shortening speed, catastrophe frequency (the rate of switching from growth to shortening) and rescue frequency (the rate of switching from shortening to growth) (51). These effects may explain how sister kinetochores oscillate in a coordinated fashion by tugging on one another to induce nearly-synchronous reversals in direction (72), and how kinetochore movements may be influenced by gradients in ‘polar ejection forces’ to bring chromosomes to the equator during metaphase (75). In principle, tension-dependent regulatory effects might also occur at spindle poles and the cell cortex, where they could help control spindle size and position.
Conclusion
The utility of optical trapping for biophysics comes from its ability to measure forces and movements generated by molecular systems, with high spatiotemporal resolution. Given the importance of force production at kinetochores and the regulatory effects of force on kinetochore-microtubule attachments, quantitative studies using optical traps should continue to provide key insights into kinetochore function.
Footnotes
Publisher's Disclaimer: This is a PDF file of an unedited manuscript that has been accepted for publication. As a service to our customers we are providing this early version of the manuscript. The manuscript will undergo copyediting, typesetting, and review of the resulting proof before it is published in its final citable form. Please note that during the production process errors may be discovered which could affect the content, and all legal disclaimers that apply to the journal pertain.
References
- 1.Sheetz MP, Spudich JA. Nature. 1983;303:31–5. doi: 10.1038/303031a0. [DOI] [PubMed] [Google Scholar]
- 2.Vale RD, Reese TS, Sheetz MP. Cell. 1985;42:39–50. doi: 10.1016/s0092-8674(85)80099-4. [DOI] [PMC free article] [PubMed] [Google Scholar]
- 3.Asbury CL. Curr Opin Cell Biol. 2005;17:89–97. doi: 10.1016/j.ceb.2004.12.002. [DOI] [PubMed] [Google Scholar]
- 4.Howard J, Hudspeth AJ, Vale RD. Nature. 1989;342:154–8. doi: 10.1038/342154a0. [DOI] [PubMed] [Google Scholar]
- 5.Block SM, Goldstein LS, Schnapp BJ. Nature. 1990;348:348–52. doi: 10.1038/348348a0. [DOI] [PubMed] [Google Scholar]
- 6.Spudich JA. Nat Rev Mol Cell Biol. 2001;2:387–92. doi: 10.1038/35073086. [DOI] [PubMed] [Google Scholar]
- 7.Vale RD. J Cell Biol. 2003;163:445–50. doi: 10.1083/jcb.200308093. [DOI] [PMC free article] [PubMed] [Google Scholar]
- 8.Block SM. Biophys J. 2007;92:2986–95. doi: 10.1529/biophysj.106.100677. [DOI] [PMC free article] [PubMed] [Google Scholar]
- 9.Svoboda K, Schmidt CF, Schnapp BJ, Block SM. Nature. 1993;365:721–7. doi: 10.1038/365721a0. [DOI] [PubMed] [Google Scholar]
- 10.Asbury CL, Fehr AN, Block SM. Science. 2003;302:2130–4. doi: 10.1126/science.1092985. [DOI] [PMC free article] [PubMed] [Google Scholar]
- 11.Sakamoto T, Webb MR, Forgacs E, White HD, Sellers JR. Nature. 2008;455:128–32. doi: 10.1038/nature07188. [DOI] [PMC free article] [PubMed] [Google Scholar]
- 12.Inoue S, Salmon ED. Mol Biol Cell. 1995;6:1619–40. doi: 10.1091/mbc.6.12.1619. [DOI] [PMC free article] [PubMed] [Google Scholar]
- 13.Nicklas RB. Science. 1997;275:632–7. doi: 10.1126/science.275.5300.632. [DOI] [PubMed] [Google Scholar]
- 14.Koshland DE, Mitchison TJ, Kirschner MW. Nature. 1988;331:499–504. doi: 10.1038/331499a0. [DOI] [PubMed] [Google Scholar]
- 15.Coue M, Lombillo VA, McIntosh JR. J Cell Biol. 1991;112:1165–75. doi: 10.1083/jcb.112.6.1165. [DOI] [PMC free article] [PubMed] [Google Scholar]
- 16.Mitchison TJ, Kirschner MW. J Cell Biol. 1985;101:766–77. doi: 10.1083/jcb.101.3.766. [DOI] [PMC free article] [PubMed] [Google Scholar]
- 17.Sorger PK, Severin FF, Hyman AA. J Cell Biol. 1994;127:995–1008. doi: 10.1083/jcb.127.4.995. [DOI] [PMC free article] [PubMed] [Google Scholar]
- 18.Biggins S, Severin FF, Bhalla N, Sassoon I, Hyman AA, Murray AW. Genes Dev. 1999;13:532–44. doi: 10.1101/gad.13.5.532. [DOI] [PMC free article] [PubMed] [Google Scholar]
- 19.Sassoon I, Severin FF, Andrews PD, Taba MR, Kaplan KB, Ashford AJ, Stark MJ, Sorger PK, Hyman AA. Genes Dev. 1999;13:545–55. doi: 10.1101/gad.13.5.545. [DOI] [PMC free article] [PubMed] [Google Scholar]
- 20.McAinsh AD, Tytell JD, Sorger PK. Annu Rev Cell Dev Biol. 2003;19:519–39. doi: 10.1146/annurev.cellbio.19.111301.155607. [DOI] [PubMed] [Google Scholar]
- 21.Westermann S, Drubin DG, Barnes G. Annu Rev Biochem. 2007;76:563–91. doi: 10.1146/annurev.biochem.76.052705.160607. [DOI] [PubMed] [Google Scholar]
- 22.Cheeseman IM, Desai A. Nat Rev Mol Cell Biol. 2008;9:33–46. doi: 10.1038/nrm2310. [DOI] [PubMed] [Google Scholar]
- 23.Cheeseman IM, Anderson S, Jwa M, Green EM, Kang J, Yates JR, 3rd, Chan CS, Drubin DG, Barnes G. Cell. 2002;111:163–72. doi: 10.1016/s0092-8674(02)00973-x. [DOI] [PubMed] [Google Scholar]
- 24.De Wulf P, McAinsh AD, Sorger PK. Genes Dev. 2003;17:2902–21. doi: 10.1101/gad.1144403. [DOI] [PMC free article] [PubMed] [Google Scholar]
- 25.Westermann S, Cheeseman IM, Anderson S, Yates JR, 3rd, Drubin DG, Barnes G. J Cell Biol. 2003;163:215–22. doi: 10.1083/jcb.200305100. [DOI] [PMC free article] [PubMed] [Google Scholar]
- 26.Nekrasov VS, Smith MA, Peak-Chew S, Kilmartin JV. Mol Biol Cell. 2003;14:4931–46. doi: 10.1091/mbc.E03-06-0419. [DOI] [PMC free article] [PubMed] [Google Scholar]
- 27.Hazbun TR, Malmstrom L, Anderson S, Graczyk BJ, Fox B, Riffle M, Sundin BA, Aranda JD, McDonald WH, Chiu CH, Snydsman BE, Bradley P, Muller EG, Fields S, Baker D, Yates JR, 3rd, Davis TN. Mol Cell. 2003;12:1353–65. doi: 10.1016/s1097-2765(03)00476-3. [DOI] [PubMed] [Google Scholar]
- 28.Wigge PA, Kilmartin JV. J Cell Biol. 2001;152:349–60. doi: 10.1083/jcb.152.2.349. [DOI] [PMC free article] [PubMed] [Google Scholar]
- 29.Cheeseman IM, Brew C, Wolyniak M, Desai A, Anderson S, Muster N, Yates JR, Huffaker TC, Drubin DG, Barnes G. J Cell Biol. 2001;155:1137–45. doi: 10.1083/jcb.200109063. [DOI] [PMC free article] [PubMed] [Google Scholar]
- 30.Janke C, Ortiz J, Tanaka TU, Lechner J, Schiebel E. Embo J. 2002;21:181–93. doi: 10.1093/emboj/21.1.181. [DOI] [PMC free article] [PubMed] [Google Scholar]
- 31.Li Y, Bachant J, Alcasabas AA, Wang Y, Qin J, Elledge SJ. Genes Dev. 2002;16:183–97. doi: 10.1101/gad.959402. [DOI] [PMC free article] [PubMed] [Google Scholar]
- 32.Welburn JP, Grishchuk EL, Backer CB, Wilson-Kubalek EM, Yates JR, 3rd, Cheeseman IM. Dev Cell. 2009;16:374–85. doi: 10.1016/j.devcel.2009.01.011. [DOI] [PMC free article] [PubMed] [Google Scholar]
- 33.Gaitanos TN, Santamaria A, Jeyaprakash AA, Wang B, Conti E, Nigg EA. Embo J. 2009;28:1442–52. doi: 10.1038/emboj.2009.96. [DOI] [PMC free article] [PubMed] [Google Scholar]
- 34.Lechner J, Carbon J. Cell. 1991;64:717–25. doi: 10.1016/0092-8674(91)90501-o. [DOI] [PubMed] [Google Scholar]
- 35.Miranda JJ, De Wulf P, Sorger PK, Harrison SC. Nat Struct Mol Biol. 2005;12:138–43. doi: 10.1038/nsmb896. [DOI] [PubMed] [Google Scholar]
- 36.Westermann S, Avila-Sakar A, Wang HW, Niederstrasser H, Wong J, Drubin DG, Nogales E, Barnes G. Mol Cell. 2005;17:277–90. doi: 10.1016/j.molcel.2004.12.019. [DOI] [PubMed] [Google Scholar]
- 37.Cheeseman IM, Chappie JS, Wilson-Kubalek EM, Desai A. Cell. 2006;127:983–97. doi: 10.1016/j.cell.2006.09.039. [DOI] [PubMed] [Google Scholar]
- 38.Ciferri C, De Luca J, Monzani S, Ferrari KJ, Ristic D, Wyman C, Stark H, Kilmartin J, Salmon ED, Musacchio A. J Biol Chem. 2005;280:29088–95. doi: 10.1074/jbc.M504070200. [DOI] [PubMed] [Google Scholar]
- 39.Wei RR, Sorger PK, Harrison SC. Proc Natl Acad Sci U S A. 2005;102:5363–7. doi: 10.1073/pnas.0501168102. [DOI] [PMC free article] [PubMed] [Google Scholar]
- 40.Wan X, O'Quinn RP, Pierce HL, Joglekar AP, Gall WE, DeLuca JG, Carroll CW, Liu ST, Yen TJ, McEwen BF, Stukenberg PT, Desai A, Salmon ED. Cell. 2009;137:672–84. doi: 10.1016/j.cell.2009.03.035. [DOI] [PMC free article] [PubMed] [Google Scholar]
- 41.Emanuele MJ, McCleland ML, Satinover DL, Stukenberg PT. Mol Biol Cell. 2005;16:4882–92. doi: 10.1091/mbc.E05-03-0239. [DOI] [PMC free article] [PubMed] [Google Scholar]
- 42.Joglekar AP, Bouck DC, Molk JN, Bloom KS, Salmon ED. Nat Cell Biol. 2006;8:581–5. doi: 10.1038/ncb1414. [DOI] [PMC free article] [PubMed] [Google Scholar]
- 43.Joglekar AP, Bloom K, Salmon ED. Curr Biol. 2009;19:694–9. doi: 10.1016/j.cub.2009.02.056. [DOI] [PMC free article] [PubMed] [Google Scholar]
- 44.DeLuca JG, Dong Y, Hergert P, Strauss J, Hickey JM, Salmon ED, McEwen BF. Mol Biol Cell. 2005;16:519–31. doi: 10.1091/mbc.E04-09-0852. [DOI] [PMC free article] [PubMed] [Google Scholar]
- 45.DeLuca JG, Gall WE, Ciferri C, Cimini D, Musacchio A, Salmon ED. Cell. 2006;127:969–82. doi: 10.1016/j.cell.2006.09.047. [DOI] [PubMed] [Google Scholar]
- 46.Ciferri C, Pasqualato S, Screpanti E, Varetti G, Santaguida S, Dos Reis G, Maiolica A, Polka J, De Luca JG, De Wulf P, Salek M, Rappsilber J, Moores CA, Salmon ED, Musacchio A. Cell. 2008;133:427–39. doi: 10.1016/j.cell.2008.03.020. [DOI] [PMC free article] [PubMed] [Google Scholar]
- 47.Wei RR, Al-Bassam J, Harrison SC. Nat Struct Mol Biol. 2007;14:54–9. doi: 10.1038/nsmb1186. [DOI] [PubMed] [Google Scholar]
- 48.Gestaut DR, Graczyk B, Cooper J, Widlund PO, Zelter A, Wordeman L, Asbury CL, Davis TN. Nat Cell Biol. 2008;10:407–14. doi: 10.1038/ncb1702. [DOI] [PMC free article] [PubMed] [Google Scholar]
- 49.Asbury CL, Gestaut DR, Powers AF, Franck AD, Davis TN. Proc Natl Acad Sci U S A. 2006;103:9873–8. doi: 10.1073/pnas.0602249103. [DOI] [PMC free article] [PubMed] [Google Scholar]
- 50.Powers AF, Franck AD, Gestaut DR, Cooper J, Gracyzk B, Wei RR, Wordeman L, Davis TN, Asbury CL. Cell. 2009;136:865–75. doi: 10.1016/j.cell.2008.12.045. [DOI] [PMC free article] [PubMed] [Google Scholar]
- 51.Franck AD, Powers AF, Gestaut DR, Gonen T, Davis TN, Asbury CL. Nat Cell Biol. 2007;9:832–7. doi: 10.1038/ncb1609. [DOI] [PMC free article] [PubMed] [Google Scholar]
- 52.Neuman KC, Block SM. Rev Sci Instrum. 2004;75:2787–809. doi: 10.1063/1.1785844. [DOI] [PMC free article] [PubMed] [Google Scholar]
- 53.Ashkin A, Dziedzic JM, Yamane T. Nature. 1987;330:769–71. doi: 10.1038/330769a0. [DOI] [PubMed] [Google Scholar]
- 54.Ashkin A, Dziedzic JM. Science. 1987;235:1517–20. doi: 10.1126/science.3547653. [DOI] [PubMed] [Google Scholar]
- 55.Lang MJ, Block SM. Am J Phys. 2003;71:201–15. doi: 10.1119/1.1532323. [DOI] [PMC free article] [PubMed] [Google Scholar]
- 56.Bormuth V, Howard J, Schaffer E. J Microsc. 2007;226:1–5. doi: 10.1111/j.1365-2818.2007.01756.x. [DOI] [PubMed] [Google Scholar]
- 57.Lang MJ, Asbury CL, Shaevitz JW, Block SM. Biophys J. 2002;83:491–501. doi: 10.1016/S0006-3495(02)75185-0. [DOI] [PMC free article] [PubMed] [Google Scholar]
- 58.Svoboda K, Block SM. Annu Rev Biophys Biomol Struct. 1994;23:247–85. doi: 10.1146/annurev.bb.23.060194.001335. [DOI] [PubMed] [Google Scholar]
- 59.Visscher K, Block SM. Methods Enzymol. 1998;298:460–89. doi: 10.1016/s0076-6879(98)98040-5. [DOI] [PubMed] [Google Scholar]
- 60.Tan S. Protein Expr Purif. 2001;21:224–34. doi: 10.1006/prep.2000.1363. [DOI] [PubMed] [Google Scholar]
- 61.Gestaut D, Asbury C, Davis TN. Methods Cell Biol. 2009 doi: 10.1016/S0091-679X(10)95032-2. in preparation. [DOI] [PMC free article] [PubMed] [Google Scholar]
- 62.Grishchuk EL, Molodtsov MI, Ataullakhanov FI, McIntosh JR. Nature. 2005;438:384–88. doi: 10.1038/nature04132. [DOI] [PubMed] [Google Scholar]
- 63.Lombillo VA, Coue M, McIntosh JR. Methods Cell Biol. 1993;39:149–65. doi: 10.1016/s0091-679x(08)60168-5. [DOI] [PubMed] [Google Scholar]
- 64.Walker RA, O'Brien ET, Pryer NK, Soboeiro MF, Voter WA, Erickson HP, Salmon ED. J Cell Biol. 1988;107:1437–48. doi: 10.1083/jcb.107.4.1437. [DOI] [PMC free article] [PubMed] [Google Scholar]
- 65.Castoldi M, Popov AV. Protein Expr Purif. 2003;32:83–8. doi: 10.1016/S1046-5928(03)00218-3. [DOI] [PubMed] [Google Scholar]
- 66.Janson ME, de Dood ME, Dogterom M. J Cell Biol. 2003;161:1029–34. doi: 10.1083/jcb.200301147. [DOI] [PMC free article] [PubMed] [Google Scholar]
- 67.Neuman KC, Chadd EH, Liou GF, Bergman K, Block SM. Biophys J. 1999;77:2856–63. doi: 10.1016/S0006-3495(99)77117-1. [DOI] [PMC free article] [PubMed] [Google Scholar]
- 68.Westermann S, Wang HW, Avila-Sakar A, Drubin DG, Nogales E, Barnes G. Nature. 2006;440:565–69. doi: 10.1038/nature04409. [DOI] [PubMed] [Google Scholar]
- 69.Gelles J, Schnapp BJ, Sheetz MP. Nature. 1988;331:450–3. doi: 10.1038/331450a0. [DOI] [PubMed] [Google Scholar]
- 70.Tran PT, Walker RA, Salmon ED. J Cell Biol. 1997;138:105–17. doi: 10.1083/jcb.138.1.105. [DOI] [PMC free article] [PubMed] [Google Scholar]
- 71.Walker RA, Inoue S, Salmon ED. J Cell Biol. 1989;108:931–7. doi: 10.1083/jcb.108.3.931. [DOI] [PMC free article] [PubMed] [Google Scholar]
- 72.Skibbens RV, Skeen VP, Salmon ED. J Cell Biol. 1993;122:859–75. doi: 10.1083/jcb.122.4.859. [DOI] [PMC free article] [PubMed] [Google Scholar]
- 73.Goshima G, Wollman R, Stuurman N, Scholey JM, Vale RD. Curr Biol. 2005;15:1979–88. doi: 10.1016/j.cub.2005.09.054. [DOI] [PubMed] [Google Scholar]
- 74.Daga RR, Yonetani A, Chang F. Curr Biol. 2006;16:1544–50. doi: 10.1016/j.cub.2006.06.026. [DOI] [PubMed] [Google Scholar]
- 75.Rieder CL, Salmon ED. J Cell Biol. 1994;124:223–33. doi: 10.1083/jcb.124.3.223. [DOI] [PMC free article] [PubMed] [Google Scholar]