Abstract
OBJECTIVE
Although MRI is the technique of choice for evaluating most soft-tissue masses, CT often provides valuable complementary information. Specifically, there are distinguishing CT characteristics that can suggest a specific diagnosis, including the lesion’s mineralization pattern, density, pattern of adjacent bone involvement, and degree and pattern of vascularity.
CONCLUSION
This article provides an overview of the CT evaluation of soft-tissue masses, emphasizing a differential diagnosis based on these CT features.
Keywords: characterization, CT, musculoskeletal imaging, soft-tissue mass
Soft-tissue tumors are defined as mesenchymal proliferations that occur in extraskeletal nonepithelial tissues of the body, excluding the viscera, meninges, and lymphoreticular system [1, 2]. CT has long been used to characterize the composition and anatomic location of soft-tissue masses [3-5] and has been known for several decades to be able to distinguish benign from malignant processes [6, 7]. Recently, MRI has become the diagnostic technique of choice because of its excellent soft-tissue contrast for this large and heterogeneous group of tumors with many overlapping features [8-11]. However, the ubiquity of CT, its faster examination times, and its superior patient tolerance compared with MRI have contributed to its exponential growth in utilization, even with regard to musculoskeletal examinations [12]. This fact dictates that the radiologist be familiar with CT features of soft-tissue tumors, as well as mimickers of tumors; moreover, the radiologist must be aware of what distinctive information is provided by CT compared with MRI.
One of the most important roles of CT is in providing useful clues for the characterization of soft-tissue lesions. CT has been shown to provide a more comprehensive assessment of soft-tissue tumors with regard to patterns of matrix mineralization and patterns of cortical and marrow involvement [13-15]. With 3D reconstructions, CT can also be a useful adjunct in the characterization of lesion vascularity [16]. In this article, we briefly review technical considerations for performing CT for the evaluation of soft-tissue masses, outline the role that CT plays for the diagnosis of these masses, and delineate what information may be gained for treatment planning. Four distinguishing features that can be used to characterize soft-tissue masses by CT are presented, including the mineralization pattern, density, pattern of bone involvement, and lesion vascularity.
Technique
Although the use of older generation scanners is adequate, the advent of advanced MDCT with isotropic resolution data sets allows multiplanar reformatted thin-section images and the creation of 3D CT images to provide comprehensive information about the internal architecture of a mass. For the cases described here, IV contrast material was administered using 120 mL of nonionic contrast medium (iohexol [Omnipaque 350, GE Healthcare]) at a rate of 2–4 mL/s with a typical scan delay of 30–80 seconds. After initial axial acquisition at 0.75-mm slice thickness, 2D multiplanar reconstructions and maximum intensity projections for CT angiography images were created. In all cases where an isotropic imaging data set was obtained, 3D imaging was created on a workstation (Leonardo, Siemens Healthcare) using InSpace software (Siemens Healthcare).
Four Distinguishing CT Characteristics of Soft-Tissue Masses
Mineralization Pattern
Mineralization within soft-tissue masses can result from ossification or calcification or both [13] and produces the appearance of high-density material on radiographs or CT scans. The pattern and morphologic characteristics of mineralization can be a clue to a soft-tissue mass’s cause, and hence, suggest a histologic diagnosis. With MRI, the identification of mineralization within a soft-tissue mass is often limited because of the variable signal intensity of calcium [17, 18]. Also, subtle matrix mineralization that is not detectable by radiography is made apparent by CT [19-21]. Although it is not always possible with imaging, an attempt should be made to distinguish calcification, which is due to dystrophic or metabolic deposition of insoluble calcium phosphate salts in the soft tissues, from ossification, which marked by trabecular bone formation [19, 22] (Table 1).
TABLE 1.
Distinguishing Features of Matrix Mineralization in Soft-Tissue Masses
| Dystrophic Calcification | Metastatic Calcification | Ossification |
|---|---|---|
| Cortex Absent | Cortex Absent | Cortex Present |
| Underlying tissue damage | Underlying metabolic abnormality | Underlying tissue damage or mineralized matrix produced by neoplasm |
| Normal calcium and phosphate levels | Calcium × phosphate product > 60, or after renal transplantation | Normal calcium and phosphate levels |
| Amorphous or punctuate | Finely speckled or large amorphous, globular | Trabecular bone formation |
Nonneoplastic dystrophic and metastatic calcification
Soft-tissue calcification has a broad differential diagnosis, although most often it is the result of dystrophic calcification in damaged or inflamed soft tissues or an underlying metabolic abnormality (known as metastatic calcification). The myriad causes of dystrophic calcification include vascular (within thrombus), infectious, traumatic, autoimmune, and neoplastic causes [23]. Vascular calcifications, or phleboliths, are very common in asymptomatic individuals but can also be a feature suggestive of hemangiomas and venous vascular malformations [24-26]. Radiographs often show a radiolucent center, although this has been shown to be unreliable on CT, possibly because of differences in kilovoltage [27]. The association with a soft-tissue tail sign representing the vein or venous plexus in which it is located has been reported to be a specific CT feature of phleboliths, although it lacks sensitivity [28].
Sheetlike patterns of calcification in the skin, subcutaneous tissue, and fascial planes (calcinosis universalis) can be seen in association with autoimmune connective tissue disorders, such as polymyositis or dermatomyositis [29, 30], as shown in Figure 1. Periarticular deposits of calcium due to metastatic calcification are commonly seen in chronic renal failure (Fig. 2) but can also be seen after traumatic or neurologic insult [29]. Gouty tophi composed of monosodium urate crystals can present as soft-tissue masses with mean attenuation values of approximately 160 HU [31] (Fig. 3), and metastatic or dystrophic calcification within these tophi are best seen on CT [32].
Fig. 1.
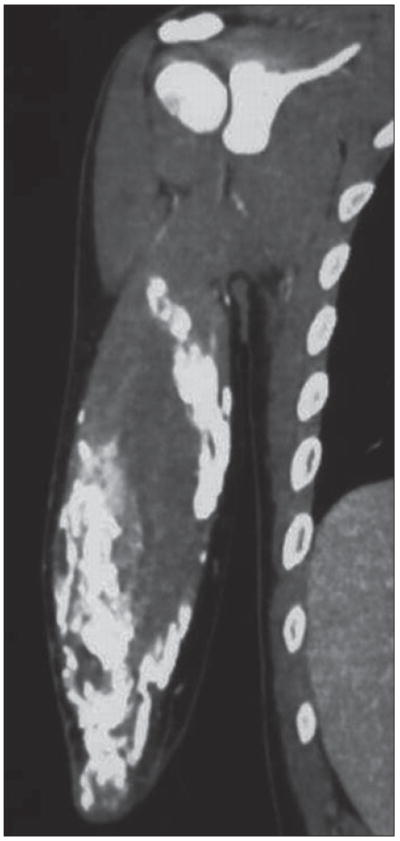
58-year-old man with dermatomyositis. Coronal CT multiplanar reconstruction shows sheetlike calcifications around biceps brachii muscle, appearance termed calcinosis universalis. Such subcutaneous and soft-tissue calcifications can be seen in other connective tissue disorders, notably scleroderma.
Fig. 2.
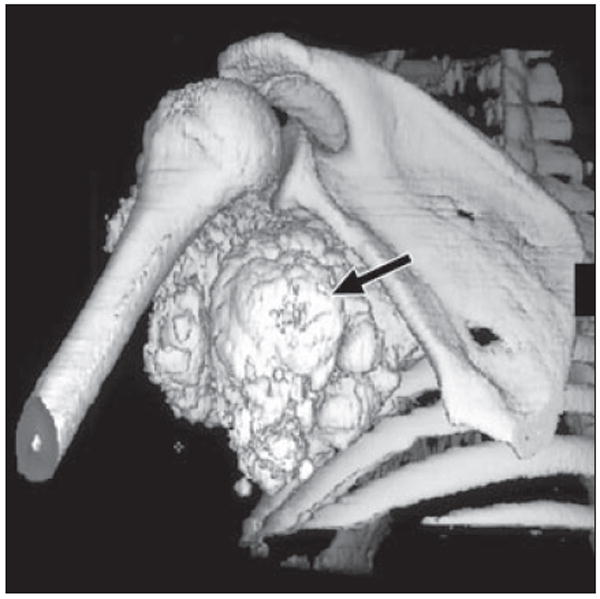
39-year-old man with metastatic calcification in end-stage renal disease due to glomerulonephritis. Patient had elevated serum calcium and presented with soft-tissue mass (arrow) in his left axillary recess that was encasing his brachial plexus, resulting in arm pain and weakness. Shaded surface display image from axial oblique perspective of left shoulder depicts relationship of mass to adjacent shoulder girdle, useful for surgical planning.
Fig. 3.

69-year-old man with gout. Patient presented with swelling and pain in left arm. Coronal volume-rendered CT image shows soft tissue mass posterior to olecranon with amorphous calcification (arrow), consistent with soft-tissue tophus. Tophaceous gout typically presents as juxtaarticular lobulated soft tissue mass, occasionally with calcifications, and has predilection for olecranon and prepatellar regions. Incidental cardiac pacemaker is seen in upper left chest.
Periarticular calcification is relatively nonspecific and can also be seen after traumatic or neurologic insult. A dense homogeneous calcified mass with interspersed fibrous septae is suggestive of idiopathic tumoral calcinosis, which can also reveal fluid-calcium levels on CT [29, 33]. Extraarticular deposition of calcium hydroxyapatite crystals in the tendons, commonly called calcific tendinitis, is usually evident on radiographs around more mobile joints, although an atypical location or associated cortical erosion identified on CT can lead to unnecessary workup [34, 35]. When located intraarticularly, round symmetric calcified bodies that are associated with cortical scalloping suggest synovial chondromatosis (Fig. 4).
Fig. 4.
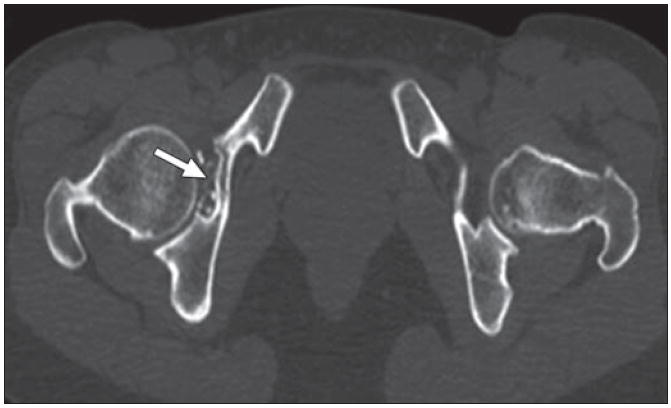
37-year-old woman with synovial chondromatosis. Intraarticular calcified bodies in right hip are seen on axial CT. Note associated cortical scalloping of acetabulum (arrow), all features of synovial chondromatosis.
Nonneoplastic ossification
Benign heterotopic ossification in the soft tissues can be seen after localized trauma, neurologic injury, or, rarely, in hereditary forms, such as myositis ossificans progressiva (now referred to as fibrodysplasia ossificans) [36]. The clinical history and distribution of the disease are important etiologic clues, with the hip, shoulder, knee, and elbow being the most commonly affected joints in the neurogenic form. Heterotopic ossification following trauma (myositis ossificans traumatica) is characterized initially by the appearance of floccular calcifications approximately 3 weeks after injury. After 6–8 weeks, lamellar bone with well-defined cortex forms [37]. Intermediate heterotopic ossification often shows a distinctive peripheral rim of dense mineralization, the so-called eggshell ossification [10], as seen in Figure 5. More mature heterotopic ossification often shows a well-defined peripheral cortex and inner trabecular pattern of mineralization.
Fig. 5.
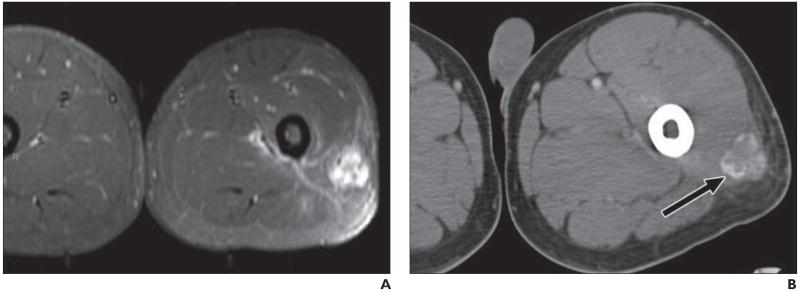
21-year-old man presenting with several-week-long history of painful mass in his left thigh that was “growing by day.” Patient denied history of trauma, and radiography results were negative.
A, MRI shows nonspecific soft-tissue mass in posterolateral thigh with diffuse enhancement and surrounding edema, as seen on fat-saturated axial T1-weighted image obtained after administration of gadolinium contrast agent.
B, Follow-up CT suggests final diagnosis of heterotopic ossification (myositis ossificans) by revealing characteristic peripheral zone (“eggshell”) of ossification (arrow). Patients with myositis ossificans are frequently young patients without known history of trauma, and thigh is most common location. Rim of mineralization is typically seen on CT by 4–6 weeks and is important discriminator from soft-tissue tumor.
Neoplastic conditions with mineralization
When soft-tissue tumors generate an osteoid or chondroid extracellular matrix, distinctive mineralization patterns may suggest a histologic diagnosis. Cloudlike matrix mineralization in a smooth pattern that progressively increases in density toward the center is typical of osteoid matrix (Fig. 6), although a ground-glass appearance can also be seen. In contrast, calcifications in rings and arcs, with or without dense punctate, stippled, or flocculent calcification, are classic for chondroid mineralization [38] (Fig. 7). The rings and arcs pattern of mineralization is due to calcification developing around lobules of cartilage. It should be noted that both of these patterns are associated with benign and malignant entities. In addition, other malignant soft-tissue tumors, particularly synovial cell sarcoma (Fig. 8), may exhibit metaplastic bone formation, though production of definitive osteoid matrix in such tumors is rare [29, 39].
Fig. 6.
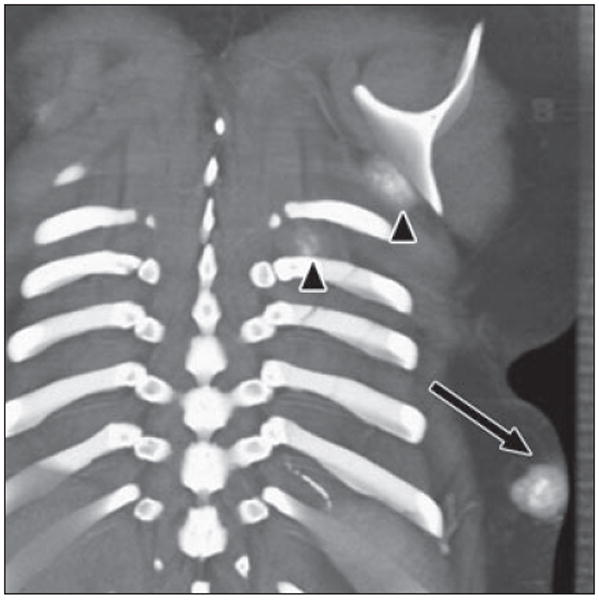
17-year-old girl with history of osteosarcoma of left fibula. Coronal volume-rendered image reveals mass within subcutaneous tissues of posterior left lower chest with cloudlike calcification (arrow), consistent with soft-tissue metastasis due to osteosarcoma. Two smaller masses are seen inferior to left scapula and between left ribs (arrowheads). Fluffy ossification in soft tissues with central hyperdense ossification is characteristic of osteoid matrix.
Fig. 7.

46-year-old man with slowly growing chest mass over 2 years. Axial CT image on bone windows shows soft-tissue mass arising at anterior costochondral junction, with punctate and arclike patterns of calcification and underlying osseous involvement. Radiologic and histologic features were compatible with intermediate grade chondrosarcoma.
Fig. 8.
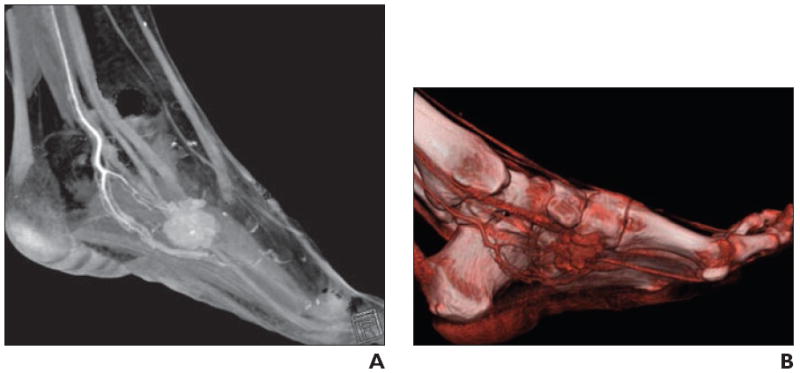
34-year-old woman with palpable soft tissue mass in foot.
A, Volume-rendered 3D CT image in sagittal plane shows vascular mass, as evidenced by homogeneous contrast enhancement, associated with internal calcification.
B, Shading to optimize visualization of vasculature better delineates arterial supply, which is useful for operative planning. Constellation of findings suggests synovial sarcoma.
Lesion Density
The internal composition of a soft-tissue mass may be surmised from its CT density, with fat measuring −130 to −70 HU, fluids measuring 0–30 HU, and muscle and soft tissues measuring 40–60 HU [40].
Lesions containing fat density
Lesions containing fat density include benign and malignant lipomatous tumors, hemangiomas and vascular malformations, and peripheral nerve sheath tumors. The macroscopic fatty components of classic lipomas have CT values typically measuring between −65 and −120 HU (Fig. 9), similar to the subcutaneous fat [41]. Although the appearance of well-differentiated liposarcomas may overlap with lipoma variants (angiomyolipoma, spindle cell, pleomorphic, and chondroid lipomas), characteristics that increase the likelihood of malignancy include increased patient age, large lesion size (> 10 cm), thick septations (> 2 mm), nodular or globular nonadipose mass-like areas, and decreased percentage of fat composition [41-44] (Figs. 10 and 11). However, it is important to remember that many higher grade liposarcomas, including myxoid, pleomorphic, and round cell subtypes, may contain little or no radiologically visible fat [41]. Large lipomatous tumors of infancy, such as lipoblastomas (Fig. 12), are rare [41, 45]. Hemangiomas are tumors of childhood that undergo proliferative and involuting phases, with increased fat seen during the later phases [24, 46]. Finally, deep-seated soft-tissue masses in the extremities that are fusiform in shape and have a fatty rim of tissue, which often is best seen in coronal or sagittal planes, suggest a localized peripheral nerve sheath tumor [47, 48]. This has been termed the “splitfat sign,” and its appearance owes to the displaced but intact surrounding layer of intermuscular fat that normally covers the neurovascular bundle, a finding indicative of a noninfiltrating underlying neurogenic mass [49, 50]. Also suggestive of peripheral nerve sheath tumors is the target sign, which is seen on CT as a central area of higher attenuation (representing fibrous collagenized tissue) surrounded by a halo of lower attenuation (representing more myxoid tissue). Classically associated with neurofibromas, the target sign can also be found with schwannomas and, unlike the split-fat sign, arises as a result of intrinsic properties of the neurogenic tumor itself [49].
Fig. 9.
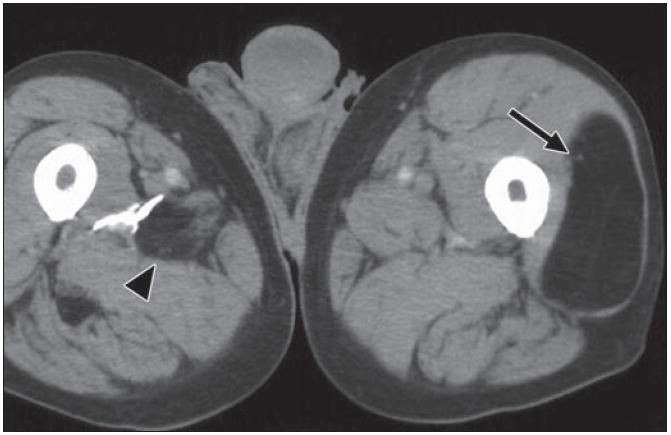
82-year-old man who noticed new “lump” on his leg. Axial CT depicts well-defined fat density mass within his left vastus lateralis muscle, with few very thin internal soft tissue septations (arrow). Finding is consistent with benign intramuscular lipoma. Incidentally, within posterior musculature of right thigh another smaller fat density mass (arrowhead) with internal stranding is present, probably due to interdigitating muscle fibers through lipoma.
Fig. 10.
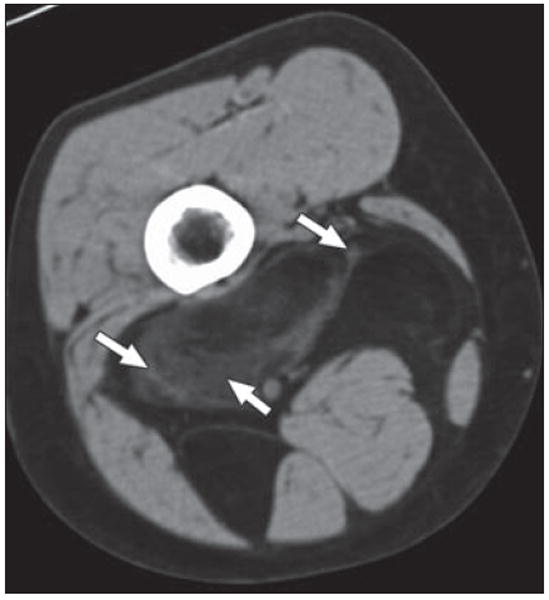
49-year-old woman who presented with enlarging mass in right posterior thigh. Axial CT shows predominantly fatty mass with areas of internal soft-tissue stranding and some nodularity (arrows). Surgery revealed well-differentiated liposarcoma or atypical lipomatous tumor. This is low-grade tumor that does not tend to metastasize but can recur locally after excision.
Fig. 11.
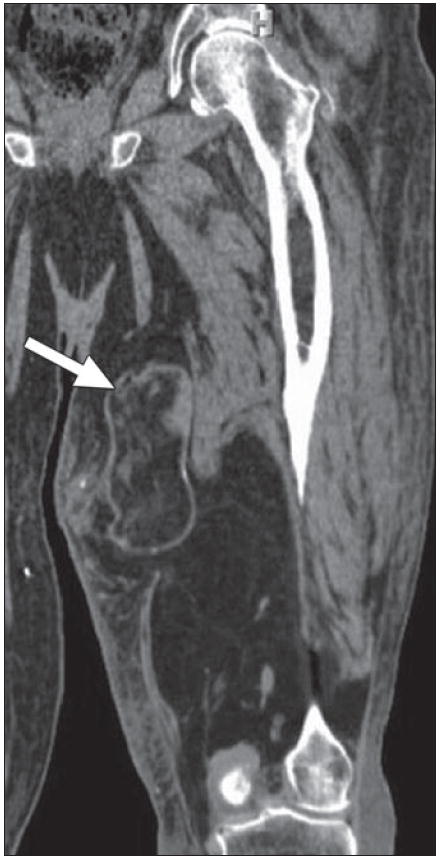
70-year-old man with continued swelling of his left leg, originally thought to be due to lymphedema. Coronal multiplanar reconstruction CT reveals large predominantly fat density lesion infiltrating and replacing posterior and medial musculature of thigh. Mass contains multiple areas of nodularity, as well as portions encapsulated by thick and irregular septations (arrow) superiorly, consistent with higher grade liposarcoma.
Fig. 12.
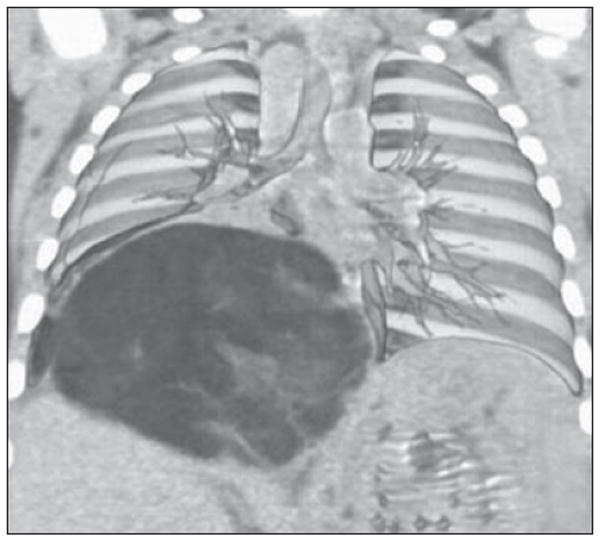
6-month-old boy with cough who was found to have large soft-tissue mass within chest on radiograph. Coronal volume-rendered image shows how mass displaces liver inferiorly and splays overlying pulmonary vasculature. Pathologic analysis revealed mass to be lipoblastoma, which is rare tumor of infancy and may radiographically resemble liposarcoma. Liposarcomas are extremely rare in children.
Lesions containing fluid
Lesions containing fluid include simple cysts, as well as cystic-appearing solid masses that are distinguished by the administration of IV contrast material. True cystic lesions, such as ganglion cysts, abscesses, seromas, lymphoceles (Fig. 13), and synovial cysts, may show a thin rim of enhancement in the cyst wall but no internal enhancement. In contradistinction, cystic soft-tissue tumors may have dense fluid (relative to water), possibly due to hemorrhagic, mucoid, or necrotic material, but show enhancement of their solid-tumor components after contrast administration. Rapidly growing or treated tumors exhibit hypodense regions of tumor necrosis that can usually be distinguished from simple fluid components by margin irregularity; diffusion-weighted MRI may allow improved discrimination in more difficult cases [51]. Because of their high mucin content, myxoid tumors, such as intramuscular myxomas, myxoid malignant fibrous histiocytomas (myxofibrosarcomas), and myxoid liposarcomas (Fig. 14), often have a pseudocystic appearance [41, 52]. The recognition that synovial cysts, bursae, and ganglia occur in typical periarticular locations in the dorsal wrist and popliteal regions and are intermuscular serves to distinguish them from myxomas, which are typically intramuscular [52]. Fluid–fluid levels are a nonspecific result of intratumoral hemorrhage and may be revealed by CT as well as MRI; among soft-tissue lesions, they have been described in synovial sarcomas, venous vascular malformations, and peripheral nerve sheath tumors [53-56].
Fig. 13.
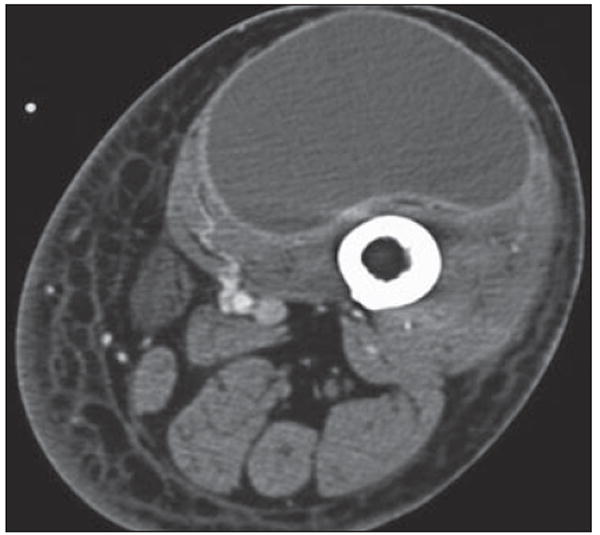
72-year-old man with swelling in left groin and thigh after thoracic aneurysm repair. Axial CT shows diffuse swelling of left lower extremity with cystic mass surrounded by thin rim of contrast enhancement within quadriceps. Although this appearance is consistent with lymphangioma, seroma, or abscess, this was lymphocele at resection.
Fig. 14.
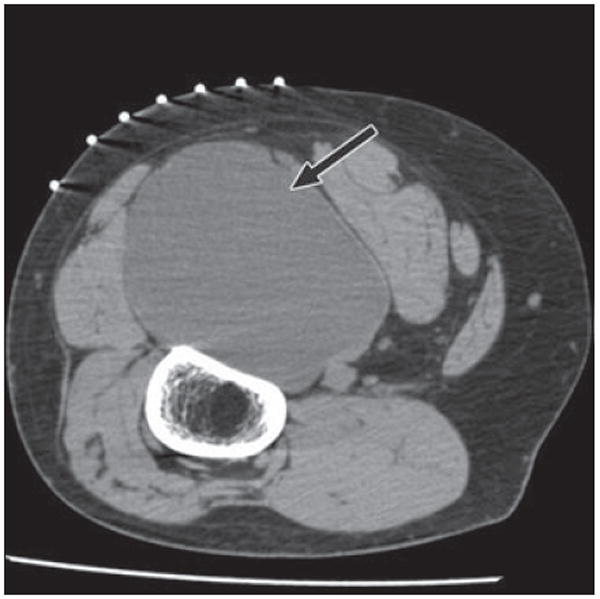
46-year-old man with mass in posterior left thigh. Axial CT image with patient in prone position for biopsy shows large cystic mass (arrow) posterior to femur, splaying hamstrings. Pathologic analysis revealed myxoid liposarcoma, which may have soft-tissue or pseudocystic appearance, mimicking intramuscular myxoma. Myxoid as well as pleomorphic liposarcomas may show minimal fat, and approximately 20% of lesions have completely cystic appearance. A cystic-appearing tumor within soft tissues of extremities thus always requires biopsy.
Lesions containing fibrous tissue
Lesions predominantly composed of fibrous tissue are usually of intermediate density similar to that of muscle. Benign fibrous masses include nodular fasciitis, fibromas, and fibromatoses (Fig. 15), the last of which can recur and be locally aggressive [57, 58]. Uncommon in the extremities, solitary fibrous tumors are a type of spindle cell neoplasm originally described in the pleura but now recognized to be anatomically ubiquitous and of uncertain malignant potential [59]; their CT appearance is typically that of a well-defined mass nearly isodense to muscle [60] (Fig. 16). Of malignant lesions, malignant fibrous histiocytoma (termed highgrade undifferentiated pleomorphic sarcoma in the new World Health Organization classification) is the most commonly encountered [2]. It should be suspected in any deep intramuscular unencapsulated mass in a patient older than 50 years, particularly when cortical erosion is seen [61].
Fig. 15.
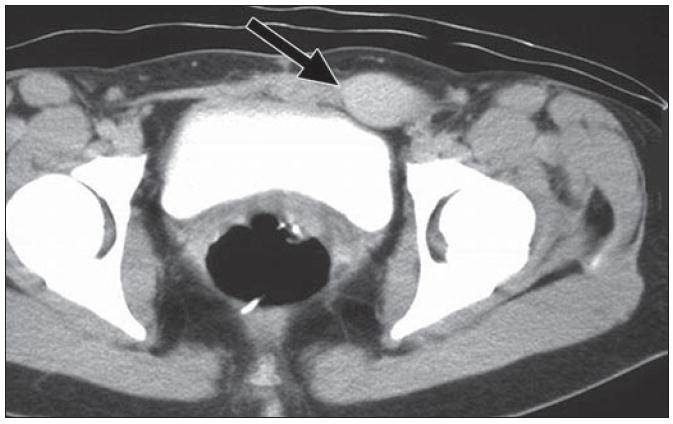
35-year-old woman diagnosed with Gardener syndrome, in setting of diffuse colonic polyposis, developed firm mass in her anterior abdominal wall. Axial CT image shows mass (arrow) in left rectus muscle, of similar attenuation to surrounding muscle, compatible with desmoid.
Fig. 16.
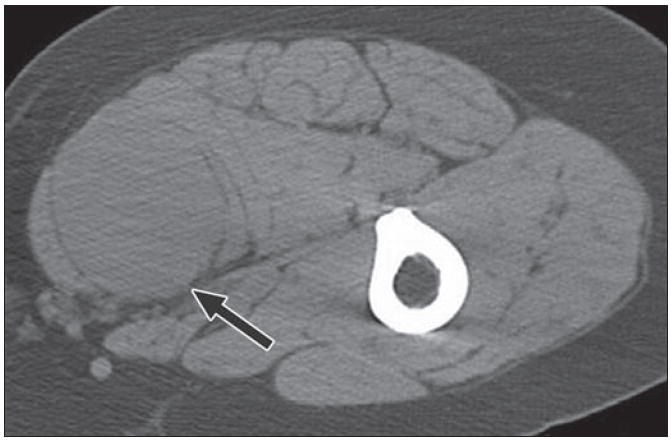
61-year-old woman with 2-year history of right thigh mass. Axial CT with patient prone shows intermediate density mass (arrow) splaying gracilis and adductor longus in posteromedial thigh. Fibrous masses within soft tissues usually have nonspecific appearance and biopsy is required for further characterization. This was solitary fibrous tumor.
Bone Involvement
CT is excellent in revealing the relationship between a soft-tissue tumor and the adjacent bone, especially in complex anatomic areas such as the spine and pelvis [14, 62]. The use of 3D imaging is particularly valuable for delineating the nature of bony involvement and its extent for preoperative planning [16, 63].
Benign soft-tissue masses tend to grow slowly over a long period of time and, therefore, frequently display smooth pressure erosion or scalloping of adjacent bone (Fig. 17). Intraarticular soft-tissue masses, such as those in synovial chondromatosis (Fig. 3), classically result in scalloping of the intraarticular portions of the adjacent bone. Malignant masses frequently show aggressive behavior, as evidenced by infiltration and osseous destruction (Fig. 18). Malignant fibrous histiocytoma, for example, commonly shows adjacent cortical destruction [61]. It should be noted, however, that exceptions to these generalizations will occur, as evidenced by synovial sarcomas that can be associated with benign-appearing bony erosions [64] and slow-growing metastases that scallop or splay underlying bony structures (Fig. 19).
Fig. 17.
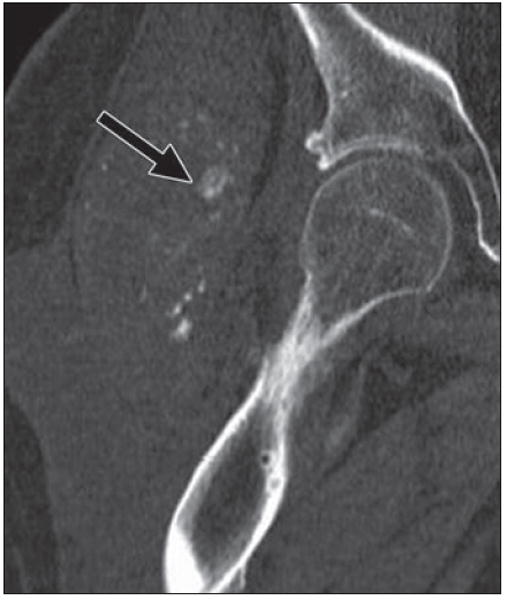
43-year-old man, quadriplegic after motorcycle accident, who had right hip pain for 2 months. Coronal multiplanar reconstruction CT image shows large masses of mixed attenuation lateral to right hip, with erosion of adjacent greater trochanter and shaft of right femur. There are scattered flocculent calcifications (arrow) within masses. This process involved both hips and was consistent with amyloid at biopsy. Benign soft-tissue masses affect adjacent bone commonly with pressure erosion or scalloping.
Fig. 18.
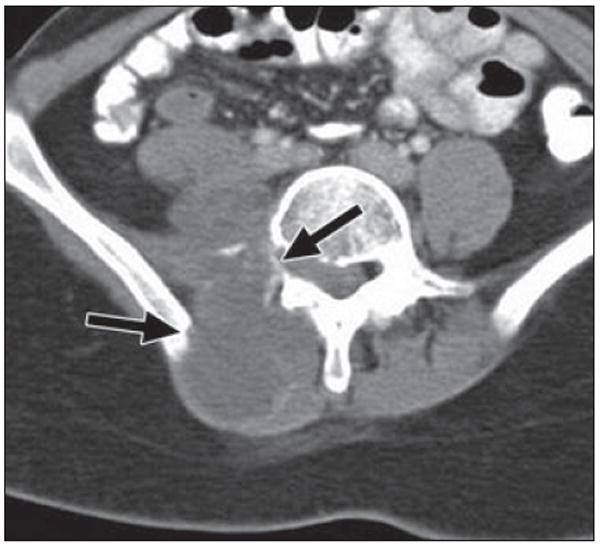
22-year-old woman with history of Wilms tumor (at age 6 years), with right-sided back pain and shooting pain down her right leg for 2 months. Axial CT image shows large heterogeneous mass within right paraspinal musculature invading right iliopsoas muscle and aggressive destruction of bone (arrows) involving right transverse process of vertebral body and right iliac ring. Pathologic lesion was consistent with high-grade postradiation sarcoma.
Fig. 19.
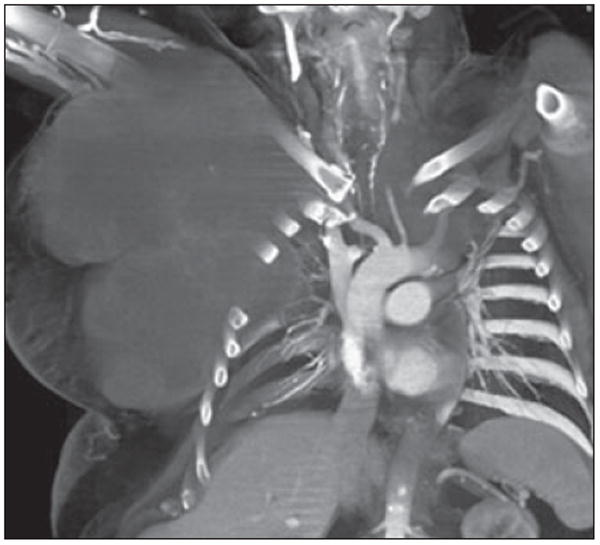
56-year-old man with metastatic chordoma, presenting as enormous soft-tissue mass projecting from right anterior chest wall. Primary tumor arose in posterior mediastinum. Coronal volume-rendered image reveals large low-density soft-tissue mass growing around and splaying ribs and protruding into pleural space without destruction of adjacent bone. Although chordomas are histologically low-grade neoplasms, they may have extensive local invasion and high rate of recurrence.
Vascular Malformations and Vascular Involvement
CT angiography may aid in the characterization of soft-tissue masses by revealing arterial or venous lesion vascularity, which is characteristic of certain tumors or vascular malformations. CT angiography is especially useful for preoperative planning by depicting vascular structures with a high degree of spatial resolution in multiple planes and in 3D reconstructions [16, 25, 63, 65] (Figs. 8 and 20).
Fig. 20.
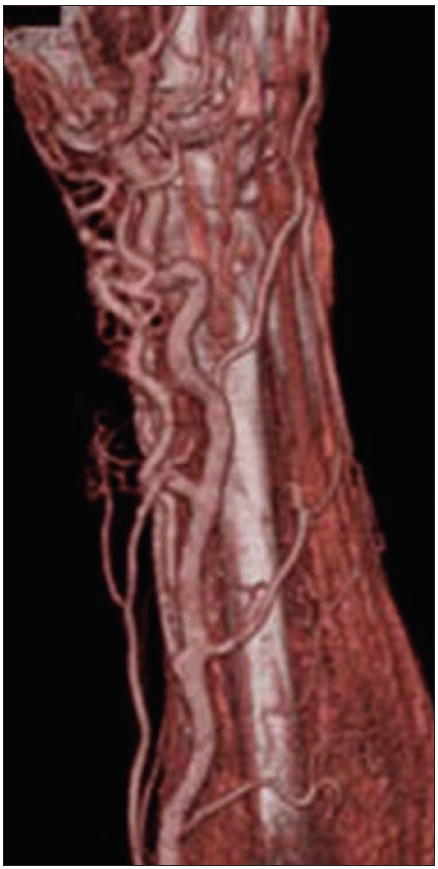
31-year-old man with arteriovenous malformation involving radial aspect of right wrist. Volume-rendered 3D CT image allows global appreciation of extent of involvement, which is particularly useful for treatment planning.
CT of benign nonneoplastic vascular lesions typically shows a mottled low-density pattern caused, in part, by the fatty, fibrous, and vascular tissue components. Venous malformations, which are characterized by slow flow and the pooling of blood, show a soft-tissue mass with serpentine vascular components that enhance with IV contrast medium unless they are thrombosed, along with phleboliths, as discussed in a previous section [25, 66]. High-flow vascular malformations, such as arteriovenous fistulas or arteriovenous malformations (Fig. 20), will show large feeding arteries in addition to draining vessels [67], although these can occasionally be seen in large low-flow malformations or noninvoluting hemangiomas as well (Fig. 21). CT venography has been recently reported to be of particular value in patients with mixed capillary and venous vascular malformations by revealing the anatomy and extent of aberrant venous drainage patterns [68, 69].
Fig. 21.
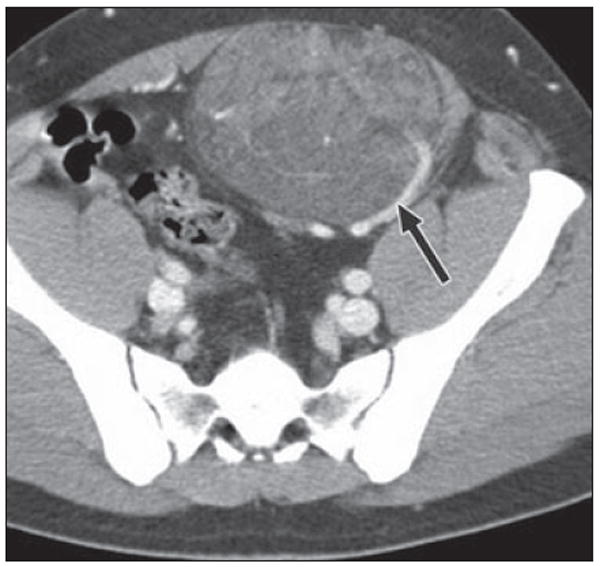
24-year-old man who was born with small cutaneous pigmented patch over his anterior abdominal wall and slowly developed mass subjacent to this site. Axial CT shows mixed attenuation mass arising from left rectus muscle and protruding into anterior left pelvis. A large feeding vessel (arrow) appears to supply mass. Note also numerous low-attenuation areas coursing through mass indicative of lipid content, another CT characteristic that can be used for characterization, seen in vascular malformations. At resection, it was found to be intramuscular capillary vascular malformation.
With regard to neoplastic conditions, benign soft-tissue tumors generally show well-defined homogeneous contrast enhancement, whereas malignant tumors are usually irregular and show heterogeneous enhancement. Arteriovenous shunting can be observed within malignant tumors and has been reported to occur in up to 24% of synovial sarcomas [64]. In addition, tumor involvement of neurovascular structures has well-known prognostic implications for soft-tissue tumors, as has been shown for synovial cell sarcoma [70]. It should be noted, though, that malignant soft-tissue tumors rather infrequently invade the neurovasculature; Panicek et al. [71] reported a prevalence of 4.5% for vascular involvement and 6.8% for neural involvement.
Conclusion
The primary role of CT in the evaluation of soft-tissue masses is adjunctive to that of MRI for the characterization of the masses. With CT, subtle areas of matrix mineralization may be detected that are diagnostic for a specific entity when minute areas of ossification or calcification are undetectable by MRI or radiography. Lesion density can suggest a histologic diagnosis, and careful evaluation of the adjacent bone often reveals clues regarding the potential for aggressive behavior. The techniques of CT angiography and 3D post-processing are particularly useful in the evaluation of soft-tissue masses and their relationship with adjacent osseous and neurovascular structures and often provide essential anatomic information for the referring physician in designing an optimal surgical approach. Thus, CT is often complementary to other imaging techniques in the radiologic evaluation of patients presenting with soft-tissue masses.
Acknowledgments
This work was supported by the National Institutes of Health (grant number 1T32EB006351). Its contents are solely the responsibility of the authors and do not necessarily represent the official views of the National Institutes of Health.
References
- 1.Wu JM, Montgomery E. Classification and pathology. Surg Clin North Am. 2008;88:483–520. v–vi. doi: 10.1016/j.suc.2008.03.007. [DOI] [PubMed] [Google Scholar]
- 2.Murphey MD. World Health Organization classification of bone and soft tissue tumors: modifications and implications for radiologists. Semin Musculoskelet Radiol. 2007;11:201–214. doi: 10.1055/s-2008-1038310. [DOI] [PubMed] [Google Scholar]
- 3.Egund N, Ekelund L, Sako M, Persson B. CT of soft-tissue tumors. AJR. 1981;137:725–729. doi: 10.2214/ajr.137.4.725. [DOI] [PubMed] [Google Scholar]
- 4.Yiu-Chiu VS, Chiu LC. Complementary values of ultrasound and computed tomography in the evaluation of musculoskeletal masses. RadioGraphics. 1983;3:46–82. [Google Scholar]
- 5.Soye I, Levine E, De Smet AA, Neff JR. Computed tomography in the preoperative evaluation of masses arising in or near the joints of the extremities. Radiology. 1982;143:727–732. doi: 10.1148/radiology.143.3.6952525. [DOI] [PubMed] [Google Scholar]
- 6.Heiken JP, Lee JK, Smathers RL, Totty WG, Murphy WA. CT of benign soft-tissue masses of the extremities. AJR. 1984;142:575–580. doi: 10.2214/ajr.142.3.575. [DOI] [PubMed] [Google Scholar]
- 7.Weekes RG, McLeod RA, Reiman HM, Pritchard DJ. CT of soft-tissue neoplasms. AJR. 1985;144:355–360. doi: 10.2214/ajr.144.2.355. [DOI] [PubMed] [Google Scholar]
- 8.Shelly MJ, MacMahon PJ, Eustace S. Radiology of soft tissue tumors including melanoma. Cancer Treat Res. 2008;143:423–452. doi: 10.1007/978-0-387-75587-8_16. [DOI] [PubMed] [Google Scholar]
- 9.Heslin MJ, Smith JK. Imaging of soft tissue sarcomas. Surg Oncol Clin N Am. 1999;8:91–107. [PubMed] [Google Scholar]
- 10.Kransdorf MJ, Jelinek JS, Moser RP., Jr Imaging of soft tissue tumors. Radiol Clin North Am. 1993;31:359–372. [PubMed] [Google Scholar]
- 11.Ma LD, Frassica FJ, Scott WW, Fishman EK, Zerbouni EA. Differentiation of benign and malignant musculoskeletal tumors: potential pitfalls with MR imaging. RadioGraphics. 1995;15:349–366. doi: 10.1148/radiographics.15.2.7761640. [DOI] [PubMed] [Google Scholar]
- 12.Mettler FA, Jr, Thomadsen BR, Bhargavan M, et al. Medical radiation exposure in the US in 2006: preliminary results. Health Phys. 2008;95:502–507. doi: 10.1097/01.HP.0000326333.42287.a2. [DOI] [PubMed] [Google Scholar]
- 13.Bush CH, Reith JD, Spanier SS. Mineralization in musculoskeletal leiomyosarcoma: radiologic–pathologic correlation. AJR. 2003;180:109–113. doi: 10.2214/ajr.180.1.1800109. [DOI] [PubMed] [Google Scholar]
- 14.Mori T, Fujii M, Akisue T, Yamamoto T, Kurosaka M, Sugimura K. Three-dimensional images of contrast-enhanced MDCT for preoperative assessment of musculoskeletal masses: comparison with MRI and plain radiographs. Radiat Med. 2005;23:398–406. [PubMed] [Google Scholar]
- 15.West ATH, Marshall TJ, Bearcroft PW. CT of the musculoskeletal system: what is left is the days of MRI? Eur Radiol. 2009;19:152–164. doi: 10.1007/s00330-008-1129-0. [DOI] [PubMed] [Google Scholar]
- 16.Pretorius ES, Fishman EK. Volume-rendered three-dimensional spiral CT: musculoskeletal applications. RadioGraphics. 1999;19:1143–1160. doi: 10.1148/radiographics.19.5.g99se061143. [DOI] [PubMed] [Google Scholar]
- 17.Pettersson H, Gillespy T, Hamlin DJ, et al. Primary musculoskeletal tumors: examination with MR imaging compared with conventional modalities. Radiology. 1987;164:237–241. doi: 10.1148/radiology.164.1.3588912. [DOI] [PubMed] [Google Scholar]
- 18.Totty WG, Murphy WA, Lee JK. Soft-tissue tumors: MR imaging. Radiology. 1986;160:135–141. doi: 10.1148/radiology.160.1.3715024. [DOI] [PubMed] [Google Scholar]
- 19.Morrison WB, Sanders TG. Problem solving in musculoskeletal imaging. Philadelphia, PA: Elsevier Health Sciences; 2008. pp. 283–313. [Google Scholar]
- 20.Murphey MD, wan Jaovisidha S, Temple HT, Gannon FH, Jelinek JS, Malawer MM. Telangiectatic osteosarcoma: radiologic-pathologic comparison. Radiology. 2003;229:545–553. doi: 10.1148/radiol.2292021130. [DOI] [PubMed] [Google Scholar]
- 21.Seeger LL, Motamedi K. Musculoskeletal imaging. In: Chang AE, Ganz PA, Hayes DF, et al., editors. Oncology: an evidence-based approach. New York, NY: Springer-Verlag; 2006. pp. 442–448. [Google Scholar]
- 22.Simon MA, Finn HA. Diagnostic strategy for bone and soft-tissue tumors. J Bone Joint Surg Am. 1993;75:622–631. doi: 10.2106/00004623-199304000-00019. [DOI] [PubMed] [Google Scholar]
- 23.Stewart VL, Herling P, Dalinka MK. Calcification in soft tissues. JAMA. 1983;250:78–81. [PubMed] [Google Scholar]
- 24.Fayad LM, Hazirolan T, Bluemke D, Mitchell S. Vascular malformations in the extremities: emphasis on MR imaging features that guide treatment options. Skeletal Radiol. 2006;35:127–137. doi: 10.1007/s00256-005-0057-1. [DOI] [PubMed] [Google Scholar]
- 25.Ramon F. Tumors and tumor-like lesions of blood vessels. In: Schepper D, editor. Imaging of soft tissue tumors. Berlin, Germany: Springer-Verlag; 2006. pp. 263–282. [Google Scholar]
- 26.Vilanova JC, Barceló J, Smirniotopoulos JG, et al. Hemangioma from head to toe: MR imaging with pathologic correlation. RadioGraphics. 2004;24:367–385. doi: 10.1148/rg.242035079. [DOI] [PubMed] [Google Scholar]
- 27.Traubici J, Neitlich J, Smith R. Distinguishing pelvic phleboliths from distal ureteral stones on routine unenhanced helical CT: is there a radiolucent center? AJR. 1999;172:13–17. doi: 10.2214/ajr.172.1.9888730. [DOI] [PubMed] [Google Scholar]
- 28.Boridy IC, Nikolaidis P, Kawashima A, Goldman SM, Sandler CM. Ureterolithiasis: value of the tail sign in differentiating phleboliths from ureteral calculi at nonenhanced helical CT. Radiology. 1999;211:619–621. doi: 10.1148/radiology.211.3.r99ma44619. [DOI] [PubMed] [Google Scholar]
- 29.Olsen KM, Chew FS. Tumoral calcinosis: pearls, polemics, and alternative possibilities. Radio-Graphics. 2006;26:871–885. doi: 10.1148/rg.263055099. [DOI] [PubMed] [Google Scholar]
- 30.Hanlon R, King S. Overview of the radiology of connective tissue disorders in children. Eur J Radiol. 2000;33:74–84. doi: 10.1016/s0720-048x(99)00157-6. [DOI] [PubMed] [Google Scholar]
- 31.Gerster JC, Landry M, Dufresne L, Meuwly JY. Imaging of tophaceous gout: computed tomography provides specific images compared with magnetic resonance imaging and ultrasonography. Ann Rheum Dis. 2002;61:52–54. doi: 10.1136/ard.61.1.52. [DOI] [PMC free article] [PubMed] [Google Scholar]
- 32.Chen CK, Yeh LR, Pan HB, et al. Intra-articular gouty tophi of the knee: CT and MR imaging in 12 patients. Skeletal Radiol. 1999;28:75–80. doi: 10.1007/s002560050477. [DOI] [PubMed] [Google Scholar]
- 33.Steinbach LS, Johnston JO, Tepper EF, Honda GD, Martel W. Tumoral calcinosis: radiologic-pathologic correlation. Skeletal Radiol. 1995;24:573–578. doi: 10.1007/BF00204854. [DOI] [PubMed] [Google Scholar]
- 34.Hayes CW, Conway WF. Calcium hydroxyapatite deposition disease. RadioGraphics. 1990;10:1031–1048. doi: 10.1148/radiographics.10.6.2175444. [DOI] [PubMed] [Google Scholar]
- 35.Kraemer EJ, El-Khoury GY. Atypical calcific tendinitis with cortical erosions. Skeletal Radiol. 2000;29:690–696. doi: 10.1007/s002560000278. [DOI] [PubMed] [Google Scholar]
- 36.Balboni TA, Gobezie R, Mamon HJ. Heterotopic ossification: pathophysiology, clinical features, and the role of radiotherapy for prophylaxis. Int J Radiat Oncol Biol Phys. 2006;65:1289–1299. doi: 10.1016/j.ijrobp.2006.03.053. [DOI] [PubMed] [Google Scholar]
- 37.Manaster BJ, May DA, Disler DG. Miscellaneous tumors and tumorlike lesions. In: Thrall J, editor. Musculoskeletal imaging: the requisites. 3. St Louis MO: Mosby; 2006. pp. 523–526. [Google Scholar]
- 38.Chew FS, Bui-Mansfield LT, Kline MJ. Appraoch to bone lesions. In: Chew FS, Bui-Mansfield LT, Kline MJ, editors. The core curriculum: musculoskeletal imaging. Philadelphia PA: Lippincott Williams & Wilkins; 2003. pp. 226–233. [Google Scholar]
- 39.O’Sullivan PJ, Harris AC, Munk PL. Radiological features of synovial cell sarcoma. Br J Radiol. 2008;81:346–356. doi: 10.1259/bjr/28335824. [DOI] [PubMed] [Google Scholar]
- 40.Sanders TG, Parsons TW. Radiographic imaging of musculoskeletal neoplasia. Cancer Control. 2001;8:221–231. doi: 10.1177/107327480100800302. [DOI] [PubMed] [Google Scholar]
- 41.Munk PL, Lee MJ, Janzen DL, et al. Lipoma and liposarcoma: evaluation using CT and MR imaging. AJR. 1997;169:589–594. doi: 10.2214/ajr.169.2.9242783. [DOI] [PubMed] [Google Scholar]
- 42.Kransdorf MJ, Bancroft LW, Peterson JJ, Murphey MD, Foster WC, Temple HT. Imaging of fatty tumors: distinction of lipoma and well-differentiated liposarcoma. Radiology. 2002;224:99–104. doi: 10.1148/radiol.2241011113. [DOI] [PubMed] [Google Scholar]
- 43.Kransdorf MJ, Moser RP, Jr, Meis JM, Meyer CA. Fat-containing soft-tissue masses of the extremities. RadioGraphics. 1991;11:81–106. doi: 10.1148/radiographics.11.1.1996399. [DOI] [PubMed] [Google Scholar]
- 44.Murphey MD, Carroll JF, Flemming DJ, Pope TL, Gannon FH, Kransdorf MJ. From the archives of the AFIP: benign musculoskeletal lipomatous lesions. RadioGraphics. 2004;24:1433–1466. doi: 10.1148/rg.245045120. [DOI] [PubMed] [Google Scholar]
- 45.Reiseter T, Nordshus T, Borthne A, Roald B, Naess P, Schistad O. Lipoblastoma: MRI appearances of a rare paediatric soft tissue tumour. Pediatr Radiol. 1999;29:542–545. doi: 10.1007/s002470050641. [DOI] [PubMed] [Google Scholar]
- 46.Buetow PC, Kransdorf MJ, Moser RP, Jr, Jelinek JS, Berrey BH. Radiologic appearance of intramuscular hemangioma with emphasis on MR imaging. AJR. 1990;154:563–567. doi: 10.2214/ajr.154.3.2154914. [DOI] [PubMed] [Google Scholar]
- 47.Banks KP. The target sign: extremity. Radiology. 2005;234:899–900. doi: 10.1148/radiol.2343030946. [DOI] [PubMed] [Google Scholar]
- 48.Cohen LM, Schwartz AM, Rockoff SD. Benign schwannomas: pathologic basis for CT inhomogeneities. AJR. 1986;147:141–143. doi: 10.2214/ajr.147.1.141. [DOI] [PubMed] [Google Scholar]
- 49.Murphey MD, Smith WS, Smith SE, Kransdorf MJ, Temple HT. From the archives of the AFIP: imaging of musculoskeletal neurogenic tumors: radiologic–pathologic correlation. RadioGraphics. 1999;19:1253–1280. doi: 10.1148/radiographics.19.5.g99se101253. [DOI] [PubMed] [Google Scholar]
- 50.Geniets C, Vanhoenacker FM, Simoens W, Gielen J, De Schepper AMA, Parizel PM. Imaging features of peripheral neurogenic tumors. JBR-BTR. 2006;89:216–219. [PubMed] [Google Scholar]
- 51.MacKenzie JD, Gonzalez L, Hernandez A, Ruppert K, Jaramillo D. Diffusion-weighted and diffusion tensor imaging for pediatric musculoskeletal disorders. Pediatr Radiol. 2007;37:781–788. doi: 10.1007/s00247-007-0517-y. [DOI] [PubMed] [Google Scholar]
- 52.Murphey MD, McRae GA, Fanburg-Smith JC, Temple HT, Levine AM, Aboulafia AJ. Imaging of soft-tissue myxoma with emphasis on CT and MR and comparison of radiologic and pathologic findings. Radiology. 2002;225:215–224. doi: 10.1148/radiol.2251011627. [DOI] [PubMed] [Google Scholar]
- 53.Tsai JC, Dalinka MK, Fallon MD, Zlatkin MB, Kressel HY. Fluid–fluid level: a nonspecific finding in tumors of bone and soft tissue. Radiology. 1990;175:779–782. doi: 10.1148/radiology.175.3.2160676. [DOI] [PubMed] [Google Scholar]
- 54.Kato H, Kanematsu M, Mizuta K, et al. Fluid–fluid level formation: a rare finding of extracranial head and neck schwannomas. AJNR. 2009;30:1451–1453. doi: 10.3174/ajnr.A1511. [DOI] [PMC free article] [PubMed] [Google Scholar]
- 55.Jones BC, Sundaram M, Kransdorf MJ. Synovial sarcoma: MR imaging findings in 34 patients. AJR. 1993;161:827–830. doi: 10.2214/ajr.161.4.8396848. [DOI] [PubMed] [Google Scholar]
- 56.Van Dyck P, Vanhoenacker FM, Vogel J, et al. Prevalence, extension and characteristics of fluid–fluid levels in bone and soft tissue tumors. Eur Radiol. 2006;16:2644–2651. doi: 10.1007/s00330-006-0250-1. [DOI] [PubMed] [Google Scholar]
- 57.Narla LD, Newman B, Spottswood SS, Narla S, Kolli R. Inflammatory pseudotumor. RadioGraphics. 2003;23:719–729. doi: 10.1148/rg.233025073. [DOI] [PubMed] [Google Scholar]
- 58.Robbin MR, Murphey MD, Temple HT, Kransdorf MJ, Choi JJ. Imaging of musculoskeletal fibromatosis. RadioGraphics. 2001;21:585–600. doi: 10.1148/radiographics.21.3.g01ma21585. [DOI] [PubMed] [Google Scholar]
- 59.Hasegawa T, Matsuno Y, Shimoda T, Hasegawa F, Sano T, Hirohashi S. Extrathoracic solitary fibrous tumors: their histological variability and potentially aggressive behavior. Hum Pathol. 1999;30:1464–1473. doi: 10.1016/s0046-8177(99)90169-7. [DOI] [PubMed] [Google Scholar]
- 60.Anders JO, Aurich M, Lang T, Wagner A. Solitary fibrous tumor in the thigh: review of the literature. J Cancer Res Clin Oncol. 2006;132:69–75. doi: 10.1007/s00432-005-0055-7. [DOI] [PMC free article] [PubMed] [Google Scholar]
- 61.Murphey MD, Gross TM, Rosenthal HG. From the archives of the AFIP: musculoskeletal malignant fibrous histiocytoma: radiologic–pathologic correlation. RadioGraphics. 1994;14:807–826. doi: 10.1148/radiographics.14.4.7938770. [DOI] [PubMed] [Google Scholar]
- 62.Greenspan A. Orthopedic imaging: a practical approach. Philadelphia PA: Lippincott Williams & Wilkins; 2000. pp. 20–27. [Google Scholar]
- 63.Yamamoto T, Kurosaka M, Soejima T, Fujii M. Contrast-enhanced three-dimensional helical CT for soft tissue tumors in the extremities. Skeletal Radiol. 2001;30:384–387. doi: 10.1007/s002560100353. [DOI] [PubMed] [Google Scholar]
- 64.Murphey MD, Gibson MS, Jennings BT, Crespo-Rodríguez AM, Fanburg-Smith J, Gajewski DA. Imaging of synovial sarcoma with radiologic–pathologic correlation. RadioGraphics. 2006;26:1543–1565. doi: 10.1148/rg.265065084. [DOI] [PubMed] [Google Scholar]
- 65.Calhoun PS, Kuszyk BS, Heath DG, Carley JC, Fishman EK. Three-dimensional volume rendering of spiral CT data: theory and method. RadioGraphics. 1999;19:745–764. doi: 10.1148/radiographics.19.3.g99ma14745. [DOI] [PubMed] [Google Scholar]
- 66.Murphey MD, Fairbairn KJ, Parman LM, Baxter KG, Parsa MB, Smith WS. From the archives of the AFIP: musculoskeletal angiomatous lesions: radiologic–pathologic correlation. RadioGraphics. 1995;15:893–917. doi: 10.1148/radiographics.15.4.7569134. [DOI] [PubMed] [Google Scholar]
- 67.Chan FP, Rubin GD. MDCT angiography of pediatric vascular diseases of the abdomen, pelvis, and extremities. Pediatr Radiol. 2005;35:40–53. doi: 10.1007/s00247-004-1371-9. [DOI] [PubMed] [Google Scholar]
- 68.Bastarrika G, Redondo P, Sierra A, et al. New techniques for the evaluation and therapeutic planning of patients with Klippel-Trénaunay syndrome. J Am Acad Dermatol. 2007;56:242–249. doi: 10.1016/j.jaad.2006.08.057. [DOI] [PubMed] [Google Scholar]
- 69.Mavili E, Ozturk M, Akcali Y, et al. Direct CT venography for evaluation of the lower extremity venous anomalies of Klippel-Trenaunay syndrome. AJR. 2009;192:1741. W311–316. doi: 10.2214/AJR.08.1151. web. [DOI] [PubMed] [Google Scholar]
- 70.Lewis JJ, Antonescu CR, Leung DHY, et al. Synovial sarcoma: a multivariate analysis of prognostic factors in 112 patients with primary localized tumors of the extremity. J Clin Oncol. 2000;18:2087–2094. doi: 10.1200/JCO.2000.18.10.2087. [DOI] [PubMed] [Google Scholar]
- 71.Panicek DM, Gatsonis C, Rosenthal DI, et al. CT and MR imaging in the local staging of primary malignant musculoskeletal neoplasms: report of the Radiology Diagnostic Oncology Group. Radiology. 1997;202:237–246. doi: 10.1148/radiology.202.1.8988217. [DOI] [PubMed] [Google Scholar]


