

Abstract
Understanding the thermodynamics of substrate selection by DNA polymerase I is important for characterizing the balance between replication and repair for this enzyme in vivo. Due to their sequence and structural similarities, Klenow and Klentaq, the large fragments of the Pol I DNA polymerases from Escherichia coli and Thermus aquaticus, are considered functional homologs. Klentaq, however, does not have a functional proofreading site. Examination of the DNA binding thermodynamics of Klenow and Klentaq to different DNA structures: single-stranded DNA (ss-DNA), primer-template DNA (pt-DNA), and blunt-end double-stranded DNA (ds-DNA) show that the binding selectivity pattern is similar when examined across a wide range of salt concentration, but can significantly differ at any individual salt concentration. For both proteins, binding of single-stranded DNA shifts from weakest to tightest binding of the three structures as the salt concentration increases. Both Klenow and Klentaq release two to three more ions when binding to pt-DNA and ds-DNA than when binding to ss-DNA. Klenow exhibits significant differences in the ΔCp of binding to pt-DNA versus ds-DNA, and a difference in pI for these two complexes, whereas Klentaq does not, suggesting that Klenow and Klentaq discriminate between these two structures differently. Taken together, the data suggest that the two polymerases bind ds-DNA very differently, but that both bind pt-DNA and ss-DNA similarly, despite the absence of a proofreading site in Klentaq.
Introduction
Escherichia coli DNA polymerase I (Pol I) possesses three enzymatic activities: a 5′ → 3′ DNA polymerase activity, a 3′ → 5′ exonuclease activity that mediates proofreading, and a 5′ → 3′ nuclease activity used for nick translation during DNA repair. Removal of the 5′ → 3′ exonuclease domains from the full length Pol I DNA polymerases from E. coli and Thermus aquaticus yields the Klenow and Klentaq large fragment domains (1,2). Structural and biochemical studies have shown that Klenow possesses both 5′ → 3′ polymerase and 3′ → 5′ exonuclease (editing) activities (3–6) whereas Klentaq only possesses the 5′ → 3′ polymerase activity (7). Cocrystal structures are available for Klenow in the editing mode (8,9) and for Klentaq in several individual steps of the polymerization mode (7,10). The x-ray crystal structures of Klenow and Klentaq polymerases show that these polymerases have very similar structures (3,10,11), although Klenow is a mesophilic protein that denatures between 40°C and 62°C, depending on solution conditions, whereas Klentaq is a thermophilic protein and is stable to ∼100°C (12,13). The polymerase domains of these proteins share a common architectural feature that resembles a half-open right hand with fingers, thumb, and palm subdomains (14). The thumb subdomain binds the duplex region of DNA whereas the fingers subdomain binds the incoming dNTP (3,7,8). The palm subdomain, consisting of the conserved active site residues, orients the primer strand for phosphodiester bond formation (3,8). Several biochemical, crystallographic, and spectroscopic studies have examined the interactions of DNA with the editing domain of Klenow (9,15–18). The cocrystal structure of Klenow in editing mode shows the last four nucleotides of the primer strand melted out of a duplex DNA, and bound to the editing domain (9,16). A few recent studies, however, have questioned whether this number is absolute, or if it can be shorter (three basepairs melted) (19) or longer (A. J. Richard and V. J. LiCata, unpublished observation).
Previous studies in our laboratory have shown that 1), Klenow binds ∼150× tighter to primer-template DNA than Taq/Klentaq across a wide range of salt conditions and temperatures; 2), the KCl and MgCl2 sensitivities and linkages (∂ln(1/Kd)/∂ln[KCl]) differ for the two polymerases; 3), the two proteins both have unusually high ΔCps of binding to pt-DNA; and 4), at their physiological temperatures, the DNA binding of both proteins is enthalpy driven (20–22).
The heat capacity change (ΔCp) is the temperature dependence of the enthalpy of a reaction. Higher ΔCp of binding has been shown to be often associated with sequence-specific DNA binding, however, we have shown previously that Klenow and Klentaq are two of several nonsequence-specific DNA binding proteins that show a substantial heat capacity change on binding (22,23). To further understand the DNA binding thermodynamics of these polymerases, we have characterized the binding of Klenow and Klentaq to different DNA structures, including single-stranded, primer-template, and blunt-end double-stranded DNA. Primer-template DNA has been shown to be the substrate for DNA replication (24), whereas single-stranded and blunt-end DNA have been suggested to be substrates for DNA repair (25,26). Single-stranded DNA has also been shown to be the substrate for the proofreading site of Klenow (15), and possibly the cognate ligand for the recently identified RRRY binding site in the fingers domain of both polymerases (18), so it is of some interest to determine if ss-DNA can bind to Klentaq, which lacks a proofreading site. Blunt-end DNA is a substrate for the nonhomologous end joining repair pathway, and has been suggested to be a substrate for Klenow (25,26). Because many bacteria, including E. coli, do not encode for the proteins normally associated with nonhomologous end joining, it is possible that polymerases or other proteins may at least partially serve a parallel purpose by protecting double-stranded end breaks.
The thermodynamic profiles for a protein-DNA interaction can include changes in free energy (ΔG), enthalpy (ΔH), entropy (ΔS), heat capacity (ΔCp), and linked ion release on binding. Klenow binds primer-template DNA (pt-DNA) and blunt-end double-stranded DNA (ds-DNA) with different thermodynamic profiles whereas Klentaq binds these DNA similarly. Klenow binds pt-DNA more tightly than ds-DNA at all salt concentrations, whereas Klentaq binds these two DNA structures identically at all salt concentrations. For both proteins, binding of single-stranded DNA shifts from weakest to tightest binding of the three structures as the salt concentration increases. The fact that Klenow can bind DNA in both polymerase and editing modes whereas Klentaq can only bind DNA in polymerase mode does not completely explain their different thermodynamics and DNA structural selectivity.
Materials and Methods
Materials and Methods are available in the Supporting Material, and include descriptions of the preparation of oligonucleotides and proteins, the fluorescence anisotropy assay, analysis of equilibrium, stoichiometric, and competitive binding titrations, isothermal titration calorimetry, electrophoretic mobility shift assays, and isoelectric focusing gels.
Results and Discussion
The binding stoichiometry of Klenow and Klentaq polymerases to different DNA structures
Table 1 shows the different DNA constructs used in this study. The stoichiometries of binding of Klenow and Klentaq polymerases were determined for each construct using several different experimental approaches: fluorescence anisotropy titrations, isothermal titration calorimetry, and electrophoretic mobility shift assays (gel shift). Results are summarized in Table 2, and representative data are included in the Supporting Material. Unlike equilibrium titrations where one reactant is kept well below the Kd, in stoichiometric titrations both protein and DNA concentrations are >>Kd to ensure saturation/stoichiometric binding. Data are then fit with Eq. S1 to determine the binding stoichiometry, which is near 1:1 for all complexes examined. The steady-state fluorescence of ROX does not change when protein is added indicating that the protein is not interacting with the dye. Furthermore, unlabeled DNA added to such stoichiometric titrations competes directly with the ROX-labeled DNA (data not shown).
Table 1.
DNA used for binding experiments
| Single-stranded DNA (ss-DNA) | |
| 13-mer | 5′-TCGCAGCCGTCCA-3′ |
| 20-mer | 5′-TCGCAGCCGTCCAAGGGTTT-3′ |
| 63-mer | 5′-TACGCAGCGTACATGCTCGTGACTGGGATAACCGTGCCGTTTGCCGACTTTCGCAGCCGTCCA-3′ |
| Primer-template DNA (pt-DNA) | |
| 13/20-mer | 5′-TCGCAGCCGTCCA-3′3′-AGCGTCGGCAGGTTCCCAAA-5′ |
| 63/70-mer | 5′-TACGCAGCGTACATGCTCGTGACTGGGATAACCGTGCCGTTTGCCGACTTTCGCAGCCGTCCA-3′3′-ATGCGTCGCATGTACGAGCACTGACCCTATTGGCACGGCAAACGGCTGAAAGCGTCGGCAGGTTCCCAAA-5′ |
| hp-39 | AAGGCTACCTGCATGA-3′AGCCGATGGACGTACTACCCCCC-5′ |
| Double-stranded DNA (ds-DNA) | |
| 20/20-mer | 5′-TCGCAGCCGTCCAAGGGTTT-3′3′-AGCGTCGGCAGGTTCCCAAA-5′ |
| 63/63-mer | 5′-TACGCAGCGTACATGCTCGTGACTGGGATAACCGTGCCGTTTGCCGACTTTCGCAGCCGTCCA-3′3′-ATGCGTCGCATGTACGAGCACTGACCCTATTGGCACGGCAAACGGCTGAAAGCGTCGGCAGGT-5′ |
| hp-32 | AAGGCTACCTGCATGA-3′AGCCGATGGACGTACT-5′ |
| hp-46 | AAGGCTACCTGCATGATAATTGG-3′AGCCGATGGACGTACTATTAACC-5′ |
Table 2.
Stoichiometric ratios of protein/DNA binding determined using fluorescence anisotropy and ITC∗
| DNA | Fluorescence anisotropy |
ITC |
||
|---|---|---|---|---|
| Klenow† | Klentaq‡ | Klenow§ | Klentaq¶ | |
| pt-13/20 | 0.89‖ | 1.0‖ | 0.8 | 0.9 |
| pt-63/70 | 1.1 | 1.15‖ | 1.0 | 1.35 |
| ss-20 | ND | ND | 0.9 | 1.35∗∗ |
| ss-63 | ND | 0.8 | 0.8 | ND |
| ds-20/20 | 0.6 | 1.0 | 1.2 | 1.1∗∗ |
| ds-63/63 | 0.75 | 1.25 | 0.9 | ND |
ITC, isothermal titration calorimetry. ND, not determined.
All errors are <±0.1 except as noted by superscript “∗∗” All anisotropy titrations were carried out at 25°C. All ITC titrations were carried out at 30°C.
Klenow anisotropy titrations were carried out in 10 mM Tris, 5 mM MgCl2, pH 7.9, and a KCl concentration of either 200 mM (13/20-mer) or 300 mM (63/70-mer, 20/20-mer, and 63/63-mer).
Klentaq anisotropy titrations were carried out in the same buffer with either 5 mM KCl (ss-DNA), 50 mM KCl (pt-DNA), or 75 mM KCl (ds-DNA).
Klenow ITC titrations were carried out in the same buffer with 300 mM KCl (pt- and ds-DNA), or 75 mM KCl.
Klentaq ITC titrations were carried out in the same buffer with either 5 mM KCl (ss-63 mer) or 75 mM KCl (all others).
From Datta and LiCata (20).
Klentaq ss-20: ±0.12, ds-20/20: ±0.25.
The stoichiometries of Klenow and Klentaq polymerases binding to different DNA structures were also obtained from isothermal titration calorimetry. Numerical values are also given in Table 2. Both fluorescence anisotropy and isothermal titration calorimetry indicate that both Klenow and Klentaq polymerases form 1:1 complexes with these DNA. There is no strong evidence for protein/DNA ratios >1:1, even considering the following outliers: Klenow + ds-20/20 by fluorescence anisotropy and Klentaq + 63/70-mer by ITC. These results agree with earlier direct determinations of binding stoichiometry by our lab (20) and from von Hippel et al. (19), but conflict with reports of Klenow dimerization from Millar et al. (27). Analytical ultracentrifugation and small angle x-ray scattering also report that Klenow and Klentaq bind these DNAs with 1:1 stoichiometry (A. J. Wowor and V. J. LiCata, and A. J. Richard and V. J. LiCata, unpublished observation). It is particularly noteworthy that 1:1 binding stoichiometry is maintained even on the longer constructs (ds-63/63 mer and pt-63/70 mer), where one might expect that proteins could bind to both ends of the construct. This, however, is clearly not the case (Table 2 and Fig. S1). The origins of this curious but consistent observation are not yet understood. DNA constructs longer than 63/70-mer have not yet been examined with either polymerase, but no complexes with >1:1 stoichiometry were detected by fluorescence anisotropy, calorimetry, or gel shift assays for either polymerase with any DNA constructs in this study.
DNA structural selectivity
The DNA structures used in this study are single-stranded DNA (ss-DNA), primer-template DNA with a 7 base ss-overhang (pt-DNA), and blunt-end double-stranded DNA (ds-DNA). The fluorescence anisotropy binding assay, for these proteins, will resolve binding affinities and produce well behaved titration curves across the nanomolar range (∼10 nM to 1 μM) (23). Because the binding affinity of Klentaq for DNA is consistently weaker than that of Klenow, to obtain data in the same relative affinity range requires titrating the two proteins across different salt concentration ranges. Fig. 1 shows Klenow and Klentaq binding to these DNA structures at 25°C at two different salt concentrations for each protein. At both KCl concentrations shown in Fig. 1, the binding affinity trend for Klentaq is ds-DNA ≈ pt-DNA >> ss-DNA. For Klenow, increasing the salt concentration across the experimentally accessible range produces a change in the binding hierarchy, and curves are shown at 200 mM KCl and 300 mM KCl (see Table S1, Table S2, Table S3, and Table S4 for Kd values). Although examination of the binding curves within these experimentally accessible windows suggests differing structural selectivity for the two polymerases, such substrate affinity hierarchies are dependent on the salt concentration. In the next section, we show that one observes very similar binding hierarchy patterns for the two proteins when one examines binding trends over very wide salt concentration ranges.
Figure 1.
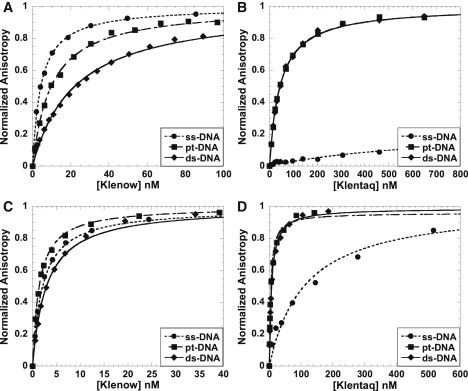
DNA structure dependence of binding by Klenow and Klentaq polymerases. Shown are representative equilibrium titrations of the polymerases and single-stranded DNA (ss-13) (•), primer-template DNA (pt-13/20) (■), and double-stranded DNA (ds-20/20) (♦). (A and C) Klenow titrations carried out at 25°C in 10 mM Tris, 5 mM MgCl2, and 300 mM KCl (A) or 200 mM KCl (C) at pH 7.9. (B and D) Klentaq titrations carried out at 25°C in 10 mM Tris, 5 mM MgCl2, and 75 mM KCl (all curves in B), 25 mM KCl (pt-DNA and ds-DNA in D), or 5 mM KCl (ss-DNA in D) at pH 7.9. Lines show the fits to single-site isotherms (Eq. 2).
KCl dependence of DNA binding by Klenow and Klentaq polymerases
Fig. 2, A and B, show the thermodynamic linkage plots for binding of different DNA structures by Klenow and Klentaq polymerases as a function of KCl concentration (∂ln(1/Kd) versus ∂ln[salt]). The negative slopes of the linkage plots indicate the net ion release on protein-DNA complex formation. Datta and LiCata (20) have shown that the length of DNA (pt-13/20 and pt-63/70) and temperature (25°C and 60°C) have no significant effect on the number of ions released. The linkage plots show Klenow binding to shorter DNA and Klentaq binding to longer DNA (Fig. 2, A and B). The linkage plots for Klenow show that binding to ss-DNA is linked to the release of 2.1 ions while binding to pt-DNA and ds-DNA is linked to the release of 4.4 and 5.4 ions, respectively. The linkage plots for Klentaq indicates that binding to ss-DNA releases 1.0 ion, binding to pt-DNA releases 2.8 ions, and binding to ds-DNA releases 3.2 ions. The Kd values and associated error windows are reported in Table S4 and Table S5, and in Datta and LiCata (20) for pt-DNA. For each protein, the ion releases for pt- versus ds-DNA are similar, whereas the ion release on ss-DNA binding is significantly smaller. Klentaq consistently releases fewer ions when binding the same DNA, suggesting either a smaller binding footprint on the DNA for Klentaq, or a linked ion uptake by the protein in Klentaq.
Figure 2.
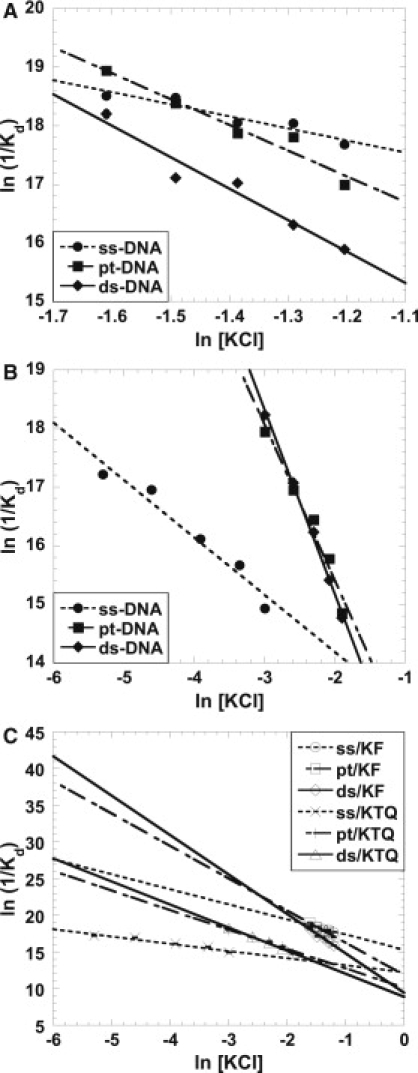
KCl linkages (∂ln1/Kd versus ∂ln[salt]) for the binding of Klenow (A) and Klentaq (B) to ss-DNA, pt-DNA, and ds-DNA. The slopes of the plots give the thermodynamic net average number of ions released on complex formation. Klenow titrations were carried out at 25°C in 10 mM Tris, 5 mM MgCl2, and 200–300 mM KCl at pH 7.9 whereas Klentaq titrations were carried out at 25°C and pH 7.9 in 10 mM Tris, 5 mM MgCl2, and 5–50 mM KCl concentration range for ss-DNA binding and 50–150 mM KCl concentration range for pt-DNA and ds-DNA binding. pt-DNA data for Klenow and Klentaq include data from Datta and LiCata (20). (C) Salt linkages for both polymerases, re-plotted together and extrapolated over the same salt concentration range. These plots show Klenow binding to shorter DNA and Klentaq binding to longer DNA.
In Fig. 2, blunt-end double-stranded DNA binding is always weaker than pt-DNA binding for Klenow, however, at salt concentrations <225 mM KCl (<−1.5 ln [KCl]), the relative affinities of ss-DNA versus pt-DNA for Klenow switches. Likewise, at salt concentrations <200 mM KCl (<−1.7 ln [KCl]), the affinity of Klenow for ss-DNA will cross the ds-DNA line and become the lowest affinity substrate. In contrast, for Klentaq the binding affinity hierarchy (ds-DNA ≈ pt-DNA >> ss-DNA) does not change with salt concentration across the range examined. It can be seen in Fig. 2 B, however, that ss-DNA binding will become the tightest substrate for Klentaq at salt concentrations ≥175 mM KCl, where the binding affinities of Klentaq for DNA have decreased to the micromolar range.
If it is assumed that the salt linkages will remain linear, and the experimental data of Fig. 2, A and B, are extrapolated over correspondingly wide salt concentration ranges, one immediately finds that the affinity patterns for the two proteins are very similar (Fig. 2 C). For both polymerases, binding affinities for pt-DNA and ds-DNA are very close to each other over several ln units of KCl concentration, whereas ss-DNA binding is significantly weaker at low KCl and switches to being the tightest binding substrate at salt concentrations near or slightly above physiological ionic strength. The smaller ion release in DNA/Klentaq complexes relative to DNA/Klenow complexes suggests that Klentaq has a smaller footprint when binding to DNA that may be because Klentaq does not have an editing binding site. That may also contribute to the fact that the DNA/Klentaq binding is weaker than DNA/Klenow binding.
Contributions of the single-stranded region of the template DNA to Klenow binding
Fig. 2, A and B, also show that Klentaq binds pt-DNA and ds-DNA with nearly identical affinity across a wide range of salt concentrations, and that Klenow binds pt-DNA ≤ 0.8 kcal/mol tighter than ds-DNA across a relatively wide range of salt concentration. This result is consistent when we examine Klenow binding to a variety of different pt- and ds-DNAs, and with both fluorescence anisotropy and gel shift assays. Fig. 2 C even suggests that the affinities for pt- versus ds-DNA will reverse at very low salt. Table 3 shows values for a variety of different direct measurements of the difference in free energy of Klenow binding to pt- and ds-DNA. The mean for these measurements, with different constructs and differing methods, is −0.77 kcal/mol. For hairpin structures, the primer-template versus blunt-end DNA difference is slightly larger (mean ΔΔG of −0.96 kcal/mol) relative to duplex constructs (mean ΔΔG of −0.52 kcal/mol). There are no significant differences between ΔΔG values from fluorescence anisotropy versus gel shift. Klenow binding to hp-32 using gel shift is shown in Fig. S2. These differences between pt- and blunt-end bindings are considerably smaller than that reported in another recent study (28), but that study did not measure direct binding but estimated binding differences from differences in competitive nucleotide incorporation into different constructs. The competitive nucleotide incorporation measurements estimated a 3 kcal/mol greater affinity of Klenow for pt-DNA with a 6-base ss-overhang relative to blunt-end DNA. This difference would predict that if Klenow encountered equal concentrations of pt-DNA and blunt-end DNA, it would be 170 times more likely to bind to the pt-DNA. The direct binding results in this study, however, show that there is at most a 0.8 kcal/mol difference in binding between these two structures, which translates into only a fourfold greater likelihood to bind pt-DNA. This small(er) difference lends more support to the potential physiological significance of previous demonstrations that Klenow and Klentaq polymerases can participate in nonhomologous end joining in part via protection of the ds-end of the DNA (25,26). We believe the data of this study, as discussed below, point to a clear difference in the thermodynamics and topology of the interaction of Klenow with ds- versus pt-DNA, i.e., as the template overhang is shortened one should observe a shift between two distinct binding modes, rather than a gradual weakening of a pt-DNA binding mode, and this would certainly affect assays that rely on enzymatic activity for detection.
Table 3.
The differences in free energies between pt-DNA and blunt-ended ds-DNA binding by Klenow polymerase assayed via both fluorescence anisotropy and gel shift, and using both duplex and hairpin DNA constructs
| DNA structure∗ | ΔG (kcal/mol)† | ΔΔG (kcal/mol)‡ |
|---|---|---|
| pt-13/20 FA | −10.90 ± 0.02 | |
| ds-20/20 FA | −10.25 ± 0.01 | −0.65 |
| pt-63/70 FA | −11.52 ± 0.02 | |
| ds-63/63 FA | −11.17 ± 0.04 | −0.35 |
| pt-13/20 GS | −9.86 ± 0.09 | |
| ds-20/20 GS | −9.31 ± 0.14 | −0.55 |
| hp-39 FA | −11.65 ± 0.05 | |
| hp-32 FA | −10.44 ± 0.17 | −1.21 |
| hp-39 FA | −11.65 ± 0.05 | |
| hp-46 FA | −10.50 ± 0.13 | −1.15 |
| hp-39 GS | −9.64 ± 0.12 | |
| hp-32 GS | −8.80 ± 0.24 | −0.84 |
| hp-39 GS | −9.64 ± 0.12 | |
| hp-46 GS | −9.02 ± 0.18 | −0.62 |
FA, fluorescence anisotropy; GS, gel shift or electrophoretic mobility shift assay. pt-13/20, pt-63/70, and hp-39 are primer-template DNA whereas ds-20/20, ds-63/63, hp-32, and hp-46 are blunt-end, double-stranded DNA.
pt-13/20, ds-20/20, pt-63/70, and ds-63/63 FA titrations were carried out at 25°C in 10 mM Tris, 5 mM MgCl2, and 300 mM KCl at pH 7.9 whereas hp-32, hp-39, and hp-46 FA titrations were carried out at 25°C in 10 mM Tris, 5 mM MgCl2, and 5 mM KCl at pH 7.9. For gel shift data, all titrations were carried out at 25°C in 10 mM Tris, 5 mM MgCl2, and 50 mM KCl at pH 7.9.
ΔΔG = ΔGpt − ΔGds and represents how much tighter the pt-DNA binds in each pair.
Enthalpies and heat capacities of binding of different DNA structures by Klenow and Klentaq
The calorimetric enthalpies of binding by Klenow polymerase are plotted as a function of temperature (from 8 to 30°C) in Fig. 3, A and B. Under these conditions, Klenow has a Tm of >52°C (13). The data are linearly fitted to determine the heat capacity changes (ΔCp = the slope) for Klenow binding to different DNA constructs. The displaced dependence for ss-63 mer relative to the ss-20 mer is due to the enthalpy of melting secondary structure in the ss-63 mer construct. Thermal melts show that the ss-63 mer has some secondary structure in solution (data not shown), and the heat required to melt the secondary structure raises the ΔH values for this construct, but does not alter ΔCp (slope in Fig. 3 B). All individual ΔH and ΔCp values are reported in Table S6, Table S7, and in Datta et al. (22). Fig. S3 shows representative ITC data.
Figure 3.
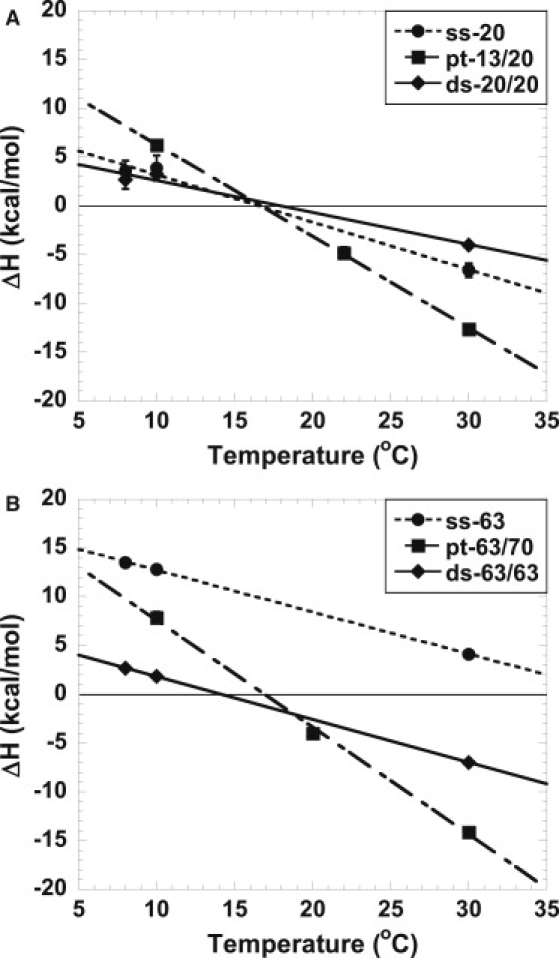
Temperature dependence of the enthalpy change (ΔH) on binding of Klenow to shorter and longer DNA structures determined by calorimetry. (A) Binding enthalpies (ΔHcal) for ss-20 (•), pt-13/20 (■), and ds-20/20 (♦). (B) Binding enthalpies for ss-63 (•), pt-63/70 (■), and ds-63/63 (♦). Linear fits to the calorimetric data are used to obtain the calorimetric ΔCp. The titrations were carried out in 10 mM Tris, 5 mM MgCl2, and 75 mM KCl for ss-DNA or 300 mM KCl for pt-DNA and ds-DNA at pH 7.9. Data for both lengths of pt-DNA are from Datta et al. (22).
The calorimetric enthalpies of binding by Klentaq polymerase are plotted as a function of temperature in Fig. 4 A. Again the data are linearly fitted to determine the heat capacity changes (ΔCp). The ΔH and the ΔCp values are reported in Table S8. Klentaq is stable to ∼98°C under these conditions (12). In Fig. 4 B, the temperature dependence of the Gibbs free energy of DNA binding, determined using fluorescence anisotropy titrations, is plotted as a function of temperature and then analyzed using Gibbs-Helmholtz equation to obtain corresponding Gibbs-Helmholtz/van 't Hoff ΔCp values for binding the different constructs. It should be noted that introduction of a temperature dependent ΔCp for the ds-63/63 or ss-63 DNA does not significantly improve the fits to these data (29). The Kd values and the thermodynamics (ΔG, ΔH, TΔS, and ΔCp values) are reported in Table S9, Table S10, and in Datta and LiCata (21). As seen previously with Klenow/DNA binding, the van 't Hoff enthalpies of Klentaq/DNA binding are larger than the calorimetric enthalpies, and this discrepancy has been linked previously to protonation/deprotonation processes detected calorimetrically using buffers with differing ionization enthalpies, but not in the anisotropy assay (22).
Figure 4.

Temperature dependence of the binding of Klentaq to different DNA structures. (A) Calorimetrically determined enthalpies (ΔHcal) on binding of Klentaq to ss-20 (•), pt-13/20 (■), and ds-20/20 (♦). Linear fits to the calorimetric data are used to obtain the calorimetric ΔCp values. The titrations were carried out in 10 mM Tris, 5 mM MgCl2, and 75 mM KCl at pH 7.9. (B) Temperature dependence of the free energy (ΔG) of binding of Klentaq to of ss-63 (•), pt-63/70 (■), and ds-63/63 (♦), determined in equilibrium titrations by fluorescence anisotropy. Data for pt-63/70 mer include data from Datta and LiCata (21). Lines are the fits to the Gibbs-Helmholtz equation. A much lower salt concentration was used for ss-DNA to bring the affinity of Klentaq for ss-DNA into a similar Kd range as for pt-DNA and ds-DNA. The titrations were carried out in 10 mM Tris, 5 mM MgCl2, and 5 mM KCl for ss-DNA or 75 mM KCl for pt-DNA and ds-DNA at pH 7.9. (C) van 't Hoff enthalpies (ΔHvH) as a function of temperature obtained from the Gibbs-Helmholtz analysis of the data in B for ss-63 (•), pt-63/70 (■), and ds-63/63 (♦).
The ΔCp values for binding the different DNA structures are summarized for both polymerases in Fig. 5 and Table S11. ΔCp has often been correlated at the molecular level with changes in the accessible surface area (ΔASA) on complex formation, and the balance of polar and nonpolar surface within that ΔASA. In addition, large negative ΔCp values have often been associated with sequence-specific DNA binding. We have shown that neither of these correlations holds quantitatively for Klenow and Klentaq DNA binding (21,22). We and others have strongly suggested that these correlations may hold for some subset of protein-DNA interactions, but that neither correlation holds quantitatively for DNA-protein interactions in general (29,30). As a general indicator, ΔCp is definitely reflective of some ΔASAnonpolar in protein-DNA interactions, but exact quantitative correlation does not universally hold for any current model for this specific class of interactions (29,30).
Figure 5.

Mean ΔCp values (kcal/mol K) for the binding of Klenow (A) and Klentaq (B) to different DNA structures. The results for the longer DNA constructs are shown, and are the averages and standard deviations of all ΔCp values obtained for each type of DNA with each polymerase, including ΔCp data from Datta and LiCata (21) and Datta et al. (22).
Lack of a universal precise quantitative correlation between ΔCp and molecular properties for protein-DNA interactions does not mean, however, that such values are devoid of information. ΔCp values in protein-DNA interactions are still strong reflections of changes in the qualitative nature of the molecular interaction and the types of noncovalent forces that dominate the binding (31). The different ΔCp patterns in Fig. 5 relative to the binding of the same DNA by Klenow and Klentaq indicate that the different affinities (ΔG values for each type of DNA) are not simply changes in strength of association in the same binding mode, but actually reflect different binding modes. Fig. 5 shows the mean ΔCp values for all determinations (calorimetric and Gibbs-Helmholtz) for both polymerases for the longer DNA constructs. Shorter DNA constructs yield the same patterns: Klenow shows a large ΔCp of pt-DNA binding and significantly smaller ΔCps of binding to ss- and ds-DNA, whereas Klentaq shows large ΔCp values for binding both pt- and ds-DNA (ΔCp values are in Table S11). The ability of Klenow to bind DNA in both polymerase and editing modes does not explain these thermodynamic patterns, as the primary ΔCp difference between Klenow and Klentaq is manifested on binding to blunt-ended ds-DNA.
DNA length effects on polymerase binding
Both Klenow and Klentaq bind longer ss-DNA tighter than shorter ss-DNA. The ΔΔG binding values between the shorter and longer ss-DNA are 0.5 kcal/mol for Klenow (Table S1) and 0.7 kcal/mol for Klentaq (Table S2). The longer ss-DNA (63-mer) has some secondary structure in solution at 25°C (see above), and both polymerases may bind to those secondary structures tighter than the completely single-stranded structure of the shorter 13-mer. Despite the small differences in ΔG, the ΔCp values for binding of both shorter and longer ss-DNA binding are similar (Table S6).
As regards duplex DNA, both Klenow and Klentaq bind longer pt- and ds-DNA tighter than shorter pt- and ds-DNA (Table S1 and Table S2). The ΔΔG values between the shorter and longer pt-DNA binding by Klenow and Klentaq are 0.6 kcal/mol and 0.1 kcal/mol, respectively (Table S1 and Table S2), whereas the ΔΔG values between the shorter and longer ds-DNA binding by Klenow and Klentaq are 0.9 kcal/mol and 0.3 kcal/mol, respectively (Table S1 and Table S2). These data suggest that the length of pt- and ds-DNA affects the binding of Klenow more significantly. Although the origins of these length dependencies are not clear, several hypotheses are possible. Klenow binds DNA with a higher ion release than Klentaq, suggesting that Klenow binds DNA with a larger footprint than Klentaq. Therefore, Klenow may require a longer DNA for proper DNA binding. The 13-mer and 13/20-mer used in these studies, although based on the kinetics studies of Benkovic and associates (32), may in fact be slightly smaller than the optimal binding size for the polymerases. Available crystal structures all show smaller resolved DNA sections, and so the optimal binding size remains debatable. As with the ss-DNA, however, the different lengths of pt- and ds-DNA binding by Klenow and Klentaq do not alter the ΔCp values within error (Figs. 3 and 4).
Isoelectric point differences between ds- versus pt-DNA/Klenow complexes
Thermodynamically, the differences in ΔG, ΔCp, and ion release suggest that although Klentaq polymerase binds pt- and ds-DNA similarly, Klenow binds them differently. Native gel isoelectric focusing of the different complexes is shown in Fig. 6. It can be seen that the two apo-proteins essentially comigrate. The pI shift on complex formation for Klentaq is similar with both DNAs, whereas the ds-DNA/Klenow and pt-DNA/Klenow complexes show distinctly different shifts. Because the ds-DNA/Klenow complex migrates most similarly to the Klentaq complexes, it remains difficult to identify the exact origins for the differing association of Klenow with the two DNAs. For example, if one hypothesizes that Klentaq, because it lacks a proofreading active site, always binds in the polymerization mode, then by extrapolation ds-DNA/Klenow could be in polymerization mode, whereas pt-DNA/Klenow might be in editing mode. This, however, is contrary to the expectation that Klenow should bind a perfectly matched pt-DNA construct predominantly in the polymerization mode (19). The facts that the two apo-polymerases have equivalent pIs and that identical DNA constructs are bound to each clearly indicate that the observed pI shift between the two complexes for Klenow originates from a difference in the topology of binding of ds- versus pt-DNA to Klenow: i.e., because the DNA constructs used for Klenow and Klentaq are identical, the difference in migration of pt-DNA/Klenow versus pt-DNA/Klentaq must be due to a difference in how many charges on the DNA are buried or blocked in the two different complexes. One feature of native state IEF is that it is sometimes sensitive to topological features beyond a direct accounting of unit charges. These results thus provide a visual demonstration of the differences in the pt- and ds-DNA/Klenow complexes and underscore the thermodynamic results for these complexes.
Figure 6.
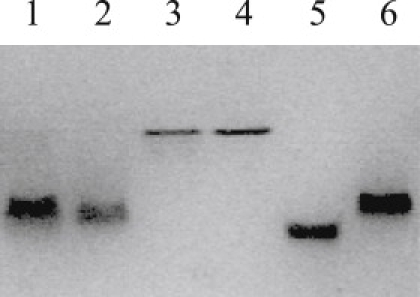
Isoelectric focusing gel (pH 5–8) of Klenow and Klentaq apo-proteins and protein-DNA complexes. Samples (l–6): Lane 1: Klentaq + 13/20-mer, 80 pmol each; Lane 2: Klentaq + 20/20-mer, 80 pmol each; Lane 3: Klentaq alone, 40 pmol; Lane 4: Klenow alone, 40 pmol; Lane 5: Klenow + 13/20-mer, 80 pmol each; Lane 6: Klenow + 20/20-mer, 80 pmol each.
The magnesium chloride effect on DNA and polymerase binding
Magnesium ions are required for both Klenow and Klentaq enzymatic function (9,16,20,33–36). For DNA binding to pt-DNA, whereas Mg2+ seems not to be absolutely essential, it does clearly enhance binding affinity. Klenow seems to especially require a minimal amount of free Mg2+ for high affinity binding (20). Fig. 7 shows that magnesium ions help Klenow differentiate primer-template (pt-DNA) from blunt-end (ds-DNA) (see Table S12 for Kd values). Klenow binds pt-DNA with similar affinities in the absence and presence of MgCl2, but the affinity of Klenow for ds-DNA is decreased by almost an order of magnitude (1.2 to 1.3 kcal/mol) when magnesium is present. On the other hand, Klentaq binds ds-DNA with almost identical affinities in the absence and presence of MgCl2, and binds pt-DNA more tightly in the presence of Mg2+. Adding Mg2+ to solution thus appears to function as an affinity switch for Klenow binding to ds-DNA and to a lesser extent for Klentaq binding to pt-DNA, but the Mg2+ switch acts in opposite directions for the two polymerases. In contrast, added Mg2+ does not have a significant effect on the binding affinity of Klenow for pt-DNA or Klentaq for ds-DNA.
Figure 7.
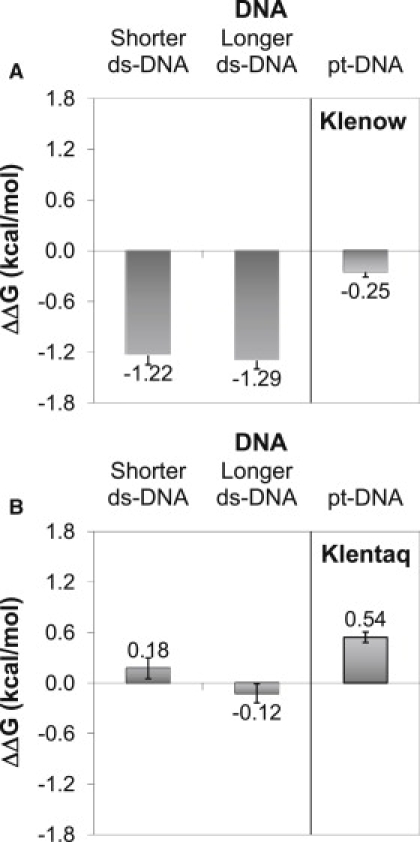
The effect of Mg2+ on the free energy of pt-DNA and ds-DNA binding by Klenow (A) and Klentaq (B). ΔΔG is the binding free energy in the absence of MgCl2 minus the free energy of binding in the presence of 5 mM MgCl2 (ΔGabsence − ΔGpresence). Free energy of binding in these experiments was measured via competition assays as described in Materials and Methods. Mean and standard deviation of three determinations are shown.
The RRRY motif and ss-DNA binding by Klenow and Klentaq
Modak et al. (18) have recently identified a sequence they call the RRRY motif, which is conserved across the Pol I family and seems to be involved in ss-DNA binding of the template portion of a melted DNA duplex during proofreading. Located near the base of the fingers subdomain, mutations in this four-residue sequence in Klenow will reduce the 3′-exonuclease activity by up to 29-fold (18). The finding that Klentaq binds ss-DNA even though it does not have a proofreading site suggests that the RRRY site is binding capable in Klentaq, although its purpose in Klentaq is unclear. The significantly weaker ss-DNA binding by Klentaq relative to Klenow, and the release of fewer ions on ss-DNA binding by Klentaq relative to Klenow, may either be due to additional ss-DNA interactions with the proofreading active site in Klenow that are absent in Klentaq, or may simply be a part of the overall reduction in binding affinity for any/all DNA exhibited by Klentaq relative to Klenow. This raises the question of whether isolated ss-DNA binds only to the RRRY motif even in Klenow, whereas ss-DNA that has been melted out of a duplex DNA and is being shifted to the editing mode, then binds the two melted single-strands in the RRRY and exonuclease sites.
Conclusions
What do these thermodynamics say about the different binding modes of the two proteins? For ss-DNA binding, both proteins bind ss-DNA with the lowest ion release and the lowest ΔCp. Yet for both proteins, the position for ss-DNA binding in the binding hierarchy is the most variable, switching from weakest to tightest binding as salt concentration increases for both proteins. Although the switch occurs near 200 mM salt for both proteins, within the physiological salt range ss-DNA binding is the tightest in the hierarchy for Klenow, and weakest in the hierarchy for Klentaq. In summary, it is noteworthy: 1), that ss-DNA binds to Klentaq at all; 2), that the ΔCp of ss-DNA binding to both proteins is very similar, suggesting similar binding interfaces; and 3), that the position of ss-DNA binding in the binding hierarchy for both proteins changes very similarly with increasing salt concentrations. These findings suggest that the recently identified RRRY ss-DNA binding motif may be the primary binding site for isolated ss-DNA in both polymerases. Klenow's proofreading site clearly binds ss-DNA that has been melted out of a bound duplex (4,8). Klentaq, however, has no proofreading site, and is missing most or all of the residues that have been biochemically associated with the proofreading site. If isolated ss-DNA were binding primarily to the proofreading site in Klenow, one might expect a more striking difference in the thermodynamics of ss-DNA binding to Klenow versus Klentaq, although the smaller ion release on ss-DNA/Klentaq binding (1 ion released) relative to ss-DNA/KF binding (2 ions released) (Table S4 and Table S5) suggests that Klentaq has a smaller footprint when binding to ss-DNA. This observation correlates with the hypothesis that ss-DNA binds to both the RRRY motif and the editing binding site in Klenow and only binds to the RRRY motif in Klentaq. Thus, Klenow and Klentaq may have different structures when they bind to ss-DNA.
For ds-DNA versus pt-DNA binding, the results also highlight some notable binding characteristics. Klentaq binding to pt-DNA and ds-DNA seem similar, if not identical, by all thermodynamic criteria: the same ΔCp, the same affinities, and the same ion release. If only duplex constructs had been used, one might hypothesize that Klentaq avoided the pt-end of the DNA and bound only to the ds-end, but the binding thermodynamics of Klentaq binding to primer-template and blunt-end hairpin DNA shows that Klentaq indeed binds to blunt-end DNA and primer-template DNA almost identically.
Klenow, on the other hand, clearly thermodynamically discriminates between ds-DNA and pt-DNA: the ion release for binding the two structures differ by about an ion, their binding free energies differ by slightly less than a kcal/mol, their ΔCp values are very different, and the two complexes have differing pI values. Even from a purely thermodynamic point of view, the data suggest that the binding of ds-DNA to Klenow is structurally different from pt-DNA binding. One might expect that the single-stranded portion of the pt-DNA would influence the thermodynamics of binding, but because it does not do so in Klentaq, yet does in Klenow, it points either to the contributions of editing mode binding for Klenow, or suggests a unique ds-DNA binding mode exists for Klenow's interaction with blunt-end ds-DNA. Without further structure-based characterization, however, these hypothesis cannot yet be resolved.
Supporting Material
Methods and materials, twelve tables containing individual data values, and three figures showing representative stoichiometric, gel shift, and calorimetric titrations are available at http://www.biophysj.org/biophysj/supplemental/S0006-3495(10)00353-X.
Supporting Material
Acknowledgments
This work was supported by the National Science Foundation. A.W. was partially supported by the Louisiana Biomedical Research Network.
Footnotes
Andy J. Wowor's present address is Department of Molecular and Cell Biology, University of Connecticut, Storrs, CT 06269.
Kausiki Datta's present address is Institute of Molecular Biology, University of Oregon, Eugene, OR 97403.
References
- 1.Klenow H., Overgaard-Hansen K. Proteolytic cleavage of DNA polymerase from Escherichia coli B into an exonuclease unit and a polymerase unit. FEBS Lett. 1970;6:25–27. doi: 10.1016/0014-5793(70)80032-1. [DOI] [PubMed] [Google Scholar]
- 2.Barnes W.M. The fidelity of Taq polymerase catalyzing PCR is improved by an N-terminal deletion. Gene. 1992;112:29–35. doi: 10.1016/0378-1119(92)90299-5. [DOI] [PubMed] [Google Scholar]
- 3.Beese L.S., Friedman J.M., Steitz T.A. Crystal structures of the Klenow fragment of DNA polymerase I complexed with deoxynucleoside triphosphate and pyrophosphate. Biochemistry. 1993;32:14095–14101. doi: 10.1021/bi00214a004. [DOI] [PubMed] [Google Scholar]
- 4.Cowart M., Gibson K.J., Benkovic S.J. DNA substrate structural requirements for the exonuclease and polymerase activities of procaryotic and phage DNA polymerases. Biochemistry. 1989;28:1975–1983. doi: 10.1021/bi00431a004. [DOI] [PubMed] [Google Scholar]
- 5.Derbyshire V., Freemont P.S., Steitz T.A. Genetic and crystallographic studies of the 3′,5′-exonucleolytic site of DNA polymerase I. Science. 1988;240:199–201. doi: 10.1126/science.2832946. [DOI] [PubMed] [Google Scholar]
- 6.Ruscitti T., Polayes D.A., Linn S. Selective immunoneutralization of the multiple activities of Escherichia coli DNA polymerase I supports the model for separate active sites and indicates a complex 5′ to 3′ exonuclease. J. Biol. Chem. 1992;267:16806–16811. [PubMed] [Google Scholar]
- 7.Li Y., Korolev S., Waksman G. Crystal structures of open and closed forms of binary and ternary complexes of the large fragment of Thermus aquaticus DNA polymerase I: structural basis for nucleotide incorporation. EMBO J. 1998;17:7514–7525. doi: 10.1093/emboj/17.24.7514. [DOI] [PMC free article] [PubMed] [Google Scholar]
- 8.Beese L.S., Derbyshire V., Steitz T.A. Structure of DNA polymerase I Klenow fragment bound to duplex DNA. Science. 1993;260:352–355. doi: 10.1126/science.8469987. [DOI] [PubMed] [Google Scholar]
- 9.Freemont P.S., Friedman J.M., Steitz T.A. Cocrystal structure of an editing complex of Klenow fragment with DNA. Proc. Natl. Acad. Sci. USA. 1988;85:8924–8928. doi: 10.1073/pnas.85.23.8924. [DOI] [PMC free article] [PubMed] [Google Scholar]
- 10.Korolev S., Nayal M., Waksman G. Crystal structure of the large fragment of Thermus aquaticus DNA polymerase I at 2.5-A resolution: structural basis for thermostability. Proc. Natl. Acad. Sci. USA. 1995;92:9264–9268. doi: 10.1073/pnas.92.20.9264. [DOI] [PMC free article] [PubMed] [Google Scholar]
- 11.Steitz T.A. DNA polymerases: structural diversity and common mechanisms. J. Biol. Chem. 1999;274:17395–17398. doi: 10.1074/jbc.274.25.17395. [DOI] [PubMed] [Google Scholar]
- 12.Karantzeni I., Ruiz C., LiCata V.J. Comparative thermal denaturation of Thermus aquaticus and Escherichia coli type 1 DNA polymerases. Biochem. J. 2003;374:785–792. doi: 10.1042/BJ20030323. [DOI] [PMC free article] [PubMed] [Google Scholar]
- 13.Richard A.J., Liu C.C., LiCata V.J. Thermal stability landscape for Klenow DNA polymerase as a function of pH and salt concentration. Biochim. Biophys. Acta. 2006;1764:1546–1552. doi: 10.1016/j.bbapap.2006.08.011. [DOI] [PubMed] [Google Scholar]
- 14.Ollis D.L., Brick P., Steitz T.A. Structure of large fragment of Escherichia coli DNA polymerase I complexed with dTMP. Nature. 1985;313:762–766. doi: 10.1038/313762a0. [DOI] [PubMed] [Google Scholar]
- 15.Brutlag D., Kornberg A. Enzymatic synthesis of deoxyribonucleic acid. 36. A proofreading function for the 3′ leads to 5′ exonuclease activity in deoxyribonucleic acid polymerases. J. Biol. Chem. 1972;247:241–248. [PubMed] [Google Scholar]
- 16.Beese L.S., Steitz T.A. Structural basis for the 3′-5′ exonuclease activity of Escherichia coli DNA polymerase I: a two metal ion mechanism. EMBO J. 1991;10:25–33. doi: 10.1002/j.1460-2075.1991.tb07917.x. [DOI] [PMC free article] [PubMed] [Google Scholar]
- 17.Lam W.C., Thompson E.H., Millar D.P. 3′-5′ exonuclease of Klenow fragment: role of amino acid residues within the single-stranded DNA binding region in exonucleolysis and duplex DNA melting. Biochemistry. 2002;41:3943–3951. doi: 10.1021/bi0120603. [DOI] [PubMed] [Google Scholar]
- 18.Kukreti P., Singh K., Modak M.J. Identification of a new motif required for the 3′-5′ exonuclease activity of Escherichia coli DNA polymerase I (Klenow fragment): the RRRY motif is necessary for the binding of single-stranded DNA substrate and the template strand of the mismatched duplex. J. Biol. Chem. 2008;283:17979–17990. doi: 10.1074/jbc.M801053200. [DOI] [PMC free article] [PubMed] [Google Scholar]
- 19.Datta K., Johnson N.P., von Hippel P.H. Local conformations and competitive binding affinities of single- and double-stranded primer-template DNA at the polymerization and editing active sites of DNA polymerases. J. Biol. Chem. 2009;284:17180–17193. doi: 10.1074/jbc.M109.007641. [DOI] [PMC free article] [PubMed] [Google Scholar]
- 20.Datta K., LiCata V.J. Salt dependence of DNA binding by Thermus aquaticus and Escherichia coli DNA polymerases. J. Biol. Chem. 2003;278:5694–5701. doi: 10.1074/jbc.M208133200. [DOI] [PubMed] [Google Scholar]
- 21.Datta K., LiCata V.J. Thermodynamics of the binding of Thermus aquaticus DNA polymerase to primed-template DNA. Nucleic Acids Res. 2003;31:5590–5597. doi: 10.1093/nar/gkg774. [DOI] [PMC free article] [PubMed] [Google Scholar]
- 22.Datta K., Wowor A.J., LiCata V.J. Temperature dependence and thermodynamics of Klenow polymerase binding to primed-template DNA. Biophys. J. 2006;90:1739–1751. doi: 10.1529/biophysj.105.071837. [DOI] [PMC free article] [PubMed] [Google Scholar]
- 23.LiCata V.J., Wowor A.J. Applications of fluorescence anisotropy to the study of protein-DNA interactions. Methods Cell Biol. 2008;84:243–262. doi: 10.1016/S0091-679X(07)84009-X. [DOI] [PubMed] [Google Scholar]
- 24.Kornberg A., Baker T.A. 2nd ed. W.H. Freeman and Company, New York; New York: 1992. DNA Replication. [Google Scholar]
- 25.King J., Fairley C., Morgan W. The joining of blunt DNA ends to 3′-protruding single strands in Escherichia coli. Nucleic Acids Res. 1998;26:1749–1754. doi: 10.1093/nar/26.7.1749. [DOI] [PMC free article] [PubMed] [Google Scholar]
- 26.King J.S., Fairley C.F., Morgan W.F. DNA end joining by the Klenow fragment of DNA polymerase I. J. Biol. Chem. 1996;271:20450–20457. doi: 10.1074/jbc.271.34.20450. [DOI] [PubMed] [Google Scholar]
- 27.Bailey M.F., Van der Schans E.J., Millar D.P. Dimerization of the Klenow fragment of Escherichia coli DNA polymerase I is linked to its mode of DNA binding. Biochemistry. 2007;46:8085–8099. doi: 10.1021/bi6024148. [DOI] [PubMed] [Google Scholar]
- 28.Turner R.M., Grindley N.D., Joyce C.M. Interaction of DNA polymerase I (Klenow fragment) with the single-stranded template beyond the site of synthesis. Biochemistry. 2003;42:2373–2385. doi: 10.1021/bi026566c. [DOI] [PubMed] [Google Scholar]
- 29.Liu C.C., Richard A.J., LiCata V.J. Prevalence of temperature-dependent heat capacity changes in protein-DNA interactions. Biophys. J. 2008;94:3258–3265. doi: 10.1529/biophysj.107.117697. [DOI] [PMC free article] [PubMed] [Google Scholar]
- 30.Kozlov A.G., Lohman T.M. Effects of monovalent anions on a temperature-dependent heat capacity change for Escherichia coli SSB tetramer binding to single-stranded DNA. Biochemistry. 2006;45:5190–5205. doi: 10.1021/bi052543x. [DOI] [PMC free article] [PubMed] [Google Scholar]
- 31.Sturtevant J.M. Heat capacity and entropy changes in processes involving proteins. Proc. Natl. Acad. Sci. USA. 1977;74:2236–2240. doi: 10.1073/pnas.74.6.2236. [DOI] [PMC free article] [PubMed] [Google Scholar]
- 32.Kuchta R.D., Mizrahi V., Benkovic S.J. Kinetic mechanism of DNA polymerase I (Klenow) Biochemistry. 1987;26:8410–8417. doi: 10.1021/bi00399a057. [DOI] [PubMed] [Google Scholar]
- 33.Chien A., Edgar D.B., Trela J.M. Deoxyribonucleic acid polymerase from the extreme thermophile Thermus aquaticus. J. Bacteriol. 1976;127:1550–1557. doi: 10.1128/jb.127.3.1550-1557.1976. [DOI] [PMC free article] [PubMed] [Google Scholar]
- 34.Englund P.T., Huberman J.A., Kornberg A. Enzymatic synthesis of deoxyribonucleic acid. XXX. Binding of triphosphates to deoxyribonucleic acid polymerase. J. Biol. Chem. 1969;244:3038–3044. [PubMed] [Google Scholar]
- 35.Han H., Rifkind J.M., Mildvan A.S. Role of divalent cations in the 3′,5′-exonuclease reaction of DNA polymerase I. Biochemistry. 1991;30:11104–11108. doi: 10.1021/bi00110a012. [DOI] [PubMed] [Google Scholar]
- 36.Slater J.P., Tamir I., Mildvan A.S. The mechanism of Escherichia coli deoxyribonucleic acid polymerase I. Magnetic resonance and kinetic studies of the role of metals. J. Biol. Chem. 1972;247:6784–6794. [PubMed] [Google Scholar]
Associated Data
This section collects any data citations, data availability statements, or supplementary materials included in this article.