

Abstract
Mixtures of long- and short-tail phosphatidylcholine lipids are known to self-assemble into a variety of aggregates combining flat bilayerlike and curved micellelike features, commonly called bicelles. Atomistic simulations of bilayer ribbons and perforated bilayers containing dimyristoylphosphatidylcholine (DMPC, di-C14 tails) and dihexanoylphosphatidylcholine (DHPC, di-C6 tails) have been carried out to investigate the partitioning of these components between flat and curved microenvironments and the stabilization of the bilayer edge by DHPC. To approach equilibrium partitioning of lipids on an achievable simulation timescale, configuration-bias Monte Carlo mutation moves were used to allow individual lipids to change tail length within a semigrand-canonical ensemble. Since acceptance probabilities for direct transitions between DMPC and DHPC were negligible, a third component with intermediate tail length (didecanoylphosphatidylcholine, di-C10 tails) was included at a low concentration to serve as an intermediate for transitions between DMPC and DHPC. Strong enrichment of DHPC is seen at ribbon and pore edges, with an excess linear density of ∼3 nm−1. The simulation model yields estimates for the onset of edge stability with increasing bilayer DHPC content between 5% and 15% DHPC at 300 K and between 7% and 17% DHPC at 323 K, higher than experimental estimates. Local structure and composition at points of close contact between pores suggest a possible mechanism for effective attractions between pores, providing a rationalization for the tendency of bicelle mixtures to aggregate into perforated vesicles and perforated sheets.
Introduction
Lipids and other surfactants self-assemble into aggregates that display a variety of morphologies. Over three decades ago, Israelachvili et al. (1) rationalized this behavior by considering molecular dimensions and surface area to volume (S/V) ratios. Glycerophospholipids such as dimyristoylphosphatidylcholine (DMPC) aggregate into bilayer sheets rather than spherical or cylindrical micelles, they argued, because at dimensions dictated by the molecular lengths a nearly flat bilayer presents an optimal S/V ratio. The edge of a bilayer therefore would represent an unstable structure, as lipids positioned at the rim would be subject to an S/V ratio roughly double that of the bilayer interior (Fig. 1) if one treats the edge as a hemicylinder of diameter equal to the bilayer thickness. The instability of the bilayer edge per unit length, or line tension, has been the subject of investigation through experiment (2,3), theory (4), and molecular simulation (5,6).
Figure 1.
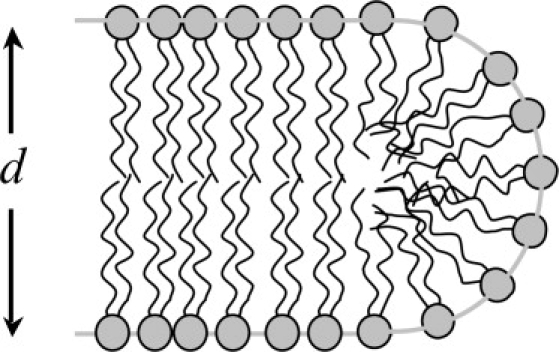
Cross section of idealized hemicylindrical bilayer edge. Area/volume ratio is 2d−1 in the flat portion, 4d−1 in the edge.
Reduction of the bilayer line tension by adding a component that would stabilize the rim, sometimes termed an edge-actant, was characterized first by Fromherz (7). Lin et al. carried out investigations of mixtures of glycerophosphatidylcholine lipids of different tail length, and suggested that mixing dipalmitoyl PC (DPPC, 16 carbons/tail) with diheptanoyl PC (seven carbons/tail) forms disklike micelles with the shorter-tail lipids coating and stabilizing the edges (8). Sanders and Schwonek (9) showed that a related mixture, of DMPC (di-C14 PC) with dihexanoyl PC (DHPC, di-C6 PC) displayed an ordered phase that could be useful as a medium for NMR studies of membrane-associated proteins. DMPC/DHPC aggregates came to be known as bicelles, a term arising from their status as “binary, bilayered mixed micelles” (10). Various bicelle mixtures have been applied to the study of membrane-associated proteins by NMR (in both ordered and isotropic phases) (11), as well as to crystallographic (12) characterization of membrane proteins. As first shown by Tjandra and Bax (13), oriented bicelle systems could also impart weak orientation to nonspherical soluble proteins, leading to their application in a broad range of macromolecular NMR experiments.
The initial development of applications for bicelles outpaced the characterization of bicelle structure. Early descriptions of aggregate structure and the distribution of lipids within the aggregates were based on a very simple ideal bicelle model, in which total segregation of DHPC and DMPC between edge and bilayer environments was assumed (14). Recent work has highlighted the morphological complexity of these systems, with disks, wormlike or ribbonlike micelles, and perforated bilayer or networklike structures appearing at various compositions and temperatures (15–20). The extent of mixing of long- and short-tail PC lipids within these structures—the degree of deviation from the ideal bicelle model—has also been inferred and quantified using phosphorus NMR (21,22).
Although molecular simulation can often provide insight into complex lipid bilayer behaviors (23), the application of atomistic models to the study of bicelles presents several challenges. Experimental time- and lengthscales for aggregate assembly generally will surpass what is practical for a simulation. Although a micelle or a patch of bilayer can assemble in tens of nanoseconds (24,25), the morphology of the resulting aggregate is greatly influenced by the boundary conditions of the simulation. Even within a preassembled aggregate, the time required for lipids to diffuse distances of a few nanometers is of the order of 1 μs, meaning that the lateral distribution of DMPC and DHPC in a bicelle structure will be biased toward the initial distribution for simulations of that duration or shorter. Coarse-grained (CG) model simulations of lipid mixtures (26–29), in which diffusion rates tend to be faster and longer simulation trajectories are practical, are increasingly popular. However, for some purposes—including the development of CG models using atomistic simulation data as a reference (30–33)—a more detailed representation of the system is desirable. A mixed molecular dynamics (MD) and Monte Carlo (MC) method has been developed to facilitate the simulation of equilibrated lipid mixtures (34–36). Using configuration-bias Monte Carlo (CBMC) tail regrowth moves (37) within the isomolar semigrand-canonical ensemble, the technique aims to allow each lipid in the system to establish equilibrium with respect to a pair of virtual lipid reservoirs, with the difference in chemical potential (Δμ) between the reservoirs fixed over the simulation. In a previous study, this technique was used to demonstrate the equilibrium enrichment of the shorter-tail lipid at the edges of a bilayer ribbon containing a mixture of DMPC with didecanoyl PC (DDPC, di-C10 PC) (35). Because the acceptance probability for mutation moves decreases rapidly with increasing tail-length mismatch, the original method was inefficient at modeling the DMPC-DHPC mixtures of experimental interest. Following the example of the expanded ensemble methods of Escobedo and de Pablo (38), we have worked around this problem by including an intermediate-stage lipid (DDPC) at low concentrations. Equilibria between DMPC and DDPC and between DDPC and DHPC are established simultaneously through direct mutations with specified ΔμDD-DM and ΔμDH-DD. As a consequence, all lipids have the opportunity to interconvert in two steps between DMPC and DHPC. The ΔμDD-DM + ΔμDH-DD sum determines the balance between DMPC and DHPC, whereas the difference, ΔμDD-DM − ΔμDH-DD, determines the level of DDPC. More DDPC in the mixture provides more opportunities for two-step transitions between DMPC and DHPC but brings the mixture farther away from the true binary lipid mixture of interest. As a compromise, we have aimed for an average DDPC mole fraction near 10%.
In this report, we describe simulations of bilayers with and without pores and bilayer ribbons, at various proportions of DMPC to DHPC, all containing a small fraction of DDPC, at 300 K and at 323 K. The simulation trajectories have been analyzed to characterize the partitioning behavior of the two lipids between the bilayer and the edge, the stability of the edge, and the lateral and normal distributions of DMPC and DHPC within intact mixtures.
Methods
The methods applied are a straightforward extension of the technique introduced by de Joannis et al. (34). A customized version of the GROMACS 3.2.1 package (39) was used in which CBMC (37) tail mutation move attempts alternate with conventional molecular dynamics time integration steps. As in previous studies (34,35), CBMC tail growth and shrinking moves were performed with k = 4 trial sites generated for each segment. For the work described here, each lipid could exist in one of three states: long-tail (“L”), short-tail (“S”), or intermediate (“B”). For each CBMC trial move, one lipid molecule is selected at random. If a long-tail or a short-tail lipid is selected, a shortening or lengthening trial move to convert that lipid to the intermediate state is attempted. If instead the lipid selected is in the intermediate state, then with equal probability an attempt is made to convert this lipid either to a long-tail or a short-tail lipid. Activity ratios αBL ≡ exp(β(μB-μL)) and αSB ≡ exp(β(μS-μB)) are chosen to control the number ratios of long and short lipids to intermediate lipids through the influence of these terms on acceptance probabilities of CBMC moves. The activity ratio of primary interest, α ≡ exp(β (μS-μL)), is accordingly equal to αSB/αBL. In the production runs, α values are chosen to yield a range of overall L/S ratios with the intermediate molecules maintained at a mole fraction of 5–10% in the system.
To test the two-step algorithm, we compare the results presented here with those produced by our previous one-step MCMD algorithm for mixed DPPC (di-C16) and DLPC (di-C12) bilayers composed of 128 lipids. The two-step algorithm is therefore applied to two equilibria, DPPC/DMPC and DMPC/DLPC, with tail lengths differing by two carbons for each pair; DPPC corresponds to L, DMPC corresponds to B, and DLPC corresponds to S in the above explanation. The activity ratio α is set to a value (3469) shown previously (34) to yield a 1:1 ratio of DPPC to DLPC. Two-step MCMD simulations starting from either 100% DPPC or 100% DLPC converge to an evenly balanced mixture of these components within 0.5 ns. In the two-step mutation simulation, the percentage of intermediate species is <10%, and its presence therefore should have little effect on the ratio of L and S lipids. As indicated in Table 1, the two-step algorithm results are consistent with our previous one-step results (34) in this case, where a direct comparison is practical.
Table 1.
Comparison of the results from two-step (A) and one-step (B) MCMD in DPPC/DLPC systems
| Activity ratio, α = exp(β(μS − μL)) | DPPC/DLPC | % Intermediate | Time (ns) | Mean area/lipid (Å2) |
|---|---|---|---|---|
| 1163 | 3.713.44 | 11.7%N/A | 5.4 ns10 ns | 66.54 ± 1.2666.68 ± 0.18 |
| 3490 | 1.080.95 | 5.9%N/A | 6.4 ns10 ns | 66.74 ± 0.3067.10 ± 0.11 |
| 9307 | 0.380.33 | 4.6%N/A | 5 ns10 ns | 67.63 ± 0.2567.01 ± 0.34 |
Results in italic are from the one-step MCMD study of de Joannis et al. (34).
Details of force-field and MD parameters
A simulation step is composed of a 2-fs MD step and a CBMC mutation attempt. The Langevin dynamics algorithm (40) with a thermostat time constant of 0.2 ps is used for the dynamics step. In bilayer simulations, Berendsen's semi-isotropic pressure coupling scheme is applied in the xy and z (bilayer normal) direction independently with pressure set to 1.0 bar, a time constant of 1 ps, and compressibility set to 4.5 × 10⁻⁵ bar−1. In ribbon simulations, the same pressure coupling parameters were used, except that the box dimension parallel to the bilayer edge was held fixed. The VMD (visual MD) package (41) was used for molecular visualization. Simulations were performed using the parameters derived for DPPC by Berger et al. (42). DMPC, DDPC, and DHPC used the same parameters with 2, 6, and 10 methylene groups removed from each tail of DPPC lipid. A single-point-charge (SPC) model (43) was used for the water molecules. During MD simulations, all bonds were subject to length constraints using LINCS (44) (for lipids) or SETTLE (45) (for waters). The electrostatic forces were treated using particle mesh Ewald (46), with a 1.0-nm cut-off in real space, 0.12-nm grid size in Fourier space, and fourth-order interpolation.
System set-up
A series of simulations on bilayer ribbons (denoted R3–R6; see details in Table 2) were initiated from a mixed DMPC/DDPC bilayer structure containing 125 DMPC, 58 DDPC, and 0 DHPC that was the endpoint of an 8-ns trajectory previously reported (35). Ribbon simulations contained 11,994 solvent molecules, with a fixed edge length of 6.14 nm. The first 10 ns of each trajectory are not factored into calculations of line tension, composition, or edge excess. Snapshots of the final frames for all ribbon simulations are given in Fig. S1 in the Supporting Material.
Table 2.
Results from two-step MCMD simulations of DMPC/DHPC/DDPC ribbon assemblies
| Run ID | α (×107) | αBL (×102) | DMPC % | DHPC % | Λ (pN) | Excess DHPC (nm−1) | Final configuration | Time |
|---|---|---|---|---|---|---|---|---|
| R3 | 5 | 10 | 58.9 ± 1.3 | 30.5 ± 1.0 | −8 ± 8 | 2.8 | Ribbon | 50 ns |
| R4 | 10 | 10 | 50.5 ± 1.4 | 40.3 ± 1.5 | 17 ± 14 | 3.0 | Ribbon | 60 ns |
| R5 | 20 | 10 | 40.5 ± 2.6 | 53.0 ± 2.6 | −10 ± 13 | 3.0 | Ribbon with large edge undulations | 45ns |
| R6 | 40 | 10 | 21.6 ± 2.7 | 74.3 ± 3.0 | N/A | N/A | Perforated ribbon | 25 ns |
Simulations were performed at 300 K. Line tension was calculated according to Eq. 1. The first 10 ns of each trajectory are not factored into calculations of line tension, composition, or edge excess.
An intact bilayer structure consisting of 128 DMPC molecules in fluid phase available on the Tieleman group website, http://moose.bio.ucalgary.ca/index.php?page=Downloads (47), was used as the initial configuration of a series of intact bilayer simulations (B7–B10; see Table 3) at 323 K. Pore-containing system trajectories at 323 K were set up by first raising the activity ratio to α = 1 × 10⁸ and using the perforated structure that appears after 20 ns containing 4 DMPC, 121 DHPC, and 3 DDPC as a starting point for trajectories (P7–P10) at lower activity ratios. As one of these (P9) underwent a transition to a cylindrical micelle structure, this trajectory was repeated (P9b) using an earlier structure from the α = 1 × 10⁸ simulation (19 DMPC, 94 DHPC, and 15 DDPC) as a starting point, yielding a stable pore. Bilayer simulations at 300 K (B1–B6) were initiated from an intermediate structure in a 323 K trajectory containing 65 DMPC, 61 DHPC, and 2 DDPC. A series of pore-containing simulations at 300 K (runs P1–P6) were initiated from the perforated bilayer structure at the endpoint of series B10. All intact and porous bilayer systems contain 3655 water molecules. Activity ratios and trajectory durations are reported in Tables 3 and 4 for systems initiated as intact bilayers and perforated bilayers, respectively. For systems that remain stable throughout the simulations, the compositions are the results averaged over the last 24 ns of the trajectory. Intact bilayer trajectories that produced pores were stopped upon pore formation at the times and compositions listed. In perforated bilayer systems with shrinking or growing pores, compositions are extracted from the last frame of the simulation. Snapshots of perforated bilayers at 300 K are given in Fig. S2.
Table 3.
Results from two-step MCMD simulations of DMPC/DHPC/DDPC systems starting from intact bilayers
| Run ID | α (×107) | αBL (×102) | DMPC % | DHPC % | Final configuration | Time |
|---|---|---|---|---|---|---|
| 300 K | ||||||
| B1 | 0.5 | 5 | 93.0% | 0.7% | Intact | 56 ns |
| B2 | 2 | 5 | 88.7% | 5.3% | Intact | 100 ns |
| B3 | 5 | 10 | 74.2% | 14.7% | Intact | 76 ns |
| B4 | 10 | 10 | 64.7% | 25.2% | Intact | 72 ns |
| B5 | 20 | 10 | 51.2% | 41.1% | Intact | 90 ns |
| B6 | 40 | 10 | 32.8% | 62.5% | Perforated | 40 ns |
| 323 K | ||||||
| B7 | 0.2 | 1 | 85.4% | 7.3% | Intact | 40 ns |
| B8 | 0.5 | 2 | 75.1% | 17.2% | Intact | 75 ns |
| B9 | 1 | 2 | 61.9% | 31.5% | Intact | 90 ns |
| B10 | 2 | 4 | 42.2% | 52.3% | Perforated | 15 ns |
For systems that remain intact throughout the simulations, the compositions are the results averaged over the last 24 ns of the trajectory. Trajectories producing pores were stopped upon pore formation at the times and compositions listed.
Table 4.
Results from two-step MCMD simulations for DMPC/DHPC/DDPC systems starting from perforated bilayers
| Run ID | α (×107) | αBL (×102) | DMPC % | DHPC % | Final configuration | Time |
|---|---|---|---|---|---|---|
| 300 K | ||||||
| P1 | 0.5 | 5 | 87.5% | 5.5% | Shrinking pore | 90 ns |
| P2 | 2 | 5 | 76.6% | 15.6% | Shrinking pore | 90 ns |
| P3 | 5 | 10 | 48.0% | 40.2% | Stable pore | 84 ns |
| P4 | 10 | 10 | 40.5% | 50.3% | Stable pore | 90 ns |
| P5 | 20 | 10 | 21.9% | 75.0% | Growing pore | 64 ns |
| P6 | 40 | 10 | 11.7% | 82.8% | Growing pore | 44 ns |
| 323 K | ||||||
| P7 | 0.2 | 1 | 74.2% | 18.1% | Shrinking pore | 40 ns |
| P8 | 0.5 | 2 | 43.0% | 47.6% | Stable pore | 75 ns |
| P9 | 1 | 2 | 29.8% | 65.0% | Cylinder | 120 ns |
| P9b | 1 | 2 | 41.0% | 53.1% | Growing Pore | 90 ns |
| P10 | 2 | 4 | 9.4% | 82.8% | Growing Pore | 50 ns |
For systems in which pores are stable throughout the simulations, the compositions are the results averaged over the last 24 ns of the trajectory. For systems in which pores shrink or expand continually, the compositions are extracted from the last frame of the simulation.
Edge composition analysis
To define the composition of the bilayer edge in systems containing pores of variable size and shape, we first located the edge of a bilayer by analyzing the variation of the water content in the system as a function of position in the xy plane (parallel to the bilayer surface). The water content is maximal in the pore interior, where a section along the z axis will contain only water, and lowest where the bilayer reaches its full thickness. The transition between the two marks the edge of the pore; we defined the edge location to be where water content drops to 70% of the maximum. Once the contour of a pore was identified, we computed the lateral distance between the phosphorus atom in each lipid and the contour to check whether a lipid was at the edge or not, using a cutoff distance of 1 nm (illustrated in Fig. S3 a). The choice of 1 nm for the cutoff distance was made to ensure that a pore is completely enclosed in the contour, and in the meantime, there is a reasonable area of flat bilayer existing outside of the contour. A typical contour line derived from this procedure is shown in Fig. S3 b in superposition with the pore. Occasionally, a DHPC molecule escapes the bilayer to float free in the solvent, as one would expect for a molecule with a critical micellar concentration of the order 10−2 M (48) in a system containing thousands of waters.
Results and Discussion
Timescales for equilibration
Fig. 2 shows the evolution of system composition over time for intact bilayer and perforated systems containing a mixture of primarily DMPC and DHPC to illustrate typical timescales for equilibrating system composition. In both cases, a steady, low level of the intermediate component lipid DDPC is established within 1 ns, similar to the relaxation time for compositions of binary mixtures in previous one-step simulations (34). The balance between DMPC and DHPC takes longer to stabilize, with equilibrium apparently established over an ∼10-ns timescale. Although this balance remains stable for intact bilayers, size and shape changes of pores contribute an additional slow component to the evolution of composition.
Figure 2.
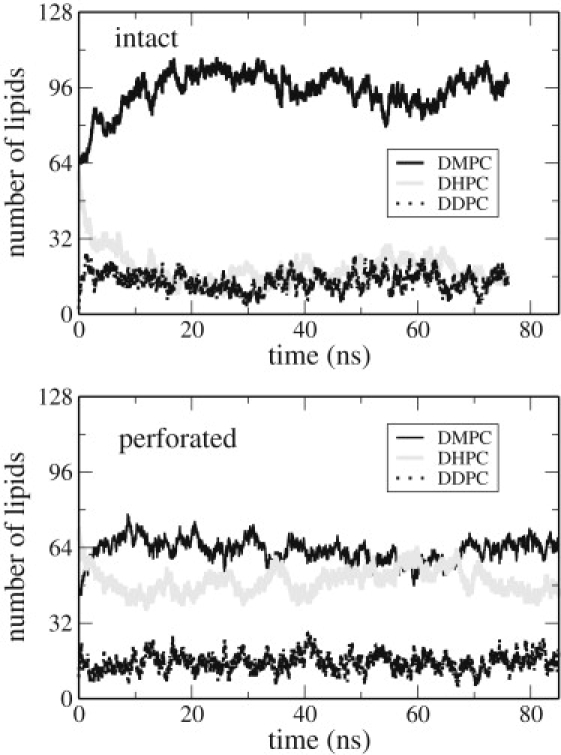
Composition fluctuations for an intact bilayer (system B3; upper panel) and a perforated bilayer (system P3; lower panel) at the same activity ratio, α = 5 × 10⁷ at 300 K.
Enrichment of DHPC at edge
As seen previously in DDPC/DMPC mixtures (35), atomistic simulation shows the shorter-tail lipid to be enriched at the bilayer edge, as is evident from snapshots of pore and ribbon structures shown in Fig. 3. The effect is stronger in the pseudobinary DHPC/(DDPC)/DMPC mixture presented here, as expected for the greater mismatch in tail length between DHPC and DMPC. We attempt to quantify the degree of enrichment in two ways. First, we compare the bulk composition from a separate simulation of an intact bilayer at the same activity ratios with the edge composition of pores and ribbons (Fig. 4). For a pore or ribbon edge of variable size and shape, the definition of the edge for these purposes is necessarily arbitrary. Using our definition (see Methods), we find that segregation is far from strict; in one case, for instance, we observe that 15% of the bulk consists of DHPC, whereas >40% of the edge consists of DMPC and DDPC. Increasing the temperature from 300 K to 323 K does not appreciably change the degree of partitioning, in contrast to experimental evidence that higher temperature drives DHPC away from the edge and toward the bilayer interior (21).
Figure 3.
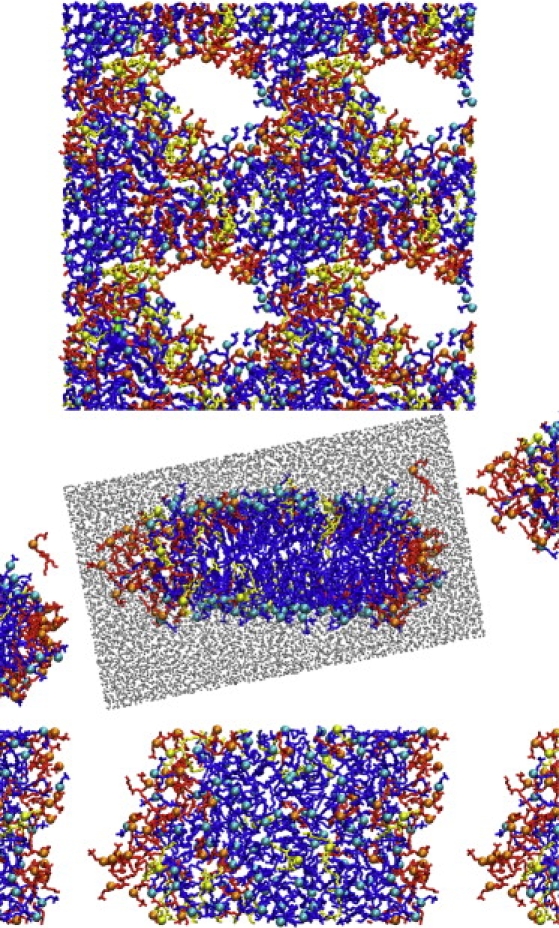
Top-view snapshot of pore-containing lipid bilayer (at top, system P3, four periodic images shown, total image size 13.5 × 13.6 nm) with water omitted for clarity. Cross-sectional and top views, respectively, of a bilayer ribbon (middle and bottom, system R3). Cross-sectional view includes solvent (gray) in the primary simulation box. Water is omitted in the top view. DHPC, DMPC, and DDPC are represented in red, blue, and yellow, respectively, with headgroup phosphorus sites highlighted as spheres.
Figure 4.
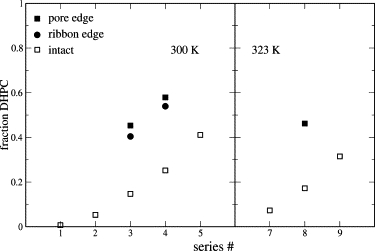
DHPC fractions in intact bilayers (open squares), pore edge (solid squares), and in ribbon edges (solid circles), for systems R3, B3, and P3 (see Tables 2–4, respectively).
The line excess density of DHPC, essentially the number of extra DHPC molecules attracted to the edge per unit length of edge created from an intact bilayer (35,49,50), was also calculated from the ribbon simulations. For simplicity, DMPC and DDPC were treated as equivalent during this calculation. At all three ribbon compositions, ∼3 excess molecules of DHPC/nanometer of edge were observed (Table 2). For comparison, earlier simulations of mixed DMPC and DDPC ribbons yielded an edge excess of ∼2 DDPC molecules/nm (35).
Pore-pore contacts
In several cases, where pores are close to their images across the periodic boundaries, we observe a local reversal of the expected distribution of lipid orientations: DHPC headgroups are arrayed in the bilayer plane, whereas DMPC headgroups line the pore (see Fig. 3). When the neck, or stalk, dividing two pores becomes narrow enough, the local structure becomes similar to that of a cylindrical or quasicylindrical micelle—known to be stable in some regions of the DMPC/DHPC phase diagram (16,18). We hypothesize that the more isotropic local environment of the neck allows the two components to mix to a much greater extent than when the edge and the bilayer present distinct microenvironments. This extra miscibility may stabilize the point of contact and hinder either fusion or separation of the pores. Such stabilization could help to explain experimental observations of stability of perforated vesicle and perforated lamellar structures containing high concentrations of pores (16,18), which were not predicted by early models of bicelle structure. Without this stabilization of pore-pore contacts, one would expect a porous vesicle to be susceptible to fragmentation into many smaller disklike aggregates (maintaining the same overall area/edge length ratio), driven by both the translational and rotational entropy associated with their release and the elimination of the elastic energy associated with the curvature of the vesicle.
Thermodynamic stability of the edge
As one expects from basic thermodynamics, enrichment of DHPC at the edge is accompanied by an increase in edge stability, analogous to stabilization of a two-dimensional interface by a surfactant (51). In other words, it is an edge-actant whose presence reduces the excess free energy/unit length of the edge, or line tension Λ (50). As the hallmark of the classical bicelle structure is the stability of the edge, we consider the question: what is the minimum fraction of DHPC needed to reduce Λ to zero? In previous CG simulations of long- and short-tailed lipid mixtures (52), the line tension was obtained over a range of compositions from analysis of pressure anisotropy in bilayer ribbons (5,53,54) using the relationship
| (1) |
where Lx and Ly are the lengths of the simulation box in the dimensions perpendicular to the ribbon edge, and Pxx, Pyy and Pzz are the mean diagonal elements of the pressure tensor with the edge aligned along the z axis. For the CG model, the line tension decreased monotonically with increasing short-tail lipid composition and dropped below zero, indicating stable edges, when the short-tail lipid composition of the bilayer reached ∼20%. In the case presented here, the use of Eq. 1 to evaluate line tension (Table 2) yields confusing results. The line tension does not decrease monotonically with the fraction of DHPC: systems R3 (α = 5 × 10⁷) and R5 (α = 20 × 107) yield negative values of Λ (suggesting a stable edge), whereas R4 (α = 10 × 107), with an intermediate fraction of short-tail lipid, yields positive values of Λ (indicating an unstable edge). A possible factor behind this complication is the freedom of the ribbons to rotate and interact indirectly with their periodic images; ribbon R4 happens to have rotated more than R3 or R5. In ribbon system R5, the stability of the edge is evident from the large undulations in the ribbon contour. At yet higher DHPC content (R6), a pore spontaneously appears in the bilayer portion of the ribbon within 10 ns (Fig. S1).
As an alternative qualitative measure of edge stability, we observed the dynamics of preexisting pores modeled at different compositions at zero surface tension (Fig. 5). At 300 K, the pores clearly shrank on the simulation timescale for systems P1 and P2 (activity ratios of 0.5 × 10⁷ and 2 × 10⁷), whereas pores were stable or grew at activity ratios α = 5 × 10⁷ and above (P3–P6). From this behavior, we tentatively conclude that in our model, the limit of edge stability at 300 K lies between activity ratios α = 2 × 10⁷ and α = 5 × 10⁷, which correspond to compositions of 5% and 13% DHPC in intact bilayers (Table 3). At 323 K, the transition from unstable to stable pores occurred between α = 2 × 10⁶ and α = 5 × 10⁶, corresponding to a range of bulk compositions between 7% and 17%. Using 31P-NMR experiments, Triba et al. found ∼2–3% DHPC in the bilayer region at the limit of edge stability at 300 K, increasing to ∼12% at 323 K (21). The discrepancy in the simulated and experimental limiting compositions suggests that the model described in this study may overpredict the miscibility of DHPC with DMPC in the bilayer and/or underpredict the ability of DHPC to stabilize the edge. The origins of this discrepancy are difficult to identify, but some candidates include imperfections in the force field, finite size effects, and the use of a ternary DMPC-DDPC/DHPC mixture in place of the binary DMPC/DHPC mixture. The simulations confirm the conclusions of Triba et al. that DHPC is quite likely to mix with DMPC in the bilayer region to a nonnegligible degree. Although the decrease in pore size with decreasing DHPC fraction appears to be in line with recent experimental findings (19), this agreement may only be a trivial result of the artificially fixed ratio of one pore per 128 lipids imposed by the simulation's periodic boundary conditions.
Figure 5.
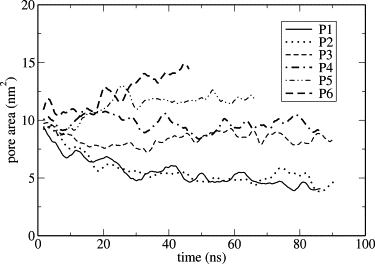
Time evolution of pore area in pore-containing systems at various activity ratios. Data are smoothed with a 2-ns window for clarity.
As the ratio of DHPC to DMPC is increased beyond the apparent minimum for edge stability, several different behaviors are seen. In systems P5 and P6, the pores expand to the extent that they come into close contact with their periodic images in the bilayer (xy) plane. The resulting structure appears more like a system of branched cylindrical micelles than a porous bilayer (see Fig. S3). In system P9 (at 323 K), periodic images of pores merged into a channel separating images of a wormlike micelle structure (Fig. S4). It should be noted that the composition in this system has considerably higher DHPC content (65%) than observed in mixed DMPC/DHPC wormlike micelles identified in orientable nematic phases (15,16,18). Those structures, with a lower proportion of DHPC (20–30%) are likely to display a more ellipsoidal or ribbonlike aspect. Interpretation of all these high-DHPC structures is complicated by spurious effects of the periodic boundary conditions, as pore expansion in the xy plane is accompanied by shrinking of the z dimension of the simulation box to maintain roughly constant total volume, and interactions between periodic images limit the degree of expansion possible.
Consideration of a two-phase, two-state model
A key assumption in simple models of bicelle structure is that the edge and bulk compositions each remain fixed while the variation of total system lipid composition only alters the number ratio of edge lipids to bulk lipids, placing geometric constraints on aggregate size and morphology. The ideal bicelle model (14) treats this segregation as perfect, whereas the two-phase, two-state (TPTS) (21) model assumes a partitioning of the two components that may vary with temperature but is independent of total composition. The analysis of 31P-NMR signals from the two components in bicelle mixtures by Triba et al. (21) fits well with the TPTS model. The TPTS model neglects the coupling of the edge properties to the composition of the bulk, a factor that can alter the bulk-edge partitioning as the ratio of edge lipids to bulk lipids becomes large. It is worth noting, therefore, that the good fits to the TPTS model in Fig. 5 of Triba et al. (21) are dominated by the high-DMPC regime where, due to the small amount of edge present, the influence of edge-bilayer coupling on the partitioning is expected to be minor. As previous simulations using a CG model for a bicellelike mixture (52) have shown that thermodynamically stable edges can be observed over a range of bilayer compositions, in violation of the TPTS model, it is of interest to consider the model in light of the computational results presented here.
In a semigrand-canonical ensemble simulation, a system that strictly follows TPTS behavior is expected to show a transition in behavior at a value of ΔμDH-DM, unique to a given temperature, that yields zero line tension and specific compositions at the edge and bilayer interior. At lower ΔμDH-DM, the DHPC concentration would be insufficient to eliminate the line tension, and pores thus would tend to close. At higher ΔμDH-DM, pores would form spontaneously and the bilayer would lose structural integrity. Only in a very narrow range of ΔμDH-DM would edges coexist with the bilayer.
The simulations presented here do not exhibit this expected behavior, as both pores and unperforated bilayer structures are stable over a range of ΔμDH-DM. In this case, however, the pores and/or the intact bilayers are almost certainly metastable over part or all of this range. The formation of a pore presumably requires a high local density of DHPC, which may not be kinetically accessible given the rate of composition fluctuations. Only at very high DHPC concentration (62% DHPC, α=4 × 10⁸) do we observe spontaneous pore formation in an intact bilayer within an ∼40-ns timescale. The determination of edge stability in this case is similarly inexact, in the absence of precise line tension data. Therefore, although these simulations appear to indicate the breakdown of the TPTS model, ultimately their limited trajectory times render them inconclusive on this point.
Structure of intact bilayers
The positioning of long and short lipid headgroups with respect to the bilayer normal in intact bilayers is also of interest. In previous work on binary fluid-phase mixtures differing by 4 carbons/tail (34,36), deviations between bilayer thicknesses calculated according to mean phosphorus site normal distributions of long and short lipids have been <0.1 nm. In the DMPC/DHPC mixtures discussed here, thickness differences of up to 0.2–0.3 nm are observed at 300 K, indicating that the DMPC headgroups protrude a little over 0.1 nm farther into the solution on average than DHPC headgroups, with the divergence decreasing as DHPC composition increases, or when the temperature is raised to 323 K (Fig. 6). These shifts are much smaller than the differences in tail length, indicating that the structural accommodation is achieved mostly by positioning and conformational rearrangement of the tails rather than the headgroups. Shifts of similar magnitude were seen previously in simulations of gel-phase DMPC/DSPC mixtures (36).
Figure 6.
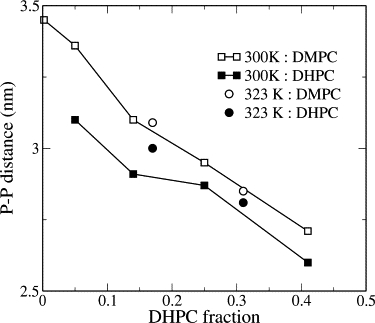
Distance between peaks of upper- and lower-leaflet phosphorus site distributions along the bilayer normal for DMPC and DHPC in intact bilayers.
Tail orientational order
C-H bond order parameters provide a measure of tail order, and have been studied in mixed bilayers (with the tails of one component deuterium-labeled) via NMR spectroscopy (55), as well as simulation (34). For intact bilayers, the magnitude of the DMPC tail order parameter drops progressively with increasing fractions of DHPC, whereas that for DHPC hardly changes (see Fig. 7). The presence of a pore leads to yet lower order parameters, both for the DHPC (which is enriched at the rim of the pore) and, to a lesser extent, for the DMPC, as lipids aligned perpendicular to the overall bilayer normal have a negative contribution to the mean. We note that the effect of the pore on DMPC order parameter is more pronounced for carbons nearer the headgroup; the ends of the tails apparently extend far enough away from the pore rim that they adopt orientational distributions similar to tail ends in the intact bilayer.
Figure 7.
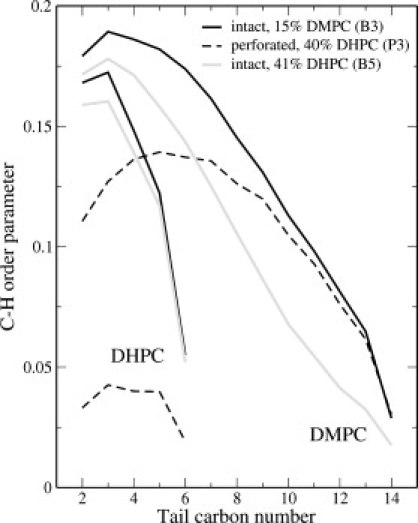
C-H bond order parameters for acyl tails of intact and perforated bilayers (runs B3 and P3) at the same activity ratio, and for an intact bilayer (run B5) at a composition similar to that of the perforated bilayer.
Conclusions
Atomistic simulation of a quasibinary mixture of DMPC and DHPC in intact bilayers, pore-containing bilayers, and bilayer ribbons has been achieved using a two-step semigrand-canonical mixed MC/MD approach, with a small concentration of DDPC included to facilitate transitions between DMPC and DHPC. As expected, DHPC is greatly enriched at the bilayer edge; however, a significant amount of DMPC is also present at the edge. Partitioning of the two components between edge and bilayer environments is only weakly temperature-dependent. Relative to experiment, the simulation model here overpredicts the minimum mole fraction of DHPC needed to stabilize the edge. These simulations support some elements of the TSTP model, namely, that both the edge and interior regions should be treated as mixtures of DMPC and DHPC rather than as pure phases. A unique pair of compositions at which both edge and bilayer environments are stable and at equilibrium with each other could not, however, be identified. In intact bilayer environments, DHPC and DMPC showed small (∼0.1 nm) differences in headgroup distribution with respect to the bilayer normal. The C-H order parameter profiles for long and short lipids in mixed bilayers are distinctly different in pore-containing and intact mixed bilayers, even at the same overall composition. The distribution of long and short lipids in regions of close contact between pores shows a higher degree of mixing than seen at other bilayer edges, suggesting a possible mechanism for pore-pore attraction that could be a key element in the stability of large porous bilayer vesicles, whose stability has been described experimentally but never fully rationalized.
Supporting Material
Four figures are available at http://www.biophysj.org/biophysj/supplemental/S0006-3495(10)00407-8.
Supporting Material
Acknowledgments
This work was supported by National Science Foundation grants CHE-0616383 and CHE-0911285.
References
- 1.Israelachvili J.N., Mitchell D.J., Ninham B.W. Theory of self-assembly of hydrocarbon amphiphiles into micelles and bilayers. J. Chem. Soc., Faraday Trans. 1976;72:1525–1568. [Google Scholar]
- 2.Karatekin E., Sandre O., Brochard-Wyart F. Cascades of transient pores in giant vesicles: line tension and transport. Biophys. J. 2003;84:1734–1749. doi: 10.1016/S0006-3495(03)74981-9. [DOI] [PMC free article] [PubMed] [Google Scholar]
- 3.Srividya N., Muralidharan S., Tripp B. Determination of the line tension of giant vesicles from pore-closing dynamics. J. Phys. Chem. B. 2009;112:7147–7152. doi: 10.1021/jp7119203. [DOI] [PubMed] [Google Scholar]
- 4.May S. A molecular model for the line tension of lipid membranes. Eur. Phys. J. E. 2000;3:37–44. [Google Scholar]
- 5.Wohlert J., den Otter W.K., Briels W.J. Free energy of a trans-membrane pore calculated from atomistic molecular dynamics simulations. J. Chem. Phys. 2006;124:154905. doi: 10.1063/1.2171965. [DOI] [PubMed] [Google Scholar]
- 6.Moldovan D., Pinisetty D., Devireddy R.V. Molecular dynamics simulation of pore growth in lipid bilayer membranes in the presence of edge-active agents. Appl. Phys. Lett. 2007;91 204104–204104-3. [Google Scholar]
- 7.Fromherz P. Lipid-vesicle structure: size control by edge-active agents. Chem. Phys. Lett. 1983;94:259–266. [Google Scholar]
- 8.Lin T.L., Liu C.C., Chen S.H. Structure of mixed short-chain lecithin long-chain lecithin aggregates studied by small-angle neutron-scattering. J. Phys. Chem. 1991;95:6020–6027. [Google Scholar]
- 9.Sanders C.R., Schwonek J.P. Characterization of magnetically orientable bilayers in mixtures of dihexanoylphosphatidylcholine and dimyristoylphosphatidylcholine by solid-state NMR. Biochemistry. 1992;31:8898–8905. doi: 10.1021/bi00152a029. [DOI] [PubMed] [Google Scholar]
- 10.Sanders C.R., Landis G.C. Reconstitution of membrane-proteins into lipid-rich bilayered mixed micelles for NMR studies. Biochemistry. 1995;34:4030–4040. doi: 10.1021/bi00012a022. [DOI] [PubMed] [Google Scholar]
- 11.Prosser R.S., Evanics F., Al-Abdul-Wahid M.S. Current applications of bicelles in NMR studies of membrane-associated amphiphiles and proteins. Biochemistry. 2006;45:8453–8465. doi: 10.1021/bi060615u. [DOI] [PubMed] [Google Scholar]
- 12.Faham S., Boulting G.L., Bowie J.U. Crystallization of bacteriorhodopsin from bicelle formulations at room temperature. Protein Sci. 2005;14:836–840. doi: 10.1110/ps.041167605. [DOI] [PMC free article] [PubMed] [Google Scholar]
- 13.Tjandra N., Bax A. Direct measurement of distances and angles in biomolecules by NMR in a dilute liquid crystalline medium. Science. 1997;278:1111–1114. doi: 10.1126/science.278.5340.1111. [DOI] [PubMed] [Google Scholar]
- 14.Vold R.R., Prosser R.S. Magnetically oriented phospholipid bilayered micelles for structural studies of polypeptides. Does the ideal bicelle exist? J. Biomol. NMR. 1996;9:267–271. [Google Scholar]
- 15.Nieh M.-P., Raghunathan V.A., Katsaras J. Magnetically alignable phase of phospholipid “bicelle” mixtures is a chiral nematic made up of wormlike micelles. Langmuir. 2004;20:7893–7897. doi: 10.1021/la048641l. [DOI] [PubMed] [Google Scholar]
- 16.van Dam L., Karlsson G., Edwards K. Direct observation and characterization of DMPC/DHPC aggregates under conditions relevant for biological solution NMR. Biochim. Biophys. Acta. 2004;1664:241–256. doi: 10.1016/j.bbamem.2004.06.005. [DOI] [PubMed] [Google Scholar]
- 17.van Dam L., Karlsson G., Edwards K. Morphology of magnetically aligning DMPC/DHPC aggregates-perforated sheets, not disks. Langmuir. 2006;22:3280–3285. doi: 10.1021/la052988m. [DOI] [PubMed] [Google Scholar]
- 18.Harroun T.A., Koslowsky M., Katsaras J. Comprehensive examination of mesophases formed by DMPC and DHPC mixtures. Langmuir. 2005;21:5356–5361. doi: 10.1021/la050018t. [DOI] [PubMed] [Google Scholar]
- 19.Soong R., Majonis D., Macdonald P.M. Size of bicelle defects probed via diffusion nuclear magnetic resonance of PEG. Biophys. J. 2009;97:796–805. doi: 10.1016/j.bpj.2009.05.034. [DOI] [PMC free article] [PubMed] [Google Scholar]
- 20.Soong R., Nieh M.-P., Macdonald P.M. Bicellar mixtures containing pluronic F68: morphology and lateral diffusion from combined SANS and PFG NMR studies. Langmuir. 2010;26:2630–2638. doi: 10.1021/la902795h. [DOI] [PubMed] [Google Scholar]
- 21.Triba M.N., Warschawski D.E., Devaux P.F. Reinvestigation by phosphorus NMR of lipid distribution in bicelles. Biophys. J. 2005;88:1887–1901. doi: 10.1529/biophysj.104.055061. [DOI] [PMC free article] [PubMed] [Google Scholar]
- 22.Soong R., Macdonald P.M. Water diffusion in bicelles and the mixed bicelle model. Langmuir. 2009;25:380–390. doi: 10.1021/la801739a. [DOI] [PubMed] [Google Scholar]
- 23.Marrink S.J., de Vries A.H., Tieleman D.P. Lipids on the move: simulations of membrane pores, domains, stalks and curves. Biochim. Biophys. Acta. 2009;1788:149–168. doi: 10.1016/j.bbamem.2008.10.006. [DOI] [PubMed] [Google Scholar]
- 24.Marrink S.J., Lindahl E., Mark A.E. Simulation of the spontaneous aggregation of phospholipids into bilayers. J. Am. Chem. Soc. 2001;123:8638–8639. doi: 10.1021/ja0159618. [DOI] [PubMed] [Google Scholar]
- 25.de Vries A.H., Mark A.E., Marrink S.J. The binary mixing behavior of phospholipids in a bilayer: a molecular dynamics study. J. Phys. Chem. B. 2004;108:2454–2463. [Google Scholar]
- 26.Imparato A., Shillcock J.C., Lipowsky R. Shape fluctuations and elastic properties of two-component bilayer membranes. Europhys. Lett. 2005;69:650–656. [Google Scholar]
- 27.Faller R., Marrink S.-J. Simulation of domain formation in DLPC-DSPC mixed bilayers. Langmuir. 2004;20:7686–7693. doi: 10.1021/la0492759. [DOI] [PubMed] [Google Scholar]
- 28.Stevens M.J. Complementary matching in domain formation within lipid bilayers. J. Am. Chem. Soc. 2005;127:15330–15331. doi: 10.1021/ja043611q. [DOI] [PubMed] [Google Scholar]
- 29.May E.R., Kopelevich D.I., Narang A. Coarse-grained molecular dynamics simulations of phase transitions in mixed lipid systems containing LPA, DOPA, and DOPE lipids. Biophys. J. 2008;94:878–890. doi: 10.1529/biophysj.107.113951. [DOI] [PMC free article] [PubMed] [Google Scholar]
- 30.Izvekov S., Voth G.A. A multiscale coarse-graining method for biomolecular systems. J. Phys. Chem. B. 2005;109:2469–2473. doi: 10.1021/jp044629q. [DOI] [PubMed] [Google Scholar]
- 31.Lu L., Voth G.A. Systematic coarse-graining of a multicomponent lipid bilayer. J. Phys. Chem. B. 2009;113:1501–1510. doi: 10.1021/jp809604k. [DOI] [PMC free article] [PubMed] [Google Scholar]
- 32.Pandit S.A., Scott H.L. Multiscale simulations of heterogeneous model membranes. Biochim. Biophys. Acta. 2009;1788:136–148. doi: 10.1016/j.bbamem.2008.09.004. [DOI] [PMC free article] [PubMed] [Google Scholar]
- 33.Elezgaray J., Laguerre M. A systematic method to derive force fields for coarse-grained simulations of phospholipids. Comput. Phys. Commun. 2006;175:264–268. [Google Scholar]
- 34.de Joannis J., Jiang Y., Kindt J.T. Equilibrium distributions of dipalmitoyl phosphatidylcholine and dilauroyl phosphatidylcholine in a mixed lipid bilayer: atomistic semigrand canonical ensemble simulations. J. Phys. Chem. B. 2006;110:25875–25882. doi: 10.1021/jp065734y. [DOI] [PubMed] [Google Scholar]
- 35.Wang H., de Joannis J., Kindt J.T. Bilayer edge and curvature effects on partitioning of lipids by tail length: atomistic simulations. Biophys. J. 2008;95:2647–2657. doi: 10.1529/biophysj.108.131409. [DOI] [PMC free article] [PubMed] [Google Scholar]
- 36.Coppock P.S., Kindt J.T. Atomistic simulations of mixed-lipid bilayers in gel and fluid phases. Langmuir. 2009;25:352–359. doi: 10.1021/la802712q. [DOI] [PubMed] [Google Scholar]
- 37.Siepmann J.I., Frenkel D. Configurational bias Monte-Carlo: a new sampling scheme for flexible chains. Mol. Phys. 1992;75:59–70. [Google Scholar]
- 38.Escobedo F.A., de Pablo J.J. Expanded grand canonical and Gibbs ensemble Monte Carlo simulation of polymers. J. Chem. Phys. 1996;105:4391–4394. [Google Scholar]
- 39.Lindahl E., Hess B., van der Spoel D. Gromacs 3.0: a package for molecular simulation and trajectory analysis. J. Mol. Model. 2001;7:306–317. [Google Scholar]
- 40.van Gunsteren W.F., Berendsen H.J.C., Rullmann J.A.C. Stochastic dynamics for molecules with constraints: Brownian dynamics of n-alkanes. Mol. Phys. 1981;44:69–95. [Google Scholar]
- 41.Humphrey W., Dalke A., Schulten K. VMD: visual molecular dynamics. J. Mol. Graph. 1996;14:33–38. doi: 10.1016/0263-7855(96)00018-5. 27–28. [DOI] [PubMed] [Google Scholar]
- 42.Berger O., Edholm O., Jähnig F. Molecular dynamics simulations of a fluid bilayer of dipalmitoylphosphatidylcholine at full hydration, constant pressure, and constant temperature. Biophys. J. 1997;72:2002–2013. doi: 10.1016/S0006-3495(97)78845-3. [DOI] [PMC free article] [PubMed] [Google Scholar]
- 43.Berendsen H.J.C., Postma J.P.M., Hermans J. Interaction models for water in relation to protein hydration. In: Pullman B., editor. Intermolecular Forces. D. Reidel, Dordrecht; The Netherlands: 1981. [Google Scholar]
- 44.Hess B., Bekker H., Fraaije J.G.E.M. LINCS: a linear constraint solver for molecular simulations. J. Comput. Chem. 1997;18:1463–1472. [Google Scholar]
- 45.Miyamoto S., Kollman P.A. SETTLE: an analytical version of the SHAKE and RATTLE algorithm for rigid water models. J. Comput. Chem. 1992;13:952–962. [Google Scholar]
- 46.Essmann U., Perera L., Pedersen L.G. A smooth particle mesh Ewald method. J. Chem. Phys. 1995;103:8577–8593. [Google Scholar]
- 47.Tieleman D.P., Berendsen H.J.C. A molecular dynamics study of the pores formed by Escherichia coli OmpF porin in a fully hydrated palmitoyloleoylphosphatidylcholine bilayer. Biophys. J. 1998;74:2786–2801. doi: 10.1016/S0006-3495(98)77986-X. [DOI] [PMC free article] [PubMed] [Google Scholar]
- 48.Tausk R.J.M., Oudshoorn C., Overbeek J.T.G. Physical chemical studies of short-chain lecithin homologues. 3. Phase separation and light scattering studies on aqueous dioctanoyllecithin solutions. Biophys. Chem. 1974;2:53–63. doi: 10.1016/0301-4622(74)80024-4. [DOI] [PubMed] [Google Scholar]
- 49.de Joannis J., Jiang F.Y., Kindt J.T. Coarse-grained model simulations of mixed-lipid systems: composition and line tension of a stabilized bilayer edge. Langmuir. 2006;22:998–1005. doi: 10.1021/la051278d. [DOI] [PubMed] [Google Scholar]
- 50.Puech P.-H., Borghi N., Brochard-Wyart F. Line thermodynamics: adsorption at a membrane edge. Phys. Rev. Lett. 2003;90:128304. doi: 10.1103/PhysRevLett.90.128304. [DOI] [PubMed] [Google Scholar]
- 51.Safran S.A. Addison-Wesley; Reading, MA: 1994. Statistical Thermodynamics of Surfaces, Interfaces, and Membranes. [Google Scholar]
- 52.Jiang Y., Kindt J.T. Simulations of edge behavior in a mixed-lipid bilayer: fluctuation analysis. J. Chem. Phys. 2007;126:045105. doi: 10.1063/1.2430714. [DOI] [PubMed] [Google Scholar]
- 53.Tolpekina T.V., den Otter W.K., Briels W.J. Nucleation free energy of pore formation in an amphiphilic bilayer studied by molecular dynamics simulations. J. Chem. Phys. 2004;121:12060–12066. doi: 10.1063/1.1815296. [DOI] [PubMed] [Google Scholar]
- 54.Jiang F.Y., Bouret Y., Kindt J.T. Molecular dynamics simulations of the lipid bilayer edge. Biophys. J. 2004;87:182–192. doi: 10.1529/biophysj.103.031054. [DOI] [PMC free article] [PubMed] [Google Scholar]
- 55.Lu D., Vavasour I., Morrow M.R. Smoothed acyl chain orientational order parameter profiles in dimyristoylphosphatidylcholine-distearoylphosphatidylcholine mixtures: a 2H-NMR study. Biophys. J. 1995;68:574–583. doi: 10.1016/S0006-3495(95)80219-5. [DOI] [PMC free article] [PubMed] [Google Scholar]
Associated Data
This section collects any data citations, data availability statements, or supplementary materials included in this article.